Magyar és angol nyelvű tananyagfejlesztés
a munkaerőpiaci szereplők bevonásával és az angol nyelvű képzés fejlesztése a Debreceni Egyetem Gyógyszerésztudományi Karán.
TÁMOP-4.1.2-08/1/A-2009-0006
Selected chapters of Biopharmacy
Selected chapters of Biopharmacy Lecture notes
Gabor Halmos, Pharm.D., Ph.D.
Professor and Chair Department of Biopharmacy
University of Debrecen
Medical and Health Science Center School of Pharmacy
Kiadó • Budapest, 2011
© Prof. Dr. Halmos Gábor, 2011
Kézirat lezárva: 2011. október 31.
ISBN KIADÓ
A kiadásért felel a:
Felelős szerkesztő:
Műszaki szerkesztő:
Terjedelem:
TABLE OF CONTENTS
Preface ... 5
Pharmacokinetic bases of biopharmacy (G. Halmos) ... 6
Principles of pharmaceutical biotecnology(A. Treszl) ... 34
Biotechnology in pharmaceutical manufacturing (A. Treszl)) ... 44
Monoclonal antibodies and targeted therapy (G. Halmos) ... 67
Biotechnology drugs of the future (G. Halmos) ... 74
Stem cell therapy (A. Treszl) ... 85
Preparation of biological medicines (S. Csiha, G. Halmos) ... 95
Liposomes and nanotechnology (A. Buglyo) ... 110
Ophthalmological drug delivery systems (Z. Steibert) ... 121
Medications in Pregnancy and Lactation (A. Heitz) ... 140
The most common diseases and their therapy during pregnancy (A. Heitz) ... 147
Medication therapy in lactation (A. Heitz) ... 158
PREFACE
As pharmacy students prepare to take Biopharmacy examination and final exams before graduation, it is imperative that they have the most up-to-date and relevant information concerning the practice of modern pharmacy available to them. The information explosion is such that knowledge and information changes daily and dozens of new drugs are marketed each year. The amount of information that any student in pharmacy must master is significant and doubles every 2 to 3 years. Although information in the life sciences is expanding rapidly, human brain capacity is not. This discrepancy creates an increasing challenge for book and lecture notes writers, teachers, and especially students. We have been forced to think harder in deciding what facts and concepts are important or essential for our students related to Biopharmacy. Based on these facts this study guide has attempted to summarize selected chapters of modern Biopharmacy.
My thanks and appreciation go to my associates, the faculty of the University of Debrecen Medical and Health Science Center, Department of Biopharmacy (Dr. Andrea Treszl, Dr.
Armin Buglyo, Dr. Aniko Heitz, Sara Csiha) and other faculty members of the Health Science Center (Dr. Zita Steiber, Dr. Rudolf Gesztelyi) who participated in preparing this lecture notes, and to Dr. Zsuzsanna Szabo for her coordination of the preparation of the chapters. I am especially grateful to all these collegues and experts who made major contributions to individual sections. Finally, I wish to thank to Lawrence M. Brown, PharmD, Ph.D., Associate Professor, University of Tennessee Health Science Center College of Pharmacy Department of Pharmaceutical Sciences, Memphis, TN, U.S.A. for his outstanding editorial work.
PHARMACOKINETIC BASES OF BIOPHARMACY
Introduction
Place of biopharmacy within the pharmacy disciplines
Practicing medicine is inconceivable without the use of pharmacons; molecules that are able to substantially influence the living organism even when used in small concentrations (Most of the pharmacons used in the medicinal practice are pharmaceuticals. The distinction of these two terms generally used as synonyms is justified by the fact that the term pharmacon is a purely theoretical term, whereas the term pharmaceutical is also a legal category). The pharmacons‘ properties and general aspects of their use are described by pharmacology that may be divided into two subdisciplines: pharmacokinetics and pharmacodynamics.
Pharmacokinetics investigates the effect living organisms exert on the pharmacon, and pharmacodynamics assesses the pharmacon‘s effect on the living organism. Pharmaceutical technology deals with the manufacturing procedures, vehicles and other supplements that are needed to turn a pharmacon into a pharmaceutical form that may be used with a specific purpose at a specific location or will result in a drug releasing system. Biopharmacy is a relatively new discipline, (the term was created by Levy and Wagner in 1961), that deals with the behavior of even more complex pharmaceutical forms and drug releasing systems in living organisms.
Although biopharmacy is closely related to pharmaceutical technology, the therapeutic value of a pharmaceutical preparation (or dosage regime) is determined by the active agent(s)‘
distribution in the body and the time course of the change in concentration; both of which topics are covered by pharmacokinetics. First the major pharmacokinetic principles will be discussed.
1. Qualitative pharmacokinetics
Didactically, pharmacokinetics may be divided into qualitative and quantitative parts.
Qualitative pharmacokinetics deals with the processes of the living organism that determines the fate of the pharmacon in the organism. The main processes influencing pharmacons are usually discussed using the acronym ADME. ADME describes the pharmacon‘s fate in the body starting from absorption, distribution, and leading up to metabolism and excretion. If
the pharmacon‘s fate is followed from its liberation from the pharmaceutical form then the acronym LADME is used. Sometimes we may come across the term LADMER that includes even the response given to the pharmacon, naturally this already falls out of the topic of pharmacokinetics. Collectively metabolism and excretion are called elimination, because a specific molecule either changes or leaves the body unchanged. Elimination of the metabolite, therefore, is not a distinct elimination step; rather it is only the release of the derivate of the eliminated pharmacon from the body. It should be noted however that pharmacokinetic elimination doesn‘t necessarily lead to the end of the effect as active metabolites or the permanent changes elicited by the pharmacon (e.g. irreversible inhibition of an enzyme or a receptor, alteration of the DNA) may prolong the effect. Collectively distribution and elimination are called disposition. Qualitative pharmacokinetics is dealt with in a different chapter of this study notes. Now we discuss some details about the basic components of this LADME system.
1.1. Absorption, routes of administration
Absorption refers to the process of drug movement from the site of administration to the systemic circulation. Obviously, there is no absorption when the drug is given intravenously.
Ideally, we want the drug to be present only at the site of its biological action. In reality, however, this happens rarely. The bioavailability shows what percentage of the drug reaches the systemic circulation in unchanged form. It depends on the formulation, the administration route, and the hepatic first pass metabolism; it is 100% if the drug was given intravenously and less in any other cases. Bioavailability is a very important pharmacokinetic parameter, which is necessary to know in order to calculate the dosage of a certain drug preparation.
The administration route determines the onset of action, the blood concentration to be reached and the length of time the drug remains in the body. It may be (A) oral, (B) parenteral and (C) topical. Oral administration means that the drug is taken by mouth and is swallowed. It is absorbed from the gastrointestinal tract into the circulation and carried to the site of action by the blood. Preparations for oral administration are tablets, capsules, solutions, suspensions, emulsions… etc. Parenteral administration means that the drug enters the vascular system without passing through the gastrointestinal system. Examples include vaginal tablets and creams, inhalational solutions, or by intramuscular or intravenous injections. The advantage of topical administration is that the site of action is the same as the
site of application e.g. the skin or mucous membranes; to achieve a local effect. Creams, ointments, powders, solutions, sprays are administered this way.
The choice of the administration route depends on (1) what kind of effect (local or distant) is required, (2) how fast the effect should be evoked, (3) how long of an effect is desirable, (4) how convenient the administration is supposed to be, and (5) what physicochemical, pharmacological and toxicological properties the drug has. Of course, the most convenient route for the patient is oral, yet several substances are broken down by gastric acid (e.g.
peptide hormones like insulin, some penicillins), so their parenteral administration is inevitable. In case of emergency care a prompt action is required, so inhalation and intravenous administrations are preferred. In patients with liver or kidney failure it is advised to choose a route, which is less challenging and use the topical way if possible. If the patient is poorly cooperative, sustained release depot preparations can be given under the skin or intramuscularly, to release the drug continuously and maintain a constant blood level.
The transport of drugs across biological membranes
The penetration of drugs through biological membranes is greatly influenced by their lipid/water distribution, which is characterized by the partition coefficient. The more polar or ionized the molecule, the smaller the partition coefficient. If ionization is cut down by the local pH, the unionized (apolar, lipophilic) molecule easily diffuses through the membranes.
Drugs can cross the biological membranes by different methods (1) Passive diffusion is available for apolar, lipophilic substances, with big lipid/water partition coefficient (e.g.
inhalation anesthetics). (2) Filtration may help the transport of small (molecular weight is less than 100), and water soluble molecules (e.g. urea). Filtration rate is determined by the pressure difference between the two sides of the membrane, molecular size and membrane pore size. (3) Some drugs are transported across the membranes by active transport mechanism, against their concentration gradient, which is an energy demanding process. The protein carriers that take the drugs are specific for endogenous substances, and can carry only the drugs with similar size and structure. They are saturable, and may act as a site of drug interaction. (4) The facilitated diffusion mechanism also uses carriers, but work further down the concentration gradient and does not require energy. (5) Highly charged molecules (e.g. those containing quaterneric N) may form ion pairs with the opposite charge
and become apolar, to then cross the membranes with passive diffusion. (6) Extreme large molecules, antibodies, radionuclide-carriers, pegylated substances wrapped up in liposomes can enter the cells by endocytosis, and be released from the liposomes within the intracellular space.
1.2. Drug distribution
During drug development it is very important to know where and how the drug is distributed in the human body. They need answers for questions like how the drug reaches its target, how long does it take to develop an effect and for how long its biological effect is sustained. All this information is used when designing the most appropriate dose, the route of administration, and formulation.
Most drugs are water soluble and reach their target via the bloodstream. In the blood they are usually carried by plasma proteins, which determine the extent and rate of their ability to cross the biological membranes and achieve an effective extravascular concentration. The ionization of the drug, depending on local pH, and relative solubility of the drug in lipids and water are also important factors, which determine drug distribution.
Drugs are distributed within the body compartments. They can be defined as follows: total body water is approximately 60% of the total body weight ( 0,5 l/kg), for example 40-45 l for a person weighing 70 kg. Total body water is divided into intracellular (40% of body weight; 25-35 l) and extracellular compartments (20% of body weight; 10-20 l). Certain parts of the extracellular compartment are the plasma (4% of body weight; 2-3 l) and the interstitial compartment (16% of body weight; 10-12 l). Drug distribution has a major influence on the drug‘s effect, it often described as the volume of distribution (VD) and the distribution coefficient. The volume of distribution is defined as a virtual volume, which would be required to keep the whole amount of the administered drug in the body at the same concentration as it was in the plasma, right after intravascular administration. Here is the formula to calculate the volume of distribution:
VD = amount of drug in the body / plasma concentration
Higher distribution volume means that the drug is likely to accumulate in the extracellular compartment. For example: the VD value of salicylates is 12 l/70kg, while it is 13000 l/70 kg for chloroquin. The latter high figure suggests that chloroquin reaches a very high
chloroquin, however, a high loading dose has to be given, to reach the effective drug concentration in the blood as well. Since the drug is rapidly removed from the blood and accumulated in the tissues, it takes longer to get back into the circulation. An effective plasma concentration is also important for the antimalaric effect of chloroquin.
The distribution or partition coefficient refers to the distribution of the drug between two different compartments (usually lipid and water). If the drug is highly lipophilic (e.g. general anesthetics), it readily diffuses into the body fat. At the same time, its concentration in the body water compartments is relatively low. In that case the volume of distribution may increase dramatically.
Plasma protein binding
Most drugs bind to specific proteins (e.g. albumin, globulins, lipoproteins, glycoproteins, transferrin) in the plasma. There is a dynamic equilibrium between the free and the protein- bound fraction of the drug; although only the free fraction can escape the circulation and reach the site of action. The equilibrium is maintained when the drug molecules dissociate from the plasma proteins, in order to replace the free molecules that have left the circulation, and thus the ration between the free and the protein-bound fraction of the drug remains constant. The plasma proteins also act like a storage for drug molecules, making the drug‘s effect more prolonged. Since the binding affinity of the drugs can be different, they might displace each other from plasma proteins, which often lead to pharmacokinetic interactions.
If the free fraction is relatively small (<5%, e.g. oral anticoagulants like warfarin), even a little change in protein binding can cause severe alteration of the free drug concentration as well as the pharmacodynamic effect.
1.3. Metabolism
The human body has an urge to eliminate any extraneous materials. In order to fast clear them away, the body transforms these molecules and makes them less effective and more water soluble. This process is called drug metabolism. In rare cases, the metabolites of the drug are more potent than the original molecule (e.g. the so-called prodrugs) or more toxic (e.g.
ethanol is metabolized to acetaldehyde and acetic acid). Some drugs do not undergo metabolism.
The metabolic transformations are classified as phase I and phase II reactions. Drugs may undergo both types of metabolism, or are altered only in phase I or II reactions, and then they are excreted from the body (excretion). The phase I reactions alter the drugs chemical structure, resulting a more polar metabolite, which is easier to be excreted. These chemical reactions usually involve oxidation, reduction, hydrolysis, hydration or isomerization. In the phase II reactions the molecules are conjugated to endogenous molecules, like glucuronic acid, certain amino acids, glutathione, or with sulfate, methyl, and acetyl groups. The conjugated molecules are water soluble, and easily excreted by the urine.
The phase I reactions are catalyzed principally by the microsomal cytochrome P450 (CYP) mono-oxygenase enzyme system of the liver. They use molecular oxygen and NADPH as a cofactor. They catalyze several reactions like aromatic oxidation (e.g. phenylbutazone), aliphatic oxidation (phenobarbital on side chain), epoxidation (vitamin K), N-dealkylation (diazepam, ephedrine), O-dealkylation (codeine), S-dealkylation, N-oxidation (imipramine), S-oxidation (chlorpromazine), dehalogenation (halothane), and alcohol oxidation. Certain substrates (e.g. the barbiturates, carbamazepine, rifampicin, hypericin) can increase enzyme activity; these are called enzyme inducers. When the patient takes an enzyme inducer together with other drug(s), it may increase the breakdown of the other drug(s), resulting in a shortened biological effect. It has serious consequences, if the patient is on certain medications, such as oral anticoagulants, oral antidiabetics, or oral antiepileptics. The enzyme inducers can increase their own metabolic rate, which is typical of the barbiturates, leading to drug tolerance. If the patient is taken off the enzyme inducer, the CYP enzymes are no longer induced, which would cause a sudden increase in the effect of the co-administered drugs. In such cases, in order to avoid major adverse reactions, under- or overdose, therapeutic drug monitoring is required.
Some drugs, however, have an opposite effect on the metabolic enzymes, they inhibit their activity and are called enzyme inhibitors. Such drugs are e.g. cimetidine, ketoconazole, and erythromycin. They are also substrates of the microsomal CYP enzymes, which bind them with high affinity, and thus inhibit the other drugs to bind to the metabolizing enzymes and promote an unwanted long-lasting effect.
The microsomal mono-oxygenase enzyme system of the liver is not the only enzyme system which plays a part in drug metabolism. There are other oxidizing enzymes like the alcohol dehydrogenase (has zero order kinetics!, e.g. for ethyl-alcohol, methyl-alcohol), aromatase, aldehyde oxidase, and amine oxidase. Less frequent modalities of metabolism are reduction, including azo reduction (e.g. sulfasalazine), nitroreduction (chloramphenicol metronidazole), keto reduction or epoxide reduction. Certain drugs are hydrolyzed; they are the esters (e.g.
procaine, acetylcholine), amides (lidocaine), azides (isoniazid), or ring opening (coumarins).
The goal of the phase II reactions is to form water soluble conjugates. In these reactions the polar drug metabolite is conjugated with endogenous molecules, with the help of conjugating enzymes. The most common conjugating molecules are glucuronic acid (e.g. with digoxin), glutathione (paracetamol), glycine (salicylic acid), acetyl coenzyme A (clonazepam) or water (carbamazepine epoxide). The conjugated metabolites are usually inactive and easy to be eliminated. The conjugation process itself might carry some risk: in case of relative enzyme deficiency or oversupply of the drug the conjugation would slow down, resulting in the accumulation of potentially toxic metabolites. Such intoxication can happen when paracetamol is overdosed. Paracetamol in normally 95% glucuronidated and sulphated and 5% is coupled to glutathione. When the therapeutic dose is exceeded, the glutathione pathway becomes exhausted and hepatotoxic metabolites (naphthoquinones) are formed. The antidote is glutathione (some paracetamol preparations contain it) or other agents with sulfhydryl groups (e.g. acetylcysteine). If there is a relative deficiency in the glucuronyl transferase enzyme, either genetic (Crigler-Najjar syndrome type II, Gilbert‘s syndrome) or acquired (hepatocellular damage), the chance of the accumulation of the toxic naphthoquinones are much higher. For patients with the above diseases it is recommended to avoid taking paracetamol.
In rare cases, the administered drugs are transformed to (more) powerful agents. They are called prodrugs or soft drugs. Without metabolism to the active agents these molecules are biologically ineffective. The reason to develop and formulate prodrugs involve low stability (e.g. levodopa, NO-donors), uneasy absorption (ACE inhibitors) or targeted effect (acyclovir, dipivefrine). Many drugs are transformed into several metabolites, which are also active yet less potent than the original molecule; they are called active metabolites. The active metabolites can sustain the drug‘s effect.
The primary scene of drug metabolism is the liver, but there is reasonable enzyme activity in the lungs, intestines, kidneys and skin. The orally administered drugs are absorbed from the intestines to the mesenteric veins, which drain via the portal vein into the liver sinusoids.
Many drugs (e.g. morphine, meperidine) are extensively metabolized when first passing through the hepatocytes, and thus a significant proportion of them never reaches the site of action. This so-called first pass effect has to be taken into consideration when choosing the appropriate dose and route of administration of a drug.
Drug metabolism is affected by many factors, including the patient‘s age, sex, state of health, especially kidney and liver function, circulation and genetic background, as well as nutrition, smoking and other drugs taken. Numerous genetic alterations of the genes coding the metabolizing enzymes are known; such enzyme polymorphism would also have a great impact on the drug‘s effect.
1.4. Excretion
Extraneous materials are excreted from the human body via urine, stool, sweat, saliva, or breast milk. The most common way is the excretion via urine, after the original drug was metabolized and became water soluble. There are some drugs, however, which are eliminated in unchanged form: e.g. digoxin, the cephalosporins, aminoglycosides, and gabapentin.
Elimination, which includes metabolism and excretion, has a major impact on bioavailability and determines the rationale for dosing. In the case of impaired liver function it is suggested to avoid drugs with extensive hepatic metabolism; likewise patients with kidney failure should not be given drugs exclusively excreted through the kidney. In the lack of therapeutic alternative the dose has to be tailored to the individual, and blood concentration as well as therapeutic effect should be regularly monitored.
The rate of excretion is determined by both the drug and the human body. Many drugs are weak bases or acids, their dissociation and membrane penetration is primarily affected by the pH in the urine. Molecular size also limits filtration rate. If the drug is bound to plasma proteins, its excretion would be sustained, since only the free, unbound fraction of the drug can cross the biological membranes and be excreted.
The rate of excretion is described by the clearance (Cl). Clearance is a virtual volume of the
of the drug is the half life (t½), which gives the time taken to clear away 50% of the drug from the plasma. The half life is independent from the route of administration; it can be calculated as follows:
t½ = (0,693 VD)/Cl
The plasma concentration of the administered drugs declines with time, mostly following first order, and rarely zero order kinetics. First order kinetics means that the change in concentration (dC) over a time interval (dT), thus the velocity of the reaction (dC/dT), is proportional to the concentration. The velocity decreases with the passage of time, as the concentration of unreacted substance decreases; a plot of C against time would yield a curve of progressively decreasing slope. After the time of 5 t½ has passed, 97% of the administered drug has been eliminated. Most drugs are eliminated according to first order kinetics. It is necessary to know the half life of the drug to decide at what intervals to administer the drug, to maintain adequate blood level.
Zero order kinetics means that the drug elimination is independent of the drug's concentration in the blood. Thus, the concentration of a drug decreases at a constant rate.
Examples of drugs undergoing zero order metabolisms are phenytoin and ethanol. The human body can metabolize 7 g ethanol (100%) per hour, independent from the ingested amount.
Individuals may differ in their ability to tolerate the central effects of ethanol but not in the rate of metabolism. In case of overdose, the elimination of such drugs may be speeded up by dialysis.
Phenytoin is eliminated by the so-called Michaelis-Menten kinetics. When blood concentration is below a certain value, the elimination follows first order, but above the limit it turns into zero order. The limit is usually resulted by the saturation of the metabolizing enzyme‘s capacity. Administration of phenytoin after it has reached its limit concentration would lead to steep increase of blood levels and toxic effects. In order to prevent overdose and adverse reactions, the therapeutic drug monitoring of such drugs is required.
Renal excretion
Drugs are excreted to urine by glomerular filtration and/or tubular secretion. Filtration is determined by molecular size, polarity, and the hydrostatic pressure gradient between the renal artery and the Bowman‘s capsule. Generally speaking, molecules below the weight of 5000 Da, not charged and not bound to proteins can freely pass to the renal tubules. In
contrast, molecules over the weight of 5000 Da, or electrically charged particles are excreted by active tubular secretion. Most of the fluids as well as the lipid soluble, non-ionized particles are passively reabsorbed from the filtrate, while the remaining fluid, urine, is passed through the collecting ducts and removed from the body. Ionization is greatly influenced by the urine pH.
Active tubular secretion means that the drugs are transported via an ATP-dependent mechanism from the plasma into the tubular fluid, by an anionic or cationic transport system.
Organic acids (e.g. salicylic acid, the penicillins, sulfonic acids, and metabolites like glucuronide or sulphate conjugates) are usually excreted by anionic transport. Organic bases (e.g. morphine, meperidine, amiloride, histamine, or serotonin) are eliminated via cationic transport system. These are powerful mechanisms to remove the drugs, both working against concentration gradient, even when the plasma concentrations are virtually zero. Since the active tubular secretion decreases the free concentration of the drug in the plasma, it also promotes the dissociation of the drug from the plasma proteins. The active transport pumps, however, are saturable and similar molecules can compete for the transport, altering each other‘s elimination kinetics (penicillin and probenecid).
Passive reabsorption from the renal tubules into the blood works down the concentration gradient of certain drugs. The rate of reabsorption is highly dependent on the lipophilic character of the drug and local pH. The dissociation of weak acids is set back at low pH, which means that the unionized molecules can freely cross the membranes. Since the pH is about 4 in the proximal and 8 in the distal tubule, weak acids tend to be reabsorbed passively in the proximal, while the weak bases are more readily reabsorbed in the distal tubules.
Passive reabsorption delays drug elimination.
At the same time, the intentional change of urine pH can speed up the elimination of the drugs. Acidification (e.g. by ammonium chloride) would increase the removal of basic substances (e.g. cocaine, amphetamine); alkalinization (by bicarbonate) would promote the excretion of weak acids (e.g. barbiturates, aspirin). This principle is often used to treat drug overdose, usually combined with powerful diuretics such as furosemide, and is called forced diuresis.
Biliary excretion
The liver plays a prominent role in the elimination of drugs, being the organ at increased risk of drug toxicity. It has two lobes, and consists mainly of hepatocytes which form functional units (lobules). The liver produces bile, which is transported to the gallbladder via the intrahepatic and the extrahepatic biliary ducts, and then released into the duodenum. Several drugs and toxins are excreted via the same mechanism.
The orally administered drugs are absorbed from the intestines to the mesenteric veins, which drain via the portal vein into the liver sinusoids. Many drugs (e.g. morphine, propranolol, and lidocaine) are extensively metabolized when first passing through the hepatocytes. Drugs with high plasma protein binding (phenobarbital, warfarin) are slowly eliminated by the liver, since only the free fraction can bind to the metabolizing enzymes. Drugs that were administered parenterally also travel through the liver and are metabolized. Generally, the highly lipophilic and gross molecules are eliminated via the liver, while the small, water soluble drugs are eliminated via the kidney.
Drugs excreted with the bile are released into the duodenum. The glucuronide conjugates often leave the body with stool or are hydrolyzed by the intestinal glucuronidase enzyme, and the free drug is reabsorbed into the blood. This process, which delays the elimination of the drugs and protracts their effect, is called enterohepatic reabsorption. It is characteristic of the benzodiazepines, steroid hormones, or morphine. Since the glucuronidase enzyme is produced by intestinal bacteria, the enterohepatic reabsorption may be impaired aggressive by antibiotic treatment, which destroys these bacteria. The rate of enterohepatic reabsorption has to be taken into consideration when choosing the appropriate dose.
Drugs and other chemical substances may be toxic for the hepatocytes and cause their necrosis (e.g. paracetamol), inflammation (halothane, chlorpromazine), or hepatitis-like symptoms (isoniazid, methyldopa).
Pulmonary excretion
Gaseous (e.g. inhalation anesthetics) and volatile substances (alcohol, or volatile oils) are excreted via the lungs. Pulmonary excretion can be speeded up by increasing the respiratory rate or the heart rate and circulation; these methods are often used to regulate the depth of anesthesia. The bronchial secretory glands can excrete the expectorant salts, which have local stimulatory effect.
Other ways of excretion
Drugs and their metabolites might be excreted by the skin, which refers to the secretion by sebaceous or sweat glands. Alcohol, halogen substances, volatile oils, thiamine or sulfonamides are excreted in part by the skin, and it may cause a strange odor of the patient.
Certain drugs are accumulated in the saliva, which is not a real excretion, since the patient usually swallows his saliva. Drug accumulation in the saliva may serve a therapeutic benefit, e.g. in the case of the antibiotic clindamycin, which is often used to treat the aerobic and anaerobic infections in the oral cavity. An unpleasant taste, however, might render it more difficult to administer some drugs (e.g. metronidazole, ritonavir).
The highly lipophilic drugs and weak bases are easily diffused in the breast milk, where the pH is about 6,5. Carrier mediated transport mechanisms (anion and cation carriers) help the excretion of the anionic and cationic substances. Caffeine, theophylline, alcohol, nicotine, amphetamine and cocaine are excreted in the milk. Since breast feeding has a major physiological and psychological importance; drug abuse, smoking and drinking coffee should be avoided during this period. If medication of the mother is necessary, breast feeding has to be suspended. Some of the drugs are considered safe even during breast feeding; these should be taken right after the end of one feeding session.
2. Quantitative pharmacokinetics
The primary objective of quantitative pharmacokinetics is describing the change in the pharmacon‘s concentration over time in a selected part or parts of the organism (generally where the given pharmacon is anticipated to develop its wanted and untoward effects). In view of the concentration-time curve rational dosage regime protocols may be formulated or optimized according to the therapeutic goal. In order to achieve this, appropriate analytical background is needed (a topic not covered in this chapter), as well as mathematical analysis and fitting the most parsimonious model to the measured and or calculated (or more often estimated) concentration data. The main goal of this chapter is to provide an approach that will be sufficient to understand or maybe even feel the complexity of the interaction between the living systems thriving for a dynamic equilibrium and chemical structures by introducing
the simpler mathematical models. Professional intuition may only be reached by having exact knowledge.
Etymology
By pharmacon (φαρμακον) ancient Greeks meant herbs, pharmaceuticals as well as poisons.
Healing and wizardry have a common origin reflected by the fact that pharmacos (φαρμακος) meant both animal and man intended as placatory sacrifice (scapegoat). Logos (λογος) = speech, precept; bios (βιος) = living; pharmacia (φαρμακια) = use of medication or poison;
dynamis (δσναμις) = power, ability, authority; kinesis (κινηζις) = movement.
2.1. Pharmacokinetic models
Every pharmacokinetic calculation is based on the mathematical model describing the effect the living organism exerts on the pharmacon. This seems to be contradicted by the fact that the in the past most generalized calculations that were based on the fewest presumptions were called ―model independent‖ methods. This contradiction may be resolved if we accept that in those cases ―model independency‖ only meant the lack of presumptions inherent of more specific models. Presumptions for pharmacokinetic models may be predominantly physico- chemical in nature- these are the classic compartment (or chamber) models, or they may rest on the peculiarities of the tissue organization of living organisms e.g. in case of the physiological (or anatomic, or biologic) models.
The general (non-compartmental and non-physiological) models, as reflected by their name, are based on general assumptions; they contain no assumptions concerning the mechanisms of the pharmacon‘s fate. Parallel to the rapid development of analytical methods and computers these models gradually became obsolete. They are not suitable for precise analysis, but they are cheap and allow quick orientation with respect to the most important pharmacokinetic characteristics of pharmacons, so in case of novel pharmacons computations based on general models are used initially. These are well utilized in cases when, due to the complex interaction between the living organism and the pharmacon (e.g. absorption from several sites, elimination at different locations, enterohepatic circulation), the relevant compartment or physiological models are difficult to handle.
Compartments of the compartment models are not necessarily the same as the tissue compartments they set to model. The advantage of compartment models however is that they describe the change in the concentration of the drug using mathematical formulations for the physico-chemical processes. Moreover they are somewhat flexible concerning the interactions
seen between the model living organism and the pharmacon (there are one-, two- or multi- compartment forms, and additionally several different interrelations may be used to describe the connections between the compartments). Computations based on the compartment models are also called compartment analysis.
The main advantage of physiological models is that they reflect the real relations most acurately. Their disadvantage however is that the mathematical descriptions they use are many times empiric (lacking a more solid concept), and they need more hard to obtain data (high demand for computations and analytical methods).
2.2. Classic compartment models
Volume of distribution (Vd) is the volume within the body where the pharmacon is present (that is where its concentration is not zero). A compartment within this volume is where the pharmacon‘s concentration is the same at a specific time point (so the concentration in this volume is homogenous). Theoretically a system contains as many compartments as many concentrations are present within it. To simplify, we propose that within a compartment the pharmacon is distributed immediately, furthermore we overlook the concentration gradient driving the equilibration of pharmacons (in a dynamic equilibrium e.g. a pharmacon is absorbed from some place while it is eliminated from another, thus there has to be a concentration gradient even within the compartment, although this isn‘t too large).
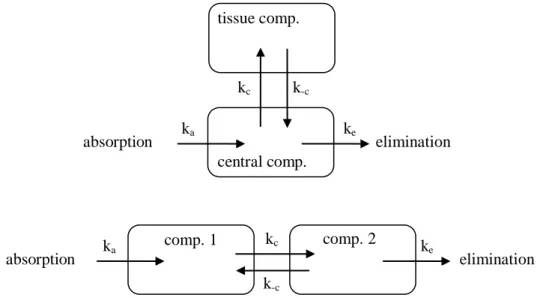
A. One-compartment open model
The pharmacon is homogenously distributed in the available space, and it can only leave via elimination. (The term open refers to the fact that the pharmacon may enter and leave the compartment. We will only focus on open models.) When assessing the living organism and the pharmacon first we usually start by using the one-compartment model and we only extend the model with other compartments if the measured parameters (e.g. the pharmacon‘s concentrations determined in the monitored compartment(s)) show poor correlation with the values predicted by the model. The one-compartment model characterizes well for example ethanol showing quick distribution in the body water and plasma expanders circulating in the vessels after iv infusion (Fig. 1).
Figure 1:Schematic representation of the one-compartment open model ka and ke are the rate constants for absorption and elimination.
B. Two-compartment open model
If there are two compartments, we have to make some decisions concerning the relationship between the two compartments and their relations to absorption and elimination.
There are several possibilities; Fig. 2 shows two cases from these.
Figure 2: Schematic representation of two types of the two-compartment open models (top: mamillary model, bottom: caternary model); ka and ke are the rate constants for absorption and elimination, kc and k-c are the rate constants for entering and exiting a compartment. If absorption and
elimination may be into/from several compartments, more types can be identified.
The most important representative of the two-compartment model is the mamillary model shown in Figure 2. This provides appropriate estimates for most pharmacons. Usually blood (or more exactly blood plasma) is the central compartment as this is where the pharmacon is absorbed to and from where it is eliminated from (mainly via renal and/or hepatic pathways).
The peripheral compartment model(s) tissue compartment(s) that contain the pharmacon in a different concentration than that of the central compartment. The peripheral compartment
ke
absorption elimination
organism ka
comp. 2
comp. 1 ke
elimination ka
absorption
kc
k-c
absorption ka
kc
ke
elimination central comp.
k-c
tissue comp.
modifies the pharmacon‘s time course of concentration in the central compartment (therefore by closely monitoring this latter the presence of the peripheral compartment may be identified).
The expansion of the two-compartment open models with additional compartment increases the possible number of models, but hinders implementation.
2.3. Kinetic order of the changes involving the pharmacons
Basics of reaction kinetics
The kinetics of every process influencing the fate of any given pharmacon (absorption, elimination, and transport between the compartments in a multi-compartment model) may be described using the same mathematical tools. Of the processes influencing the pharmacons, elimination can be assessed most easily using experimental tools.
As we previously discussed elimination is everything that (1) causes a change in the pharmacon‘s primary chemical bonds (metabolism) or (2) clears the pharmacon from the living organism (excretion). The first is a chemical reaction; however in the second the transport process may also be viewed as a chemical reaction. The time course of change in the concentration of the reaction materials known as the rate (and closely relating to this the mechanism) of chemical reactions is described by reaction kinetics.
When using an empiric approach the equation expressing the rate of a chemical reaction contains the concentration of every reacting chemical powered to the exponent according to their stoichiometry (stoichiometric exponents), and the goal is to identify a k constant that if multiplied by the product of the powered concentrations will provide the reaction rate obtained experimentally (v):
The (gross) order of a chemical reaction is determined by the sum of the concentrations‘
exponents determining the reaction velocity (a+b+…+x using the above equation as an example). Order of the reaction may be defined for a single constituent as well, in this case only the exponent of the given chemical‘s concentration is taken into consideration (using the above example this would equal to a for chemical 1). The most important consideration from a practical point of view is for k constant, as this has to be invariable within the experimental
In the living organism pharmacons are metabolized in a chemically rich environment generally with the participation of several different molecules (usually present in a watery solution). Although theoretically only the first step is considered as metabolism (in which the structure of the pharmacon changes), metabolism is usually a chain reaction where the subsequent steps influence the rate of the first step, therefore the complete process should be considered.
Regardless the elimination of pharmacons may be approximated relatively simply due to the validity of the following principles:
1. The rate of a chain reaction (at least in the beginning of the process) is determined by the step with the smallest rate constant (rate limiting step). The kinetic order of the complete process is therefore well approximated by the order of the rate limiting step, so it is sufficient to deal with that.
2. If one of the reacting agents is present in such abundance that its concentration remains practically unaltered during the entire process, than it doesn‘t contribute to the order of the reaction that is determined experimentally, therefore it may be omitted from the equation describing the rate of the reaction. This means for example that the concentration of water often present during metabolism may be left out of the calculations similar to the endogenous molecules that are present in high concentration (e.g. ATP, glucuronic acid).
3. The rate limiting step (similar to the other steps) is generally an enzymatic catalyzed reaction. The catalyst is retrieved unchanged at the end of the reaction therefore the enzyme may also be omitted from the equation describing the rate of the equation.
Summarizing, during the elimination of pharmacons (from the mathematical standpoint including their absorption and any other transport) only the rate limiting step of the chain reaction in which the pharmacon attaches to an enzyme (or a carrier) should be considered (while other molecules possibly also participating in the reaction are present in abundance compared to the pharmacon). Using these considerations we can say that the elimination (or absorption or transport) of pharmacons may be viewed as monomolecular process therefore the rate of the process is given by the product of the rate constant and the pharmacon‘s concentration raised to the first power. In other words the elimination (and mostly all other processes) of pharmacons generally shows first order kinetics.
Elimination in the one-compartment open model
Due to the fact that elimination is the most readily investigated process of all processes involving the pharmacon, the principles of kinetics will be illustrated using that as an example. For the sake of simplicity -if not indicated otherwise- elimination will be discussed using a one-compartment open model.
Although the rate of elimination can be generally well estimated by the product of the elimination constant and the first power of the pharmacon concentration, the rate of elimination may be determined more precisely. Elimination (as an enzyme-catalyzed reaction) may be described using Michaelis-Menten kinetics, that is based on the law of mass action (more precisely, on the law of mass action described for equilibrium). Forerunner of the Michaelis-Menten equation is the Hill equation that is well-known in pharmacodynamics. The model of Michaelis and Menten also contains some presumptions, owing to this fact it is mathematically relatively simple. According to it, the rate of elimination (v):
where: vmax is the maximal rate of elimination, c is the concentration of the enzyme‘s substrate in the rate limiting step of the pharmacon‘s elimination (in the simplest case this is the concentration of the pharmacon itself, but this is not necessarily true), KM is the substrate concentration at which the rate limiting enzyme works at half-maximal rate (Michaelis- Menten constant). Using the above equation if rate is plotted as a function of concentration (using linear axes), a hyperbolic or saturation curve is obtained (Fig. 3).
KM 4 KM Substrate concentration
Rate of enzymatic elimination
vmax/2 vmax
Figure 3: Rate of enzymatic elimination as a function of substrate concentration
Although KM is the half-saturating concentration of the substrate for the rate-limiting enzyme, it describes the pharmacon‘s concentration well in our case since the other processes barely contribute to the overall kinetics of complete elimination process.
The pharmacon‘s rate of elimination in the 0 - KM concentration interval may be simplified as follows since KM > c in this case:
here: ke=vmax/KM is the rate constant for elimination. It should also be noticed that in the equation expressing the rate (v=ke·c) the first power of concentration occurs, so the elimination of pharmacons in the 0 - KM concentration interval follows first order kinetics with good approximation. In this case the quantity of substrate is small when compared to the quantity (or more precisely the activity) of the enzyme, therefore substrate molecules (forming from the additionally added pharmacon dose) will readily find free enzymes so the rate of elimination will increase. According to this, Fig. 3 reflects that the rate-concentration function is approximately linear at concentrations below KM; therefore the rate of elimination is roughly proportional to the concentration of the substrate (or the pharmacon in question).
The rate of elimination may be given in a simpler for concentrations higher than 4 KM as well, using the assumption that KM < c:
So for concentration above 4 KM the elimination rate constant equals to vmax, and the rate of elimination is always at maximum. It should be noted that lack of dependence on the concentration means the zero power of the concentration (v=vmax=ke·c0), so elimination of pharmacons at concentrations exceeding 4 KM shows zero order kinetics with good approximation. In this case substrate quantity greatly exceeds the quantity of the enzyme (or its activity), most of the enzyme molecules are occupied therefore it is difficult for the newly introduced (or produced) substrate molecules to find a free enzyme. This is reflected in Figure 3, where the rate-concentration function is approximately linear and runs almost horizontally showing that elimination became independent of the substrate concentration (or pharmacon in question).
It is not worth the effort to mathematically simplify the equation describing the rate of elimination in the concentration interval KM - 4 KM as this would yield a fractional order kinetic reaction (0-1 in this interval). In practice however this concentration interval is handled as either a first- or a zero order kinetic reaction depending on whether the therapeutically or toxicologically significant concentration is in the higher or lower range.
Although the elimination of pharmacons follow at least two kinds of (zero and first order) kinetics, in practice we see that elimination of most pharmacons is kinetically uniform;
generally show first order kinetics, with only a limited scope of pharmacons that follow zero order kinetics (for example ethanol). The reason for this is that the concentration of most pharmacons has no significance in such a wide dosage range that would be lead to a change from first order kinetics to zero order kinetics. If a substance is efficacious in a concentration well below the KM value of the rate limiting enzyme (or transporter), the levels at 4 KM could be toxic or couldn‘t develop (as these are incompatible with life). However if the concentration in interest is above the value of 4 KM, concentrations below KM are generally ineffective, so these are not investigated.
Only a few special pharmacons are used over such wide concentration ranges where the change in kinetics may be seen in practice. For example acetylsalicylic acid is eliminated with first order kinetics when given in the indication of platelet aggregation inhibition (75-325 mg per day), however when given to ameliorate the symptoms of rheumatoid arthritis it may be given in a high dose (2-4 g), and is eliminated with zero order kinetics. For the sake of simplicity we disregard the fractional exponent kinetics in this case as well (although, for example, the dose range for the antipyretic and pain killer indication of acetylsalicylic acid – 0.5-2 g – would be best described using fractional exponents).
2.4. Classic compartment analysis
First order elimination in a one-compartment open model with immediate absorption If the absorption of a pharmacon‘s single dose given at t0 time point is immediate into the compartment then the maximal c0 concentration will evolve at t0. Therefore in the case of first order elimination, the pharmacon‘s ct concentration is described at any given t time point by the following equation:
where: e is the base of the natural logarithm. Since in the case of first order kinetics (and only
the law of radioactive decay, so it may be expressed in the usual form of the latter (although the law of radioactive decay uses masses and not concentration, however these are equivalent if the volume is the same):
Taking the logarithm of the above exponential equation, the time-dependency will become linear:
In the case of first order kinetics, ke denotes the fraction of the pharmacon eliminated per time unit (so its dimension is 1/ time unit). If the volume of the compartment remains unaltered (so Vd remains constant), ke provides the pharmacon‘s mass eliminated per time unit as well as the proportion of the volume of distribution that is cleared during the time unit.
According to this:
―Clearing‖ the distribution volume means that we look at that volume that would be cleared completely free of the pharmacon dissolved in it during the given unit of time, with the concentration of the pharmacon remaining unaltered in the remaining volume. This is the clearance that provides the proportion of the distribution volume ―cleared‖ over time, so its dimension is volume/time unit. Since both ke and Vd are constant, clearance is also constant in case of first order elimination. The product of clearance and ct provides the mass eliminated during the time unit used (this is not constant as ct is not constant). The advantage of clearance is that the in the case of several processes (or places) for elimination the overall clearance may be calculated by summing up the clearance of the individual processes.
The following statements are true for first order elimination:
1. The proportion of eliminated concentration (and mass) is constant over time.
2. t1/2.is constant
3. Clearance is constant.
4. ke is not dependent on c0.
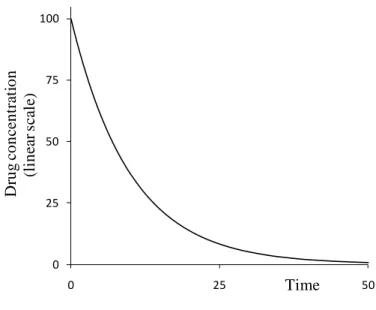
The above relationships may be used to calculate the concentration of a pharmacon with known parameters at any given time point, but it can also be used to determine the unknown kinetics of the pharmacons using experimental data. The following function illustrates the concentration-time curve of a pharmacon given in a single dose at a t0 time point, if the absorption is immediate:
0 25 50 75 100
0 25 50
Drug concentration (linear scale)
Time
Figure 4: The concentration-time curve for a pharmacon given at t=0 time point showing first order elimination kinetics with momentary absorption.
The x and y axis are linear, the scale is arbitrary.
By taking the logarithm of the pharmacon‘s concentration, calculation will become simpler (this had greater relevance before the emergence of computers). Plotting the logarithm of the concentration (or using a logarithmic scale on the y axis) the concentration-time curve is more easily constructed:
0.1 1 10 100
0 25 50
Drug concentration (log scale)
Time
Figure 5: The function shown in Fig. 4 when plotted semi-logarithmically. A (t1; c1) and a (t2; c2) points of the function were highlighted (for details see the text).
Theoretically the concentration-time curve illustrated in Fig. 5 may be plotted using only two experimental concentration-time data pairs. This data is sufficient to compute the ke elimination constant, and with use of this, any given point of the pharmacon‘s concentration- time curve may be determined algebraically, since using a semi logarithmic illustration (Fig.
5) the ke value equals to the slope of the linear concentration-time function, or more exactly it is -1 times the slope (see above the logarithmic form for the elimination of a pharmacon given in ct concentration in case of first order kinetics):
In practice immediate absorption is mostly approximated by quick intravascular (iv. but intra- arterial even more so) drug administration given in a bolus.
Zero order elimination in a one-compartment open model with momentary absorption
The ct concentration of a pharmacon following zero order kinetics with immediate absorption at any given time point is described by the following equation:
This equation determines a linear function (when plotted using linear axes) the slope of which equals to -1 times ke.
In the case of zero order elimination, ke determines the pharmacon concentration eliminated over time unit (so its dimension is concentration/time unit), therefore ke equals to the rate of reaction (that is both constant and maximal). According to this, the product of ke and Vd gives the mass of eliminated pharmacon over a time unit that is constant (if Vd is constant):
Due to the concentration independent loss of pharmacon, the proportion of the pharmacon‘s mass and concentration increases over time during the process.
The following statements characterize zero order elimination:
1. The concentration (and mass) eliminated over a time unit is constant.
2. t1/2 continuously decreases (therefore elimination is not characterized by this parameter).
3. Clearance continuously increases (therefore elimination is not characterized by this parameter either).
4. ke is not dependent of c0 (here either).
The concentrations of the single dose of the immediately absorbed pharmacon at a t0 time point may be illustrated using the following function in case of zero order kinetics:
0 25 50 75 100
0 500 1000
Drug concentration
Time
Figure 6: The concentration-time curve for a pharmacon givenat t=0 time point showing first zero elimination kinetics with momentary absorption.
The x and y axis are linear, the scale is arbitrary. c0 and ke values are the same as for the function shown in Fig. 4.
2.5. Calculations based on the general model
Apparent volume of distribution
Aside from a few pharmacons with special properties (e.g. plasma expanders that stay in the intravascular space), the volume of distribution of pharmacons may only be determined precisely using expensive methods (e.g. PET). For practical use the determination of the so called apparent volume of distribution is sufficient, that may be calculated as follows:
where: nadministered is the mass of pharmacon administered to the living organism, cmonitored is the concentration of the pharmacon in a given compartment after distribution (unfortunately apparent volume of distribution is denoted by Vd just the same as the volume of distribution is). If the investigated compartment is not specified otherwise then this compartment, in which the concentration of the pharmacon is monitored, is the blood plasma. It happens that instead of using nadministered, madministered (administered weight) is used, so in these cases this
former parameter should be divided by ―plasma density‖ (a weight/volume quantity) instead of the concentration.
If the pharmacon shows a homogenous concentration distribution in the distribution volume (the simplest scenario for this is when the pharmacon is only present in the monitored compartment) then the apparent volume of distribution will be equal to the real volume of distribution. If the concentration distribution of the pharmacon is heterogeneous, the apparent volume of distribution may be smaller or larger than the real volume of distribution. If plasma is the monitored compartment then the compounds showing high lipid solubility will have an extremely high apparent volume of distribution, while pharmacons with strong plasma protein binding generally have a small apparent volume of distribution.
Area under the curve for concentration-time curves (AUC)
AUC is the area of the formation bordered by the concentration-time (usually plasma concentration-time) curve, and the x axis (given the x axis intersects the y axis at 0); shortly it is the area under the curve. AUC is the same as the integral of the concentration-time curve.
Similar to the integral that may be definite or indefinite, the AUC may relate to a specified part of the concentration-time curve between any two c1 and c2 values (and the associated t1
and t2 values on the x axis) or the complete function (with the complete positive interval of the x axis ranging from t0 to t∞). The advantage of AUC is that it characterizes the ―weight‖ of the presence of the pharmacon in the body (or in the monitored compartment) using a single value; as AUC is higher if the pharmacon is present in a higher concentration and/or for longer time in the monitored compartment.
In the t0 - tn interval on the x axis (AUC0-n) AUC may be approximated using the so called trapeze rule. This means that the function relating to the t0 - tn interval is divided into several sections in a way that the function within this section would be approximately linear. These quasi linear sections together with the associated sections of the x axis form a trapeze, the area of which may be computed as usual:
where: AUC(x-1)-x is the area of the trapeze located on the x axis between points tx-1 and tx, cx-1
and cx are the concentrations relating to tx-1 and tx respectively. By adding the areas of the
trapezes we obtain AUC0-n. The remaining area (AUCn-∞) may be approximated using the following equation:
where: cn is the last known concentration, and k is the approximate negative slope (slope times -1) in the section past cn. The sum of AUC0-n and AUCn-∞ provides the whole AUC (AUC0-∞).
In the case of first order elimination the relationship between the whole body clearance (WBC) and the whole AUC is as follows:
Determination of AUC is compulsory in the assessment of novel pharmacons (and comparison to older ones).
References
House J.E.: Principles of chemical kinetics. Academic Press; 2007.
Katzung B., Masters S., Trevor A. Basic and Clinical Pharmacology. McGraw-Hill; 2009.
Kenakin T.P.: A pharmacology primer: theory, applications, and methods. Academic Press;
2009.
Shargel L., Wu-Pong S., Yu A.B.C.: Applied Biopharmaceutics & Pharmacokinetics.
McGraw-Hill; 2005.
PRINCIPLES OF PHARMACEUTICAL BIOTECHNOLOGY
1. DNA, RNA, protein
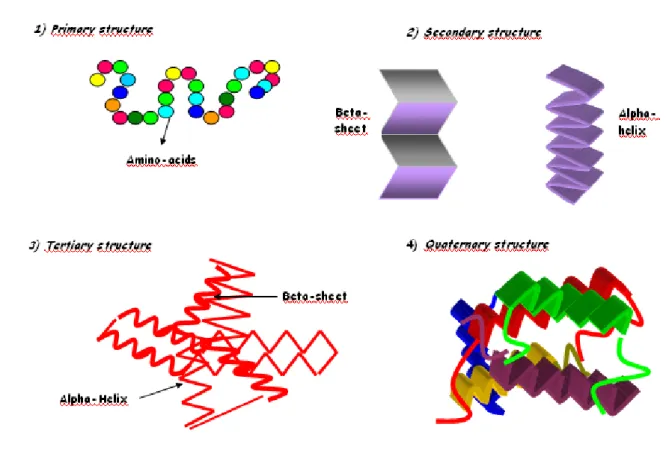
Proteins are the major macromolecular elements in the biological functions of the cell. The structure and function of proteins are determined by their amino acid sequence. The sequence of amino acids in a certain protein is defined by genes encoded in DNA. This encryption is deciphered with the help of different types of RNAs and translated into the appropriate amino acids. Understanding the function of DNA and RNA resulted in specific methods by which their structures – and hereby cellular functions – can be modified.
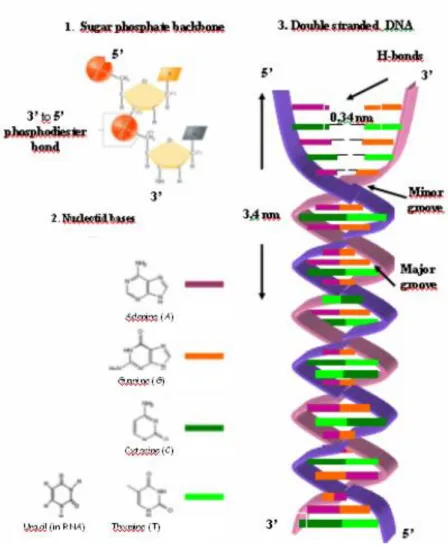
1.1. Chemical structure of DNA
Polynucleotides built from nucleoside monophosphates are linear polymers such as deoxyribonucleic acid (DNA) and ribonucleic acid (RNA) (Fig. 7). The monomers in DNA molecules are purine (Adenine: A and Guanine: G) and pyrimidine (Cytosine: C and Thymine: T) bases. Independently of the origin of DNA, these four types of bases are always present, only their rate is different (e.g. in mammals A/T is 45-55%).
Nucleotides are joined together in DNA and RNA by phosphate ester bonds between the phosphate component of 3‘ carbon group in one nucleotide and the 5‘ OH group on the sugar component of the next nucleotide. These covalent phosphodiester bonds make the primary structure of DNA. One end of the nucleic acid molecule always has a free -OH group (called the 3' end) and the other end of the molecule always has a phosphoric acid group (the 5' end).
By convention, the primary structure of a DNA (or RNA) molecule is reported from the 5' end to the 3' end.
The double-helix structure of DNA, which is one of the most significant models in modern biology, was published by F.H.C. Crick and J.D. Watson in 1953 [Watson 1953]. The double helix in DNA consists of two right-handed polynucleotide chains that are coiled about the same axis. The heterocyclic amine bases project inward toward the center so that the base of one strand interacts or pairs with a base of the other strand by hydrogen bonds: thymine - adenine pair interacts through two hydrogen bonds (T=A) and the cytosine-guanine pair interacts through three hydrogen bonds (C=G). This secondary structure of DNA is illustrated in Fig. 7. As a consequence of the helical structure, the negative charges are situated on the exterior surface of the DNA. These negative charges in the nucleus are compensated for by
proteins rich in basic amino acids (e.g. histones). The purine and pyrimidine bases of both strands are stacked inside the double helix, with their hydrophobic and nearly planar ring structures very close together and perpendicular to the long axis. In the model of Watson and Crick, the conformation of double helix is the so called B-DNA, the most common double helical structure where the double helix is right-handed with about 10–10.5 nucleotides per turn. B-DNA has two distinct grooves: a major groove and a minor groove. These grooves form as a consequence of the fact that the beta-glycosidic bonds of the two bases in each base pair are attached on the same edge [Watson 1953]. The edges of the bases are more accessible in the major groove. As a result, proteins like transcription factors that can bind to specific sequences in double-stranded DNA usually make contacts to the sides of the bases exposed in the major groove [Pabo 1984].