Report
Study on Methodologies for Gas Transmission Network Tariffs and Gas Balancing Fees in Europe
Tender No.: TREN/C2/240-241-2008
Submitted to:
The European Commission, Directorate-General Energy and Transport
Arnhem, December 2009
© KEMA International B.V., Arnhem, the Netherlands. All rights reserved.
It is prohibited to change any and all versions of this document in any manner whatsoever, including but not limited to dividing it into parts. In case of a conflict between the electronic version (e.g. PDF file) and the original paper version provided by KEMA, the latter will prevail.
KEMA International B.V. and/or its associated companies disclaim liability for any direct, indirect, consequential or incidental damages that may result from the use of the information or data, or from the inability to use the information or data contained in this document.
Table of Contents
Executive Summary ... I
1. Introduction ... 1
1.1 Background and Objectives... 1
1.2 Scope and Structure of this Study ... 3
2. Country Comparison ... 5
2.1 Overview... 5
2.2 Transmission Tariff Structure ... 6
2.3 Regulation of Transmission Tariffs ... 17
2.4 Residual Balancing by the TSOs... 34
2.5 Settlement of Imbalances ... 41
3. Relevant Differences and Resulting Barriers ... 47
3.1 Tariffs and Regulation ... 47
3.2 Residual Balancing and Imbalance Settlement ... 67
3.3 Results of Stakeholder Survey ... 89
4. Possible Areas for Harmonisation... 96
4.1 Tariffs and Products ... 96
4.2 Network Planning and Investments ... 122
4.3 Residual Balancing and Imbalance Settlement ... 129
5. Interaction and Phasing of Recommended Changes ... 135
5.1 Network Access and Pricing... 136
5.2 Inter-TSO Compensation Mechanism (ITC) ... 140
5.3 Regulation and Investments ... 143
5.4 Residual Balancing... 145
5.5 Imbalance Settlement... 150
5.6 Suggested Actions... 152
6. Appendices ... 157
6.1 References ... 157
6.2 Background Information on User Survey... 160
List of Figures
Figure 1: Comparison of basic transmission tariff models in EU Member States ... 8Figure 2: Split between capacity and commodity charges for domestic transmission ... 10
Figure 3: Price of interruptible capacity compared to firm capacity (%) ... 11
Figure 4: Price of non-physical backhaul capacity compared to firm capacity (%) ... 13
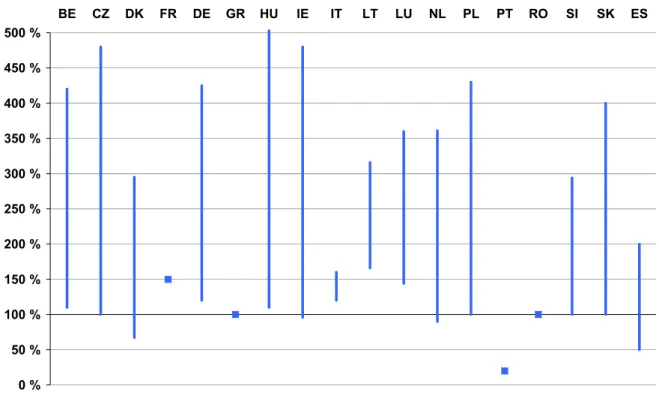
Figure 5: Relative price of monthly capacity (in comparison to annual capacity)... 14
Figure 6: Procurement mechanism and time horizon for balancing services ... 39
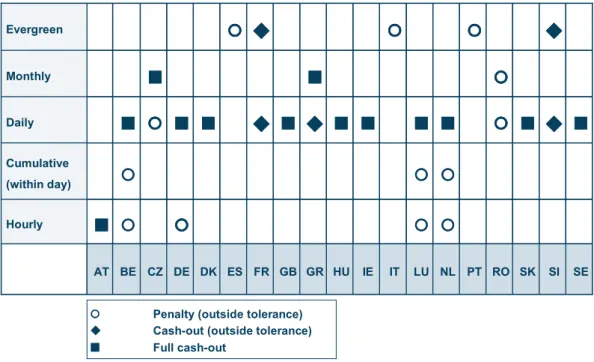
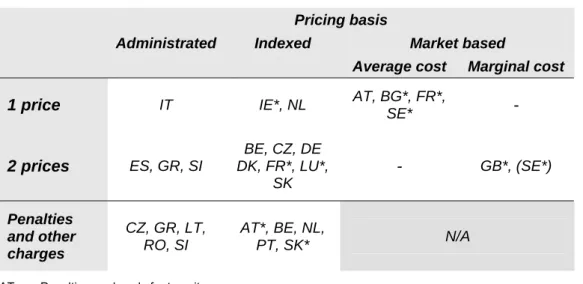
Figure 7: Use of cash-out charges and penalties across different balancing intervals ... 43
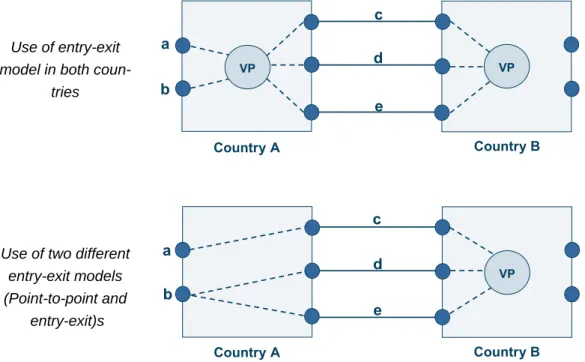
Figure 8: Impact of a point-to-point model on the entry-exit system in a neighbouring country ... 48
Figure 9: Determining the net costs of imbalance settlement ... 80
Figure 10: Range of average imbalance costs for individual flat customers... 81
Figure 11: Range of average imbalance costs for individual swing customers ... 81
Figure 12: Range of average imbalance costs for individual CCGT plants ... 82
Figure 13: Composition of total imbalance charges (flat customer)... 83
Figure 14: Composition of total imbalance charges (swing customer) ... 84
Figure 15: Composition of total imbalance charges (CCGT plants)... 85
Figure 16: Comparison of national and international portfolio of single-site customers ... 87
Figure 17: Illustration of virtual hub-to-hub capacities ... 108
Figure 18: Auction-based allocation of cross-border capacities to individual borders in Central Eastern Europe (electricity) ... 109
Figure 19: Example network used for illustration of ITC mechanism... 115
Figure 20: Possible impact of ITC on market, consumer and producer / import prices ... 117
Figure 21: Interaction and impact of different measures... 136
Figure 22: Interaction and impact of measures related to network access and pricing ... 137
Figure 23: Interaction and impact of measures related to regulation and investments... 141
Figure 24: Interaction and impact of measures related to regulation and investments... 144
Figure 25: Interaction and impact of measures for procurement of balancing services... 146
Figure 26: Interaction and impact of measures for imbalance settlement ... 151
List of Tables
Table 1: Barriers resulting from differences in network access and tariff structures... VI Table 2: Barriers resulting from differences in regulation ... VIII Table 3: Barriers resulting from differences in balancing models ... IX Table 4: Aspects to be considered under Task 1... 3Table 5: Comparison of basic transmission price control mechanism ... 20
Table 6: Treatment of CAPEX and length of regulatory period under cap regulation... 23
Table 7: Special provisions for new investment (examples) ... 24
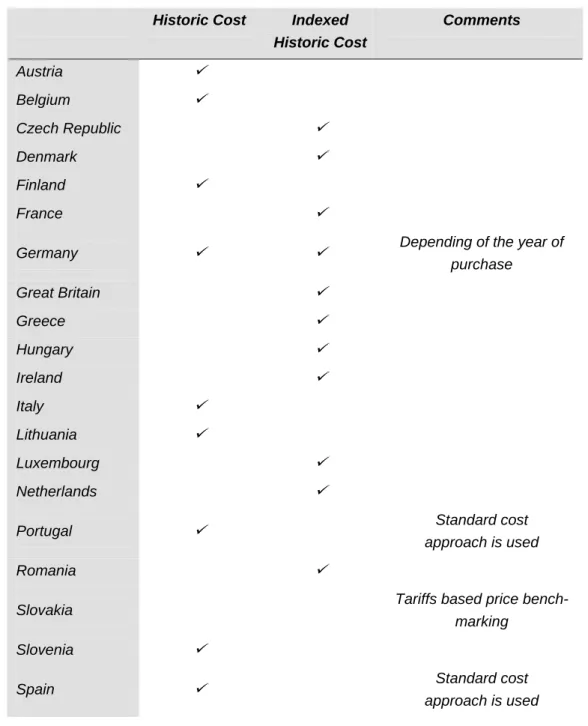
Table 8: Asset valuation concepts applied... 26
Table 9: Main parameters for use of WACC in European gas transport networks ... 29
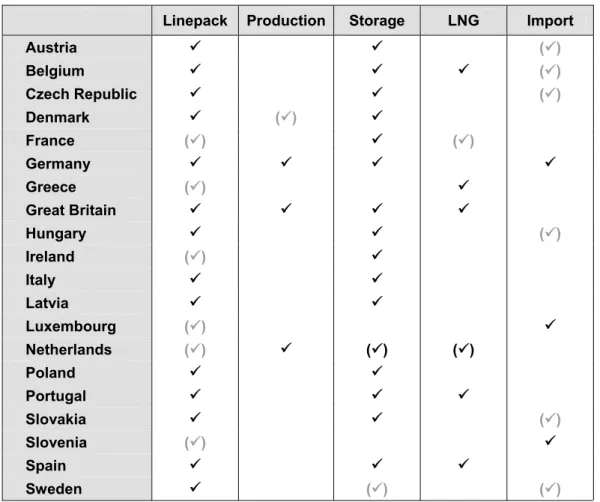
Table 10: Indicative role of different sources of flexibility for system balancing... 36
Table 11: Procurement of balancing services in EU gas markets (excluding linepack) ... 37
Table 12: Determination of cash-out prices and penalty charges... 46 Table 13: Main parameters of imbalance settlement of the countries considered for
the quantitative analysis ... 78 Table 14: Example of entry-exit charges resulting under an ITC mechanism... 116 Table 15: Summary of proposed actions ... 154
Executive Summary
Article 13 (2) of Regulation (EC) 715/2009 requires that tariffs for access to and use of gas transmission networks do not restrict market liquidity or distort trade across borders of differ- ent transmission systems. Where differences in tariff structures or balancing mechanisms would hamper trade across transmission systems, Art. 3 (2) of Regulation (EC) 715/2009 re- quires transmission system operators to actively pursue convergence of tariff structures and charging principles, including in relation to balancing.
In addition, Directive 2009/73/EC also calls for a promotion of investments in major new in- frastructure while ensuring the proper functioning of the internal market in natural gas, which is also reflected in the stipulations of Art. 13 (1) of Regulation (EC) 715/2009 stating that tar- iffs shall provide incentives for investment. Finally, Art. 7 and 42 of Directive 2009/73/EC as well as Art. 12 of Regulation (EC) 715/2009 require TSOs and regulatory authorities to co- operate with each other for the purpose of integrating their national markets at regional level, with the ultimate aim of creating a fully liberalised internal market.
Notwithstanding these requirements, which largely correspond to those of the European leg- islation currently in force,1 the existing transmission tariff and balancing models throughout Europe are characterised by considerable variety. Experience shows that these differences may create significant barriers and distortions for cross-border trade. Similarly, differences in the regulatory treatment of investments may provide insufficient incentives to invest into new infrastructure.
Based on this background, the Commission has initiated the current study, with the aim of evaluating if and how the existing differences effectively lead to barriers in trade across transmission systems and/or hamper investments in new transport capacities. In addition, this study analyses the scope for resolving these barriers through an increased level of har- monisation and develops recommendations on the minimum level of harmonisation that would be required or at least desirable from a European perspective.
1 Directive 2003/55 and Regulation (EC) No 1775/2005
This summary presents the main findings of this study, covering the following issues:
• First, the main differences in the existing transmission tariff and balancing models of the Member States;
• Secondly, relevant barriers for cross-border trade and investments which result from these differences; and
• Finally, a summary of our recommendations for harmonisation and improvement of the current market and regulatory frameworks.
Existing Differences in Transmission Tariff and Balancing Models
This study is based on a comprehensive analysis of the structure and regulation of transmis- sion tariffs and the arrangements for residual balancing and imbalance settlement in the EU Member States. Whilst the detailed analysis and findings are discussed in the main part of this report, the following text summarises a selection of the main observations.
With regards to the determination and regulation of transmission tariffs and investments into new infrastructure, it seems worthwhile to mention the following aspects:
• Although all countries have already introduced entry-exit mechanisms, the flexibility of the entry-exit system is reduced through the existence of several market areas or balancing zones in several countries. Moreover, some countries still apply a separate point-to-point regime for transit.
• Prices for interruptible capacities are subject to major variations, with discounts rang- ing from more than 50% to less than 10%, in many cases without any obvious rela- tion to the risk of interruption.
• Only few TSOs offer non-physical backhaul capacities. Similar to interruptible capaci- ties, prices vary widely (15% - 100% of the price of firm forward capacity).
• Short-term capacities are generally offered at a significant premium to annual capaci- ties, in many cases by a factor of 2 to 4. Seasonal variations are widely applied.
• The regulatory regimes of the individual countries cover a wide range of different ap- proaches. Whilst some countries apply traditional rate-of-return regulation, most
regulators use some form of incentive regulation, such as revenue caps or, in some cases, price caps. Similarly, different approaches are used for the valuation of the regulatory asset base and the determination of the allowed rate of return.
• Only a few countries grant TSOs the right to set the transmission tariffs themselves without any ex ante approval by the regulator or a similar governmental agency.
• Some countries apply various forms of specific incentives. Conversely, whilst several regulatory regimes explicitly provide for the use of benchmarking for comparative ef- ficiency analysis of TSOs, this instrument is not currently applied in practice.
The following differences have been observed with regards to the balancing models applied in the different countries:
• Although nearly 50% of all countries already apply some form of market-based mechanisms for residual balancing, market-based mechanisms continue to play a minor role for the short-term procurement of balancing gas in most cases. As a re- sult, non market-based methods continue to represent the main or often even the ex- clusive form of procurement in most countries.
• Even where market-based methods are used, the focus mostly is on products with a medium-term time horizon (1 month to 1 year in advance), with only three countries relying exclusively on the use of a day-ahead or intra-day market for the procurement of balancing gas.
• When interpreting these findings, care should be taken to consider the fundamental differences in the availability and ownership of different sources of flexibility, which may often constrain the choice of possible methods in individual countries.
• Although most countries formally apply a daily balancing period, the effective balanc- ing period is often much shorter due to the use of penalty charges with a shorter timeframe (applied for instance on hourly or cumulative deviations during the day).
• The determination of imbalance and penalty charges varies widely, with only a few countries applying market-based charges that reflect the actual costs of balancing. In this context, it is furthermore important to note the often large difference between im- balance or penalty charges and market prices.
Relevant Barriers for Cross-Border Trade and Investments
Many of the differences in the transmission tariff and balancing models of the EU Member States described above may lead to barriers in trade across transmission systems and/or impede investments in new transport capacities. Based on the nature of the underlying dif- ferences, these barriers may be categorised into those resulting from differences in:
• Network access and tariff structures;
• Regulation of tariffs and investment planning; and
• Balancing models (residual balancing and imbalance settlement).
The following sections briefly summarise the relevant barriers in each of these areas, de- scribe their impact and provide an assessment of how critical they are with regards to the promotion of cross-border trade and efficient investments into new infrastructure.
To facilitate comparison of the individual aspects, this assessment makes use of a standard- ised evaluation of each potential barrier as follows:
Highly critical Likely to cause major distortions to cross-border trade and/or serious barriers for new investment;
Issue should receive immediate / focused attention
Critical Likely to cause significant distortions or barriers, but of lower urgency;
Immediate attention desirable but may have to await progress on other issues with higher priority
Potentially serious May potentially cause serious distortions or barri- ers, although the current impact may be limited due to the existence of other, more critical issues Issue should be addressed at least in the medium- term, although some of its disadvantages may not be relevant at the moment
Limited impact Believed to be of limited impact for cross-border trade (although it may be critical from a national perspective)
Improvements in other areas should receive priority
Requiring further study
Impossible to analyse within scope of current study Requires further study to obtain reliable insights
Barriers resulting from differences in network access and tariff structures
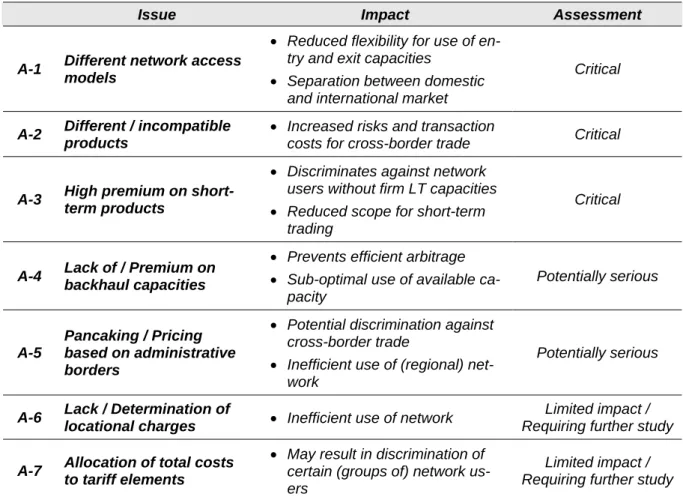
Table 1 below lists a total of 7 potential barriers for cross-border trade that can be traced back to differences in the general network access regime and/or the tariff structures applied by the national TSOs, ranked in order of decreasing importance. The following three items are regarded as most critical:
• The use of different network access regimes can create barriers to cross-border and/or domestic trade. The effective application of a point-to-point model in parallel with an unconstrained entry-exit system limits the flexibility of network users by not providing them with the full benefits of a de-coupled entry-exit system. Where sepa- rate systems are applied for national and cross-border (transit) flows, two distinct markets for domestic and cross-border trade are created, impeding the entry of ex- ternal parties into the domestic market.
• The use of different and often incompatible products on both sides of the same border results in increased risk and transactions costs for network users and gener- ally makes it more difficult for new entrants to join the market for cross-border trade.
In addition, it is likely to result in a sub-optimal use of infrastructure.
• Thirdly, high premiums applied to short-term capacities do not seem to reasona- bly reflect the costs and market value of the corresponding product. Given the gen- eral deficit of firm long-term capacities, high prices for short-term capacities poten- tially discriminate against new entrants and other network users without sufficient long-term capacity rights. Finally, they do not support an optimal use of existing infra- structure by reducing the commercial scope for short-term cross-border trading.
Table 1: Barriers resulting from differences in network access and tariff structures
Issue Impact Assessment
A-1 Different network access models
• Reduced flexibility for use of en- try and exit capacities
• Separation between domestic and international market
Critical
A-2 Different / incompatible products
• Increased risks and transaction
costs for cross-border trade Critical
A-3 High premium on short- term products
• Discriminates against network users without firm LT capacities
• Reduced scope for short-term trading
Critical
A-4 Lack of / Premium on backhaul capacities
• Prevents efficient arbitrage
• Sub-optimal use of available ca- pacity
Potentially serious
A-5
Pancaking / Pricing based on administrative borders
• Potential discrimination against cross-border trade
• Inefficient use of (regional) net- work
Potentially serious
A-6 Lack / Determination of
locational charges • Inefficient use of network Limited impact / Requiring further study A-7 Allocation of total costs
to tariff elements
• May result in discrimination of certain (groups of) network us- ers
Limited impact / Requiring further study
In addition to these major barriers, the following two aspects also deserve attention:
• The lack of backhaul capacities as well as prices that are likely to be significantly higher than actual costs, prevents efficient arbitrage between neighbouring markets and may contribute to a sub-optimal use of the network.
• The current practice of applying separate entry and exit charges at administrative borders, with an often unclear relation between the prices charged and the underly- ing costs, may discriminate against cross-border trade by exposing it to an over- proportional share of total costs. In combination with the additional effect of ‘pancak- ing’, this may result in an inefficient use of cross-border infrastructure.
In contrast, the lack of locational charges in many countries and potential problems related to the allocation of total costs to different tariff elements do not appear to be of high relevance for cross-border trade. Although they may potentially cause serious distortions, such problems would also apply to the corresponding local market and should hence be treated by the national regulatory authorities. Moreover, the quality of locational charges seems to be of minor importance under the general absence of a market-based pricing of congested capacities (see below).
Barriers resulting from differences in tariff regulation and investment planning In the area of tariff regulation and investment planning, the lack of coordination in network planning and differences in the regulatory treatment of new investments appear as barriers that are highly critical for the realisation of new investments.
This assessment can be explained as follows (see also Table 2):
• A lack of coordination of networkplanning in terms of location and time, including the use of open season procedures, creates increased uncertainty and risks for net- work users, who may therefore find it difficult to participate or be forced to over- contract. In combination with an imperfect exchange of information, this may also lead to sub-optimal decisions by the TSOs, potentially resulting in over- or underin- vestment.
• Differences and a lack of coordination in the regulatory treatment of new cross- border infrastructure create significant regulatory uncertainty and risk for nrtwork operators and users alike. In particular, this may endanger the realisation of individ- ual projects as the commercial viability of new investments may differ at a national level. Furthermore, the complexity of synchronising the different decisions bears a high risk of undesirable delays.
Conversely, any differences in the national regulatory systems, including the fundamen- tal regulatory principles and models, regulatory accounting and the determination of the al- lowed rated of return, can be considered as not critical, as long as the overall regulatory sys- tem in each country ensures sufficient revenues and avoids undue regulatory uncertainty. A more detailed investigation of the corresponding differences would have required a detailed country-by-country analysis such that it has not been possible to derive any final insights in this respect in this study. Similarly, this study has not assessed the actual performance of
different open season procedures since the implementation of such processes is not directly related to the design and implementation of tariff and balancing models.
Table 2: Barriers resulting from differences in regulation
Issue Impact Assessment
Lack of coordination in network planning
• Increased uncertainty and risk for users
• May result in sub-optimal investment deci- sions
Highly critical Regulatory treatment
of new cross-border infrastructure
• Increased risks and delays of new projects
• Commercial viability of new investments may differ on a national level
Highly critical Differences in
- Regul. principles - Regul. accounting - Allowed rate of return
• Not critical, provided that overall regulatory system ensures sufficient revenues and avoids undue regulatory uncertainty
• Not possible to evaluate without comprehen- sive assessment of each local system
Limited impact / Requiring further study
Barriers resulting from differences in balancing models
The relevant barriers related to the residual balancing actions to be taken by the TSOs and to imbalance settlement are summarised in Table 3. In total, five different but partially related issues have been identified as potential major obstacles for cross-border trade, including four aspects with at least a ‘critical’ assessment.
In detail, we note the following issues:
• With few exceptions, imbalance charges are not market-based and/or do not re- flect the actual costs of balancing on a daily basis, reducing the scope for the pro- vision of efficient economic signals. In addition, the widespread use of (implicit) pen- alties may create significant risks for network users and high barriers to entry.
• The limited size of balancing zones especially in smaller countries can create sig- nificant risks for network users as well as considerable barriers to entry.
• The lack of market-based mechanisms for residual balancing by the TSOs effec- tively de-couples the costs of balancing from the market, thereby reducing the scope for cost-reflective and efficient imbalance charges. This is likely to impair the effi- ciency of residual balancing and the cross-border exchange of balancing services.
• Incompatible products for residual balancing hinder efficiency by reducing the scope for the cross-border exchange of balancing services and creating potential barriers for external participants.
• The use of different balancing periods and tolerances increase transaction costs and may result in unreasonable risks for network users. In addition, network users may be able to engage into arbitrage between two neighbouring markets with differ- ent balancing periods.
This negative assessment must however be seen in the context of fundamental differences in the availability and ownership of different sources of flexibility and the general stage of de-
Table 3: Barriers resulting from differences in balancing models
Issue Impact Assessment
Lack of market- based / cost-
reflective imbalance charges
• Need to increase (implicit) penalties to avoid arbitrage possibilities
• Inefficient price signals
• Risk of punitive imbalance charges
• Increased risk for network users
• High barriers to entry
Highly critical
Limited size of bal- ancing zones
• Increased risk for network users
• High barriers to entry
• Reduced scope for avoiding imbalances
Critical
Non-market-based mechanisms for re- sidual balancing
• De-couples costs of residual balancing from general (commodity) market
• Inhibits exchange of balancing services
Critical Incompatible prod-
ucts for residual bal- ancing
• Inhibits exchange of balancing services
• Barrier to participation of external bidders Critical Different balancing
periods
• Increased risk and transaction costs for users
• Potentially punitive imbalances
• Risk of arbitrage
Potentially serious
velopment in the EU Member States. As a result, the introduction of fully-fledged market- based systems may be unjustified or even impossible in some countries. Similarly, the size of many gas markets is the result of exogenous factors rather than conscious design deci- sions. In both cases, regional integration may be a precondition for mitigating these issues as further discussed below.
Critical Barriers identified by Users and Other Stakeholders
The assessment of potential barriers has been supplemented by a user survey based on standardised telephone interviews with a sample of network users, TSOs and national regu- latory authorities from various countries. Out of the total 35 parties contacted, approx. 50%
(19) participated in this survey and provided their views on a list of structured questions.
The user survey confirmed many of the previous findings but furthermore highlighted the fact that most stakeholders view the harmonisation and improvement of capacity management and capacity allocation as the primary goal to be pursued, although investments into new cross-border capacity are also seen as essential for establishing a true European market for natural gas. The results of the user survey can be summarised as follows:
• Capacity management and capacity allocation are widely regarded as the issues re- quiring primary attention;
• Investment in new capacity is considered insufficient and existing tariff regimes are not believed to provide correct investment signals;
• Auctions are regarded as the preferred solution for providing locational signals to network users and identifying investment needs in the international network;
• Although differences in balancing regimes are perceived as less critical than access to cross-border capacities, the lack of harmonisation is clearly seen as a barrier to cross-border trade; and
• Many open season procedures applied today are seen as critical due to the lack of international cooperation and asymmetric commitments of network users and the TSOs.
Recommendations for Harmonisation and Improvements of the Market and Regulatory Framework
Based on the findings of the international comparisons and the assessment of potential bar- riers, we have analysed a variety of potential options for improving the market and regulatory framework. In the following section, we present our resulting recommendations for harmoni- sation and potential improvements in the areas of gas transmission network tariffs, the regu- lation of investments into network infrastructure as well as gas balancing and imbalance set- tlement.
Network access and transmission tariffs
Our analysis suggest that the need for harmonisation in the area of transmission tariffs is closely related to the arrangements for capacity allocation and congestion management. In general, we therefore fully support the idea of harmonising the rules and principles for this area and emphasise the importance of many of the proposals made in early 2009,2 including in particular the bundling of entry- and exit-capacities at the same border between two differ- ent market areas.
In addition, we specifically point out the following recommendations:
• TSOs should be obliged to offer non-physical backhaul capacities at all internal bor- ders where such capacities are requested by network users, even where these ca- pacities can only be provided on an interruptible basis. In addition, it should be en- sured that non-physical backhaul capacities (i.e. capacities against the physical flow direction) are offered at cost-reflective prices and take account of the limited firmness of capacity.
• To promote an efficient use of scarce network capacities and given the lack of avail- able firm long-term capacities, it should be ensured that the pricing of different capac- ity products does not create any undue barriers for the use of short-term capacities.
2 ERGEG principles: Capacity allocation and congestion management in natural gas transmission networks. An ERGEG Public Consultation Document. Ref: E08-GFG-41-09. 15 Jan 2008
• To enable an efficient allocation and use of network capacities and to provide ade- quate locational signals, we recommend that the allocation of cross-border capacities within the Internal Market3 is at least gradually changed to the application of market- based mechanisms, i.e. auctioning.
• To enable optimal use of the European transport networks and to provide appropriate locational signals, it may be desirable to (partially) replace the current system of separate entry- and exit-tariffs at each (administrative) border by an Inter-TSO Com- pensation Mechanism. However, as the experiences from the European Electricity Market have shown, the development of a corresponding mechanism represents a highly complex task, which would require far-reaching changes to the current ar- rangements for the pricing of network capacities. We therefore believe that further studies are required before making a final decision and that this option represents a potential long-term solution only.
In particular the first two aspects but also the third can be largely addressed at a national level. Any potential measures at European level should therefore focus on ensuring that the corresponding principles are introduced and complied with at national level. Conversely, the introduction of an Inter-TSO Compensation Scheme would by definition require a regional or even a European approach and would therefore need to be addressed at the corresponding level.
Network planning and investments into new infrastructure
The lack of coordination in the area of network planning and differences in the regulatory treatment of new investments represent significant barriers for the efficient development of the European gas networks. High priority should therefore be given to further the harmonisa- tion of existing arrangements for the planning, approval and financing of investments into new network infrastructure with a regional scope.
Harmonisation of investments in multiple countries with different legal and regulatory rules will undoubtedly represent a complex task. We therefore recommend a phased approach,
3 Please note that different mechanisms may be required at the interface to external areas, which are not covered by European legislation.
which should aim at gradually introducing the basis for ensuring the necessary degree of harmonisation at a regional, and ultimately also a European level:
• As a priority, we recommend that European TSOs and regulators should continue their efforts towards developing and implementing arrangements for the coordinated planning and expansion of the European gas networks, which should cover both lo- cational aspects and the timing of investments. Besides the internal planning process of the network operators, it is paramount to also synchronise the mechanisms for as- sessing the market’s need for new capacities and the initial allocation of new trans- port capacities, for instance by means of coordinated Open Season procedures.
• In parallel, European regulators should develop mechanisms for the coordinated ap- proval of investments with a regional scope, i.e. of investments which have a tangible impact on two or more countries. In addition to a structured exchange of information and joint assessment of relevant projects, these arrangements should support the synchronisation of regulatory decisions on corresponding projects and ensure that national regulators take adequate account of regional aspects when deciding on the approval of individual projects.
• To avoid undue risks for national TSOs and as a precondition for providing adequate incentives to invest, it has to be ensured that national regulation does not conflict with any prior decisions on the approval of investments at a regional level. The legal and regulatory framework for the European gas markets should therefore be developed with a view to ensuring that national regulators take adequate account of such deci- sions within the regulation of national monopolies and that national TSOs do not face any undue risks as a result of realising the corresponding projects.
• In certain cases, the development of the regional and/or European market will benefit from the realisation of specific investments, which are not directly beneficial for the country where these investments are made. We therefore recommend also studying potential approaches for enabling the joint financing of corresponding projects, poten- tially in combination with the introduction of an inter-TSO compensation mechanism as mentioned above.
We acknowledge the potential complexity of some of the corresponding solutions and that some far-reaching changes may be required to the existing regulatory arrangements at a na- tional and European level. We therefore emphasise that further study will be required in this
respect and that particularly the latter areas of harmonisation may only be feasible in the medium- to long-term.
Secondly, we point out that the individual areas may be addressed at different levels. For in- stance, whilst the provision of information on the future development of the European gas networks should obviously be best coordinated at a European level, most underlying plan- ning and allocation processes may continue on a regional level. Similarly, the coordination of investment approvals or the shared financing of investments may potentially be realised at different levels such that we advise studying this in more detail before a final decision is made. However, TSOs and regulators should be obliged to develop corresponding solutions and to implement and apply them once they have been agreed.
Residual balancing and imbalance settlement
In line with the responses received from various market participants, we believe that the ex- istence of different arrangements for balancing does not necessarily represent a fundamen- tal obstacle for non-discriminatory access to the network. However, we also share the belief that the regional integration of balancing mechanisms and an increased compatibility of the arrangements for imbalance settlement would be decisive in reducing overall costs to Euro- pean consumers and in facilitating efficient use of the gas transmission networks.
In this respect, we also emphasise again the importance of the current efforts by ERGEG to improve the principles for capacity allocation and congestion management. An increased scope for short-term trading and utilisation of network capacities are, amongst other things, believed to result in an improved use of the network and hence a more efficient contribution by market participants to the balancing of the system.
To promote harmonisation and the development of the European gas market, we specifically recommend the following:
• TSOs (and regulators) should work to promote the cross-border exchange of balanc- ing gas, both between themselves and between TSOs and external network users.
Amongst others, the products used by different TSOs should be harmonised and, wherever possible, based on trading-oriented products, preferably being traded at notional trading points rather than individual physical locations.
• Where sufficient compatibility of the products for the balancing mechanism has been achieved, the mechanisms used for the procurement of residual balancing gas should be gradually integrated at a regional level. TSOs and regulators should there- fore promote the establishment of regional marketplaces, preferably in close coop- eration with the operators of energy exchanges, where network users and TSOs can exchange for trading and balancing purposes during the gas day. However, we em- phasise that the implementation of corresponding mechanisms require a number of preconditions to be met such that we only view them as a medium- to long-term goal.
• In parallel, the mechanisms for the determination and pricing of imbalances should be developed with a view to ensuring a maximum level of compatibility between neighbouring countries, or market areas. However, we do not believe that full har- monisation, such as the uniform use of a single balancing interval, is required. In- stead, it may be necessary to accept different balancing intervals, in order to reflect the underlying physical capabilities of different systems.
Given the lack of any commonly accepted and/or applied best-practice models for the differ- ent aspects mentioned above, we do not believe that it would be reasonable to precisely specify the structure and content of the corresponding arrangements. Moreover, the different physical structures of the transmission networks and gas supply in different regions indicate that there may be a need for slightly different solutions in different areas.
At this stage, we therefore believe that the focus at the European level should be on ensur- ing that corresponding steps are being taken, and different options are explored, with a view to gradually developing a common European approach (or model) which should then be gradually introduced in different regions.
1. Introduction
1.1 Background and Objectives
This study into methodologies for gas transmission tariffs and gas balancing fees was initi- ated by the European Commission in order to assess the existing European transmission tariff and balancing models, identify differences between them and analyse if such differ- ences have a negative impact on barrier free cross border trade.
Article 13 (2) of Regulation (EC) 715/20094 requires that tariffs for access to and use of gas transmission networks do not restrict market liquidity or distort trade across borders of differ- ent transmission systems. Where differences in tariff structures or balancing mechanisms would hamper trade across transmission systems, art. 3 (2) of Regulation (EC) 715/2009 re- quires transmission system operators to actively pursue convergence of tariff structures and charging principles including in relation to balancing. This obligation is to be fulfilled in close cooperation with the national regulatory authorities, responsible for fixing or approving, prior to their entry into force, the tariffs and conditions for the use of gas transmission networks and balancing services according to article 41 (2) of Directive 2009/73/EC5.
Notwithstanding these requirements6, it is clear that the national gas transmission tariff and balancing systems still vary due, for example, to differences in their historic gas market de- velopment, different underlying policies and regulation traditions. Transmission tariffs and balancing fees are of paramount importance for a non-discriminatory access for network us- ers, as they have major financial impact on gas supply projects.
Even though the expected payments from imbalance charges will always remain to a certain extent uncertain for a network user, it is essential for market entry that both transmission tar- iffs and balancing fees are predictable for network users. Furthermore, network tariffs should provide appropriate signals where new infrastructure is required. Balancing fees shall be
4 Regulation (EC) No 715/2009 of the European Parliament and of the Council of 13 July 2009 on conditions for access to the natural gas transmission networks and repealing Regulation (EC) No 1775/2005.
5 Directive 2009/73/EC of the European Parliament and of the Council of 13 July 2009 concerning common rules for the internal market in natural gas and repealing Directive 2003/55/EC.
6 These requirements are already included in the 'old' Regulation (EC) No 1775/2005 and Directive 2003/55/EC.
ideally based upon the costs incurred by the TSO. Overall, both network tariffs and balanc- ing fees shall be fair and non-discriminatory.
Not all regulatory tariff systems equally provide appropriate investment signals. Where such incentives are missing and tariffs only focus on tariff reduction and assess TSO efficiency against the cost level without, for example, taking system flexibility via additional capacities into account, the regulatory tariff system is likely to create a barrier for new investments.
The European Commission therefore has ordered this study to evaluate if, and how, the ex- isting differences effectively lead to barriers in trade across transmission systems and/or hamper investments in new transport capacities. Based on this analysis, this study shall fur- thermore analyse possible areas for improvement and evaluate the minimum level of neces- sary harmonisation.
This study has been supported by a Steering Group from ERGEG, which has provided valu- able comments to our work. In addition, we would like to express our gratitude to ERGEG and GIE and their respective members, the Florence School of Regulation, participants of the user survey, the organisers of the Virtual Test within the Gas Regional Initiative North- West and various other individuals and organisations, which have supported our work under this project.
1.2 Scope and Structure of this Study
As outlined above, this study assesses the transmission tariff and balancing models in the European Union, with the ultimate objective of developing a set of recommendations aimed at ensuring fair access to all customers in Europe on predictable terms, whilst simultane- ously providing sufficient incentives to network operators for investing into new (cross- border) transmission capacities.
Transmission tariffs and balancing models represent key elements of non-discriminatory network access, which is a precondition for the establishment of a functioning gas market. In addition, the successful development of the Internal Gas Market also requires improvements in a number of other areas, such as capacity allocation, congestion management or, more generally, in increased transparency. Many of these aspects are closely related with the is- sues addressed in this study. However, although reference is sometimes made to other ar- eas, we emphasise that they are outside the scope of this study.
Table 4: Aspects to be considered under Task 1
Transmission tariffs Balancing Area
Relevant for Network operators (TSOs)
Regulation of transmission tariffs
Procurement of balancing gas Network users
(Network users)
Transmission tariff structure
Settlement of imbalances
The areas analysed by this study can be grouped into a set of four different categories as il- lustrated by Table 4. For instance, whilst it is primarily the structure of transmission tariffs that is relevant for network users, the principles for the regulation of transmission tariffs are more important for network operators as they will have a direct impact on incentives to invest into new transmission capacity. Conversely, the mechanisms for residual balancing are of primary importance for the TSOs, whereas network users are more affected by the arrange- ments for imbalance settlement. The analysis in this report has therefore been generally structured along this division into four different areas, which facilitates both the presentation of information on the existing transmission tariff and balancing models and the subsequent analysis of potential barriers and areas for improvement.
Based on this background, the analysis in this report is structured as follows:
• The following Chapter 2 provides a structured comparison of the applicable transmission tariff and balancing models in all EU Member States. This analysis focuses on a number of important elements and provides the basis for the subsequent discussion of selected areas in the following chapters. The information collected is furthermore supplemented by the fact sheets in the Annex to this report, which provide a more comprehensive sum- mary of the applicable arrangements in each Member State.
• Chapter 2.5 discusses potential barriers for cross-border trade and investments into new cross-border transmission infrastructure in each of the four areas identified. Besides an extensive qualitative discussion, this part of the study includes a quantitative analysis of the impact of different imbalance settlement regimes on network users and presents the findings of a user survey, which has been used to identify areas of concern for network users, TSOs and regulators.
• Based on these findings, Chapter 4 then develops and proposes a set of recommenda- tions that may resolve, or at least help to mitigate, some of the issues identified before, insofar as these would need to be addressed in European legislation. Besides the treat- ment of the corresponding issues by the existing national authorities, particular emphasis is made on the establishment of regional markets, such as the development and
strengthening of trading hubs, the potential introduction of regional balancing mecha- nisms or the resulting requirements on transmission system operation in an increasingly integrated market.
• Finally, Chapter 5 puts the different findings and proposals into context with each other by highlighting the interaction between different recommendations and identifying a suit- able phasing of the individual changes and actions.
2. Country Comparison
2.1 Overview
This chapter compares some important elements of the gas transmission tariff and balancing models in the EU Member States. It is based on a detailed analysis of each country, which we have summarised in the form of fact sheets, one for each country, in the Annex to this report. Whilst the fact sheets provide an overview of the applicable arrangements in each country, the current chapter compares several important aspects, some of which are further addressed by the discussion of relevant differences in chapter 2.5.
To facilitate a comparison, the subsequent analysis follows the same structure as presented in the previous chapter and as also applied for the fact sheets, i.e. the discussion is divided into four major areas:
• Transmission tariff structures;
• Regulation of transmission tariffs;
• Residual balancing; and
• Settlement of imbalances.
In general, this report covers all Member States of the EU-27, exclusive of Cyprus and Malta (which have no gas transmission) and Latvia, which has not yet opened its gas market for third-party access. For similar reasons, several other countries (for instance Estonia and Finland) are dealt with in less detail.
In addition, it is important to note that the analysis in this chapter focuses on comparing im- portant features across different national systems, whilst we refer to the fact sheets for more details on individual countries. Moreover, in some cases it was not possible to obtain all the required information for each country, whereas in other cases certain issues are sometimes simply not applicable in all countries.
Finally, we emphasise that the situation in many Member States is subject to constant change, for instance due to ongoing industry consultations, new regulatory rules and deci- sions, or more generally the progress made by national TSOs and regulators in further de-
veloping the overall market and regulatory arrangements. As a general rule, the following comparison is therefore based on the status in the EU Member States as of April 2009, al- though we sometimes comment on important developments in certain countries and regions.
2.2 Transmission Tariff Structure
Against the general background provided by Directive 2003/55/EC, the EU Member States have developed a large variety of different products and tariff structures. These differences range from the choice of the general tariff model or the range of products offered to the mar- ket to the principles for the determination and pricing of individual products. As a result, it is often not easily possible to directly compare the pricing of individual products in different markets since the corresponding tariffs have to be seen in the overall context of the applica- ble network access and tariff model in each country.
For these reasons, this section focuses on a comparison of some important principles and aspects which determine the structure and calculation of the tariffs to be paid by users of the transmission network. It provides a general description of the tariffs to be paid by network users for different services and under different circumstances and gives an overview of spe- cific services offered in various countries.
In summary, the subsequent analysis covers the following aspects:
• Choice of the general tariff model (postage stamp, entry-exit, distance-based);
• Use of locational and directional charges;
• Basis for transmission charges (capacity vs. energy);
• Pricing of ‘other’ types of capacities, such as interruptible contracts, non-physical backhaul flows or short-term capacities;
• Offering of any additional services, such as title tracking, wheeling or quality conver- sion; and
• Existence of any additional tariff components, such as separate payments for fuel gas or scarcity charges in case of physical congestion.
In addition, we also comment on relevant differences in the treatment of domestic and cross- border trade where these exist.
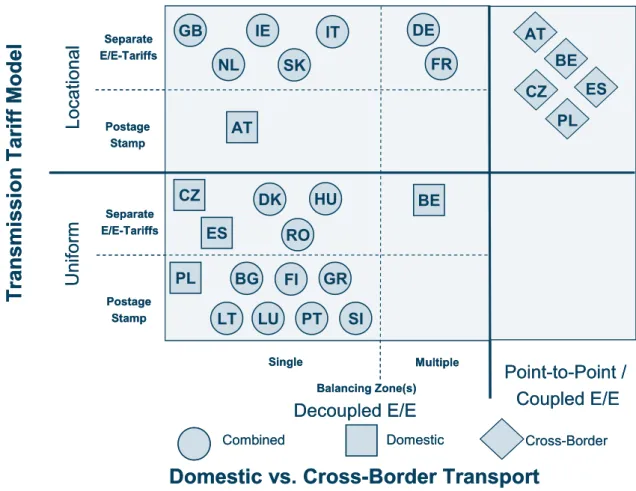
2.2.1 Basic tariff model and use of locational or directional charges
As the first part of this analysis, Figure 1 compares the basic tariff models applied in the indi- vidual Member States. It is not surprising to see that, in line with the preferred model of Di- rective 2003/55/EC, the majority of EU countries apply an entry-exit system, at least for domestic trade and supply. Conversely, several countries effectively apply a separate point- to-point regime at least for transits. Moreover, a closer analysis also reveals considerable variety in the implementation of entry-exit systems in individual countries.
Overall, the overview in Figure 1 therefore differentiates between the following approaches:
• Many countries apply truly de-coupled entry-exit systems, which principally allow for the separate contracting and use of entry and exit capacities at any point in the network;
• In some countries, this flexibility is reduced by the existence of several market ar- eas or balancing zones even where the corresponding parts of the network are di- rectly connected to each other and are supplied by the same gas quality,7 requiring separate capacity bookings for and between each of these different areas;
• Some countries also apply locational signals taking into account structural differ- ences or (implicitly) the transport distance, as tariffs tend to be lower for locations nearer to the gas entry;
• In contrast, other countries apply a more simplified version of the entry-exit system, with the entire costs of (domestic) transmission being charged to consumers by means of postage stamp tariffs;8
• As a fundamental alternative, several countries effectively apply two different tariff systems, with entry-exit tariffs being used for domestic transport, whilst cross-border
7 In addition, we note that several countries differentiate between balancing zones for high and low calorific gas (for example, Belgium, France or Germany), whilst for instance the Austrian market consists of three geographi- cally distinct areas that are not directly connected to each other.
8 A postage stamp tariff can be interpreted as an entry-exit system with entry and exit capacities always being re- quired to be equal.
LocationalUniform
Decoupled E/E
Point-to-Point / Coupled E/E DK
DE FR IE
NL SK
GB
FI GR HU
LT LU PT RO
SI
Separate IT
E/E-Tariffs
Postage Stamp
Separate E/E-Tariffs
Postage Stamp
Transmi ssi o n T ari ff Mo del
Domestic vs. Cross-Border Transport
Domestic Cross-Border
Single Multiple
Balancing Zone(s)
Combined
AT
CZ BE
ES AT PL
CZ BE
ES PL BG
Figure 1: Comparison of basic transmission tariff models in EU Member States
Note: In Finland, network tariffs are implicitly charged through the single buyer – single seller model transits are subject to point-to-point tariffs, limiting the booking of capacity to speci- fied combinations of entry and exit points with charges raised based on distance (ex- cept Spain); and
• Even in countries with a de-coupled entry-exit system, some entry or exit points may be subject to locational restrictions for individual connections,9,10 effectively intro- ducing a point-to-point system for individual points in the network only.Similarly in
9 Such as the so-called ‘Zuordnungsauflage’ in Germany
10 Please note that this group does not include the options of shorthaul capacities (discussed as a special service below) or restrictions agreed on a voluntary basis.
Belgium, network users have to specify a ‘default’ transport route (called contractual link), which becomes binding only in case of internal congestion.11
Besides the choice and design of the general tariff model, Figure 1 also shows where trans- mission tariffs are differentiated by location. As illustrated by the upper part of Figure 1 loca- tional charges are used especially in the large countries and most of the more mature mar- kets in North-Western Europe. Conversely, uniform regional charges prevail in most of the smaller markets but can also be found in some of the larger countries, such as Spain. Figure 1 also shows that a considerable number of countries have further simplified the entry-exit model (for domestic transports) by integrating entry charges into the exit tariff, corresponding to the application of a postage stamp tariff model. A similar approach has finally been cho- sen for instance by Ireland, which differentiates only the price for entry capacities, whereas there is a single exit point (zone) to the domestic onshore network.
2.2.2 Basis for transmission charging
Throughout the EU, charges for basic transmission services are mainly based on the con- tracted (i.e. booked) capacity. In addition, 12 out of 22 countries also apply a commodity charge for the energy actually transported. As illustrated by Figure 2 the ratio between ca- pacity and commodity charges varies between 70:30 and 95:5. In addition, the countries with commodity charges can be approximately evenly divided into one group, where com- modity charges are used to recover between 25% and 30% of total network charges, and a second group where the share of commodity charges is limited to 5% to 10% of total reve- nues from network charges. The only exemption is Great Britain with commodity based charges amounting to almost 50%; however, there is no fixed split in Great Britain.12 As further explained in section 2.2.4 below some TSOs apply separate charges for fuel gas and/or shrinkage or require network users to compensate the corresponding volumes of natural gas in kind. Conversely, these costs are covered by basic transmission charges in
11 Under normal circumstances, network users are free to nominate outside the contractual link, however in case of congestion the TSO can demand that a network user submits a re-nomination according to this specification.
12 National Grid levies TO (Transportation Owner) and SO (System Operator) commodity charges on entry and exit users. The TO commodity charges are used to balance any under or over recovery of TO revenue caused by the uncertainty of income from the various auction mechanisms. Whereas the SO commodity charges fund the costs of system operation including the incentive scheme costs and allows additional revenues, for example from incremental release capacity or incremental costs e.g. buy-back above the cap to be flowed back to users.
other countries. These differences should be taken into account when interpreting the differ- ences in Figure 2.
0%
25%
50%
75%
100%
AT BE BG CZ DE DK EE ES FI FR GB GR HU IE IT LT LU NL PL PT RO SI SK
Capacity Commodity
Figure 2: Split between capacity and commodity charges for domestic transmission
Note: 1) No ‘target’ split exists in GB, figures based on indicative values for regulatory period April 2009 – March 2010
2) In Spain a commodity tariff exists
2.2.3 Pricing of ‘other’ types of capacities
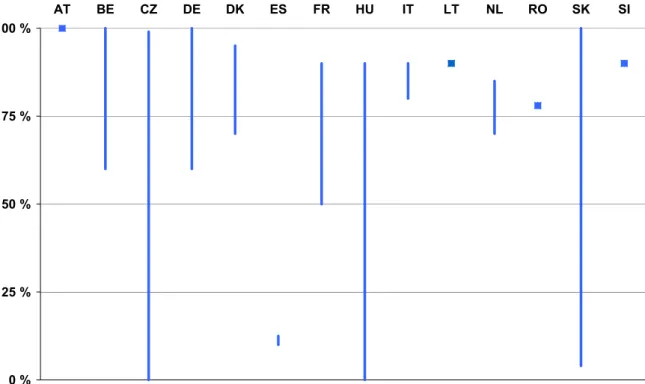
Interruptible capacity
Besides firm capacities, most TSOs also offer interruptible transmission capacity. In con- trast, only a few countries (i.e. Finland, Greece, Ireland, Luxembourg, and Portugal) do not offer this service as the TSOs do not expect any congestion problems, whilst in Great Britain this service used to be only available on a day-ahead basis. Moreover, the concept of inter-
ruptible capacities is often limited to cross-border trade,13 storage, production sites or large consumers, whereas exit capacities to domestic customers are usually provided on a firm basis.
Figure 3 shows the relative price for interruptible capacities in relation to the price for firm capacities at the same entry-exit point and for the same duration. Although most countries offer interruptible capacities at a discount of 10% to 30%, the variation in the relative price of interruptible capacities is large. For instance in France, the discount for interruptible capacity may reach up to 50%, depending on its duration. In the Czech Republic, Hungary or Slova- kia, interruptible capacity may, in extreme cases, be available for a price of almost zero, de- pending on the agreed or the actual level of interruptions during the contract period. In Ger-
0 % 25 % 50 % 75 % 100 %
AT BE CZ DE DK ES FR HU IT LT NL RO SK SI
Figure 3: Price of interruptible capacity compared to firm capacity (%)
Notes: 1) Picture shows only countries where interruptible capacity is offered to the market
2) Spanish figures based on capacity tariff only, for commodity an increase of 115% to 167%
applies
13 In the case of France and Germany, including entry and exit capacities between different internal balancing zones.
many almost every network operator uses its own tariff scheme for interruptible capacities.
Finally in Great Britain (which is not shown in Figure 3), interruptible capacity used to be of- fered for entry points only, with the price being determined by daily auctioning.14
Also it should be noted that in some cases a reimbursement scheme is in place for the case of supply interruption. For example, in Austria transit tariffs for interruptible capacity are in- deed the same as firm tariffs, with network users being compensated in case of interrup- tions. Similar mechanisms are also widely used in Germany.15
In the Spanish system interruptible capacity is available at very low cost. Actual usage of this capacity on the other hand comes at comparably higher commodity charges ranging from 115% to 167% of normal network tariffs.
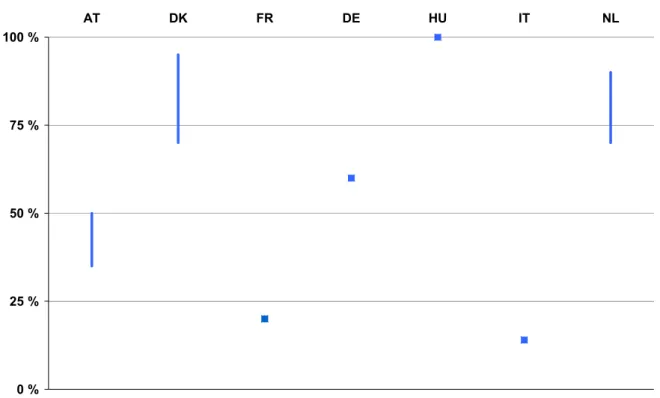
Non-physical backhaul capacity
Most TSOs do not offer non-physical backhaul capacity16 as a standard service to net- work users. In addition, this service is only offered to transit customers in Austria or the Czech Republic. However, even where backhaul is not offered as a standard product, it may still be available when a network user asks for it on a case-by-case basis.17 In some cases a distinction is made between physical or non-physical backhaul capacities (e.g. Austria) or the backhaul tariff is differentiated for the expected risk of interruption (e.g. Netherlands).
Figure 4 compares the relative price of non-physical backhaul capacity in those countries that offer this service, with the relative price being expressed as a percentage of the price for the corresponding type of firm (forward) capacity. It can be clearly seen that the variations in the (relative) price are at least as large as in the case of interruptible capacities. For instance in Hungary, network users have to pay the same price for backhaul as for firm capacity.
Conversely, backhaul capacity is offered at a discount of 65% to 85% in Austria and Italy, respectively. In Denmark and the Netherlands, the price of backhaul capacity ranges be- tween 70% and 95% of the price for firm forward capacity.
14 In April 2009, National Grid introduced a standing offer of daily interruptible (“Off-Peak”) Exit capacity accord- ing to a rules based assessment of available capacity.
15 Please note that the German market is very fragmented and that every network operator applies its own scheme such there is no uniform system for interruptible capacities.
16 In this document, we define ‘non-physical backhaul’ as backhaul capacities that can only be used in the form of reducing an existing physical flow across a given interconnector, in contrast to physical backhaul, which relates to the option of physically reversing the flow on a given pipeline.
17 In addition, backhaul may be used implicitly by the TSOs, e.g. to keep the system in balance.
0 % 25 % 50 % 75 % 100 %
AT DK FR DE HU IT NL
Figure 4: Price of non-physical backhaul capacity compared to firm capacity (%)
Note: Picture shows only countries where backhaul capacity is offered to the market
AT Applicable for transit only.
DE Only some of the transmission system operators offer backhaul capacity.
FR Backhaul capacity offered only at certain points.
Short-term capacity
Capacity contracts are typically offered for one year periods, with the possibility of reserving capacity for longer and, in most cases, also shorter contract durations.18 In addition, in most countries capacity reservations for (multiple) months and/or (multiple) days can be combined in order to have a profiled capacity contract. Long-term capacities with a duration of one year or more are generally available at the price of annual capacities times contract duration (al- though in a few countries a discount for multi-annual contracts is offered, e.g. for transit in
18 Only Austria and Finland do not offer short term capacity contracts.
Austria). Conversely, short-term capacities with a duration of less than one year are usually more expensive than long-term contracts with a duration of at least one year.
To illustrate this effect, Figure 5 compares the (relative) price of firm monthly capacities.
First, it can be clearly observed that monthly capacities are significantly more expensive in most countries. The capacity price in Portugal is far lower, however here a high premium on commodity prices during peak hours applies. Secondly, one can see that the price of
monthly capacities varies widely within most countries. These variations reflect the use of season dependent prices for short-term capacities, such as summer, shoulder or winter months. Whilst prices are usually higher for winter periods, network users may pay a smaller premium, or even receive a discount, during other (summer) months.
0 % 50 % 100 % 150 % 200 % 250 % 300 % 350 % 400 % 450 % 500 %
BE CZ DK FR DE GR HU IE IT LT LU NL PL PT RO SI SK ES
Figure 5: Relative price of monthly capacity (in comparison to annual capacity)
Note: 100% corresponds to 1/12 of the price for firm annual capacity.
DE Varies between TSOs
PT Without consideration of an additional premium of 1300% on energy transported during peak periods (applicable on working days).