Section LA
Drug Transference: Distribution of Drugs in the Organism*
Introduction . . . . . . . . . . . . 7 I.A.I. Passive Processes . . . . . . . . . . 8
1.1. Diffusion 8 1.2. Facilitated Diffusion 22
1.3. Influence of Other Passive Processes . . . . . . 29
I.A.2. Active Transport 38 2.1. Active Passage of Cell Membranes . . . . . . 39
2.2. Pinocytosis 47 Concluding Remarks . . . . 4 8
References . . . . . . . . . . . . . 48
I N T R O D U C T I O N
The transference of a drug will always be an i m p o r t a n t phase in t h e movements a n d changes it m u s t undergo in order t o bring a b o u t its effects (see P a r t I, Scheme 1). An i m p o r t a n t step in t h e distribution of a substance is t h e t r a n s p o r t of this substance from t h e site of e n t r y into t h e body t o t h e place of action.
This t r a n s p o r t is often of a r a t h e r complicated n a t u r e , since in m a n y cases a drug will have t o pass one or more barriers t o reach t h e place where its presence is required t o produce t h e effect. I n order t o reach a sufficient concentration a t t h e site of action t h e transference m u s t be rapid enough t o exceed t h e often times combined rates of biological degradation a n d elimination of unchanged
substance.
* By G. A. J. van Os, in cooperation with E . J. Ariens and A. M. Simonis.
7
8 G. A. J . VAN OS, E. J . A R I E N S , AND A. M. SIMONIS
Various types of barriers occur in t h e process of distribution, ranging from rather simple membranes like t h a t of t h e red cell, to t h e complex multicellular barriers such as gastric mucosa, intestinal epithelium, t u b u l a r epithelium of t h e kidney, t h e blood-brain barrier, and others. I t will be clear t h a t t h e absorp- tion of a drug, its t r a n s p o r t in t h e organism, its reabsorption, and its excretion are all governed by t h e passage through such membranes.
This passage m a y be active, i.e., t h e transport takes place against a potential gradient which m a y be a concentration gradient (chemical potential gradient), an electrical potential gradient, or a combination of both (electrochemical potential gradient). However, not only m a y an " u p h i l l " t r a n s p o r t be active, it is possible t h a t even a " d o w n h i l l " t r a n s p o r t m a y be accelerated by special mechanisms, and when energy consumption is involved in this mechanism t h e
" d o w n h i l l " t r a n s p o r t becomes partially active.
I.A.1. PASSIVE PROCESSES
I n m a n y cases t h e t r a n s p o r t of a drug is passive, i.e., by pure diffusion, some- times influenced by a difference in hydrostatic or osmotic pressure, by electro- osmosis, by a difference in p H between t h e two fluids separated by t h e membrane or by some other special structure. I t should be noted t h a t such a difference in pressure or p H m a y be caused by an active process. A concentra- tion gradient m a y arise from some active process, for example, in t h e kidney as a result of t h e concentrating action of t h e tubule. However, a t r a n s p o r t which is brought a b o u t or influenced by such differences will n o t be classified as active here, because t h e drug itself moves passively.
A second i m p o r t a n t factor in t h e passive distribution of a drug is given by t h e properties of t h e drug itself, e.g., its solubility, affinity for binding sites on proteins, ability t o form chelates, etc. I n this section on distribution, t h e passive processes will be discussed first, followed by a t r e a t m e n t of active transport.
I.A.1.1. Diffusion
This t y p e of transport can t a k e place by passage through pores in t h e mem- brane or by dissolving in t h e membrane substance.
I.A. 1.1.a. D I F F U S I O N THROUGH P O R E S
I t is generally believed t h a t t h e normal capillary wall a n d t h e glomerular membrane are examples of porous membranes with fairly large apertures, although i t is by no means clear where these pores are situated, or what their structure is. Solvent and solutes, with t h e exception of those with sufficiently large molecular dimensions (e.g., proteins), can pass these barriers by simple diffusion transport, aided by a concentration gradient. I n t h e case of t h e capil- lary wall t h e diffusion transport is modified by hydrostatic as well as osmotic
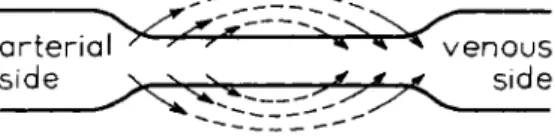
Ι,Ι.Α. DRUG T R A N S F E R E N C E : DISTRIBUTION 9 pressure differences. At the arterial end of a capillary, the hydrostatic pressure (in this case the blood pressure) exceeds t h e colloid osmotic pressure of the plasma, whereas a t the venous side the reverse is true (Fig. 1). Thus, fluid is forced out of the capillary at the arterial side and drawn back at the venous side. In the normal situation the outflow of fluid is practically balanced by the inflow, since only a small fraction of the filtrate flows to the lymph vessels.
This is the familiar Starling mechanism. I t is clear t h a t this mechanism will support the diffusion transport of the drugs from the blood to the cells and vice versa through the medium of the extracellular fluid.
In the glomerulus the blood pressure normally greatly exceeds the colloid osmotic pressure, resulting in the production of the glomerular filtrate. Here, the transport of drugs is the result of pressure differences only, since there are no concentration gradients between the fluids on both sides of the membrane, because concentration changes in the filtrate occur more distally in t h e tubules.
I t should be noted t h a t drugs are often more or less bound by the plasma proteins. In general, the molecules of t h e drug adsorbed by t h e protein mole
cules will be in equilibrium with those which are free in solution. I n such cases only the drug molecules in the equilibrium solution will be able to pass t h e capillary wall or the glomerular membrane. Although the free concentration of the drug in plasma and extracellular fluid or glomerular filtrate will be equal in these cases (apart from small differences in the case of ions, due to Donnan effects), a difference between the total plasma concentration and t h a t of the filtrate may be present. Thus, when such a difference is found, it should always be borne in mind t h a t binding to plasma proteins may be the cause.
Compared with the complex multicellular membranes of the capillary wall and the glomerulus, the membranes of cells seem to be of rather simple com
position. An old concept concerning the structure of t h e cell membrane is the filter theory (78, 79, 80, 81) which considers the cell wall as a membrane riddled with pores. Only by way of these pores can a drug enter or leave the cell, and the number and dimensions of the pores determine t h e permeability of the cell wall for molecules of different diameter. Since, however, larger particles often penetrate more easily t h a n smaller particles, particularly small ions, this picture is certainly too simple.
Around 1900 Overton (63, 64) discovered t h a t the permeability of Chara cells for a number of aniline dyes paralleled the solubility of these drugs in nonpolar solvents. Therefore, he supposed t h a t t h e cell wall was a thin, lipid
FIG. 1. Mechanism of Starling.
10 G. A. J . VAN OS, E. J . ARIENS, AND A. M. SIMONIS
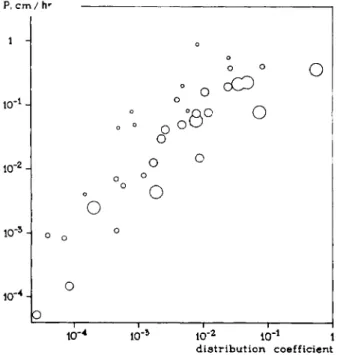
membrane and t h a t permeation would take place by dissolving in this lipid material. Indeed it was found later on by Gorter and Grendel (33, 34) t h a t the membrane of the red cell, for example, contained enough lipid material for a bimolecular lipid layer. A large number of experiments concerning this question have since been performed by Collander and Barlund (19), which are represented graphically in Fig. 2. The relation between lipid solubility and permeability is unmistakable.
P. cm / hr
distribution coefficient
FIG. 2. Relationship between the permeability of Chara cells for various drugs and the distribution coefficient between oil and water of these drugs. Ρ: permeability. Diameters of the circles are proportional to the molecular dimensions. Note that even large molecules permeate easily when their lipid solubility is sufficiently great. From Collander (19).
In order to explain the permeation of nonlipid-soluble particles, for instance, small ions, Collander (18) combined both theories in his lipid filter theory, which considers the cell membrane as a thin, lipid layer with small pores.
Davson and Danielli (26) criticized this model and demonstrated theoretically t h a t the experiments of Collander and Barlund (19) could equally well be ex
plained without assuming the presence of pores in the membrane.
More recently, however, experiments on water transport through several types of cell membranes have been carried out by a number of investigators, the results of which point to the presence of pores. The evidence is based upon theoretical considerations given by Ussing (57, 99,100) and Teorell (98), from which it appears t h a t the flux ratio, i.e., the ratio between the influx and efflux
Ι , Ι . Α . D R U G T R A N S F E R E N C E : D I S T R I B U T I O N 11 of a neutral solution, will be equal to the ratio of the concentrations (or better, activities) on both sides of the membrane if the transport takes place only by pure diffusion. However, large deviations from this ratio will occur when bulk flow of the solution through pores is possible. Actually, the second phenomenon was found in the case of a number of egg cells of fish and amphibians (73), in the case of the frog skin (15, 39), and in the case of the isolated skin of the toad (45). Recently Solomon and co-workers (65, 91, 94) concluded the existence of pores in the human red cell membrane, because different values for the per
meability to water was found under a diffusion gradient and an osmotic
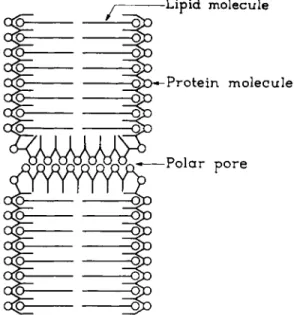
FIG. 3. Membrane pore model. From Danielli (23).
gradient, respectively. They were even able to estimate the equivalent pore radius of this red cell membrane, which was 3.5-4.2 A. Therefore, although direct evidence by observation under the electron microscope is still lacking it seems very likely t h a t these membranes, and possibly many other cell mem
branes, have pores allowing passage of water and other molecules or ions of sufficiently small dimensions.
From studies of the surface tension of cells, evidence was obtained t h a t the lipid-pore model certainly needs some refinements (17, 38, 24). The surface tension was found to be very much lower than could be expected for an oil- water interface. Adsorption of some substance from the solution outside the membrane is the most plausible explanation. Since, besides lipids, the mem
brane also contains a protein component, Danielli and Harvey proposed a bimolecular lipid layer with pores and probably a monomolecular protein
12 G. A. J . VAN OS, E. J . ARIENS, AND A. M. SIMONIS
layer coating both sides of the membrane and the wall of the pore (Fig. 3). In this model, the inner surface of the pore may be electrically charged because of the presence of polar side-chains of the protein. In view of the complex behavior of the cell membrane, especially with respect to drugs which play some role in metabolism, this model seems rather simple. Bungenberg de Jong, and his co-workers have proposed a number of more complex models which will not be discussed here (10a, 11).
L A . 1.1.6. D I F F U S I O N BY DISSOLVING IN THE MEMBRANE MATERIAL
I t will be clear t h a t the passage of nonpolar substances through a thin lipid membrane will be easier than the passage of polar molecules. Ions are the most extreme example of polar substances. In recent years a number of investigators have shown t h a t the concept of the lipid membrane is of great importance to the pharmacologist (86). From their experiments it appears probable t h a t for
pH = 7
neutral = 1
pH = 1
neutral - 1
i o n i z e d = 1 0 0 0
pH = 7
neutral= 1
pH = 1
r / / / i > neutral = 1 ionized= 0.001 ionized =0.001
II
ionized = 1 0 0 0Ά V//A
weak acid pKa=4 weak base pKa = 4
Α Β
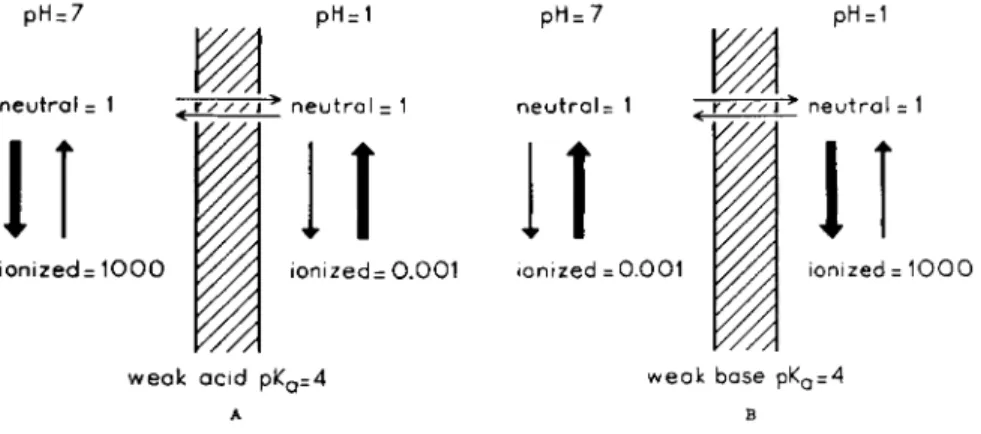
FIG. 4. A . and B . Influence of pH on the distribution of weak acids and bases between two osmotically buffered solutions separated by a lipid membrane.
many drugs, especially organic compounds which have molecules of moderate dimensions, the biological membrane behaves very much as a lipid layer. In view of the large number of drugs belonging to this class and used by the pharmacologist for therapeutic and purely scientific purposes, it seems per
tinent to discuss this matter in some detail.
Since ions are strongly hydrophilic and thus poorly soluble in lipid solvents, they will not be able to pass a lipid barrier to any extent by simple diffusion.
Many drugs are weak acids or bases. The nonionized, neutral form of these compounds may be lipid soluble. Then the neutral form will be able to pass the barrier, by nonionic diffusion. When equilibrium is reached, the concentration of the neutral form will be equal on both sides of the barrier, but the total con
centration, the sum of ionized and nonionized form, will be different, depending on the p H on each side of the barrier. Only when the p H is the same will the total concentration be equal. This is represented in Fig. 4. Here a lipid mem-
Ι , Ι . Α . D R U G T R A N S F E R E N C E : D I S T R I B U T I O N 13 brane is assumed to be present between two solutions of p H 7 and p H 1, both containing a weak acid with a pKa of 4. When equilibrium has been reached the neutral form has an equal concentration on each side of the membrane (Fig. 4A).
The concentration ratio of neutral and ionized form can now easily be derived from the well known Henderson-Hasselbalch equation, which for a weak acid reads:
ionized form
P H " P* " + 1° g n e u t r a l f o r m ( 1) From this equation it can be seen t h a t on the left-hand side of the membrane
the ratio of the neutral and ionized moiety, because the p H is 7, is about 1:1000.
On the right-hand side, however, since the p H is 1, this is about 1:0.001. The total concentration ratio thus becomes about 1000:1. For a weak base of ρ JL a 4*
this ratio will be reversed (Fig. 4B) since in this case Eq. 1 changes into:
, neutral form
PH = P *a+ l o gi o n i z e d f o rm (2)
I t should be emphasized t h a t an extreme concentration ratio, as is reached in these examples, can occur only when the fluids on both sides of the barrier are osmotically buffered, i.e., when the osmotic concentration of the drug on either side is very small compared with the total osmotic concentration of the fluids.
Shore et al. (90) obtained evidence t h a t the barrier between plasma and gastric juice has the characteristics of a lipid membrane for a variety of drugs. Dogs with Heidenhain pouches had drugs infused intravenously in such a way t h a t the plasma level was maintained constant. After equilibrium had been reached, the concentration of the drug in plasma and gastric juice was determined. The concentration ratio found, after correction for binding of the drug to plasma proteins, was compared with the ratio obtained from the Henderson-Hassel
balch equation, assuming only the neutral form to be able to pass the barrier.
Some results are given in Table I, which shows good correlation between ex
perimental and theoretical concentration ratios. The very high theoretical ratios for bases with a p i ia of 5 or higher are not found experimentally. Since these drugs were completely absent from the blood leaving the stomach, it seems likely t h a t the limiting value, 40, of these drugs is determined by the amount present in the blood reaching the gastric mucosa.
From these experiments one could predict ready absorption of those drugs which are present in the acid media of the stomach in a nonionized state.
Schanker et al. (87) found this to be true in the rat. The results of their studies are presented in Table I I . Acids, except the very strong ones, were easily absorbed. Strong bases were not absorbed; extremely weak bases were.
* Here pKa is, according to Bronstedt, the so-called acidic dissociation constant of the base. Its relation to the basic dissociation constant is: pKa + pKb = 14. A strong base has a low pKb and, therefore, a high pKa, and vice versa.
14 G. A. J . VAN OS, E . J . A R I E N S , AND A. M. SIMONIS
Experiments on t h e absorption from t h e r a t small intestine (88, 41) a n d t h e r a t colon (85) suggested t h a t t h e intestinal mucosa also behaves as a lipid barrier to a large number of drugs (40a).
An analogous mechanism appears to be in action a t the blood-brain barrier.
I n the latter case, the p H on both sides of t h e barrier is nearly equal. Therefore, when the blood-brain barrier behaves as a lipid membrane, a lipid-soluble drug will reach a b o u t the same free concentration on both sides of t h e barrier. I n this
TABLE I
DISTRIBUTION OF DRUGS BETWEEN GASTRIC JUICE AND PLASMA OF DOGS"
Experimental R6
Experimental (corrected for Theoretical Drug pKa Rfc plasma binding) Rft
Bases
Acetanilide 0.3 1.0 1.0 1.0 Theophylline 0.7 1.5 1.3 1.5 Antipyrine 1.4 4.2 4.2 4.2 Aniline 5.0 40 — 10*
Amidopyrine 5.0 42 — 104
Quinine 8.4 38 — 10e
Dextrorphan 9.2 40 — 10e
Acids
Salicylic acid 3.0 0 0 10~4
Probenecid 3.4 0 0 10"4
Phenylbutazone 4.4 0 0 10~3
p-Hydroxy propiophenone 7.8 0.13 0.5 0.6 Thiopentone 7.6 0.12 0.5 0.6 Barbitone 7.8 0.6 0.6 0.6
a From Shore (90).
b R = (Concentration in gastric juice/Concentration in plasma).
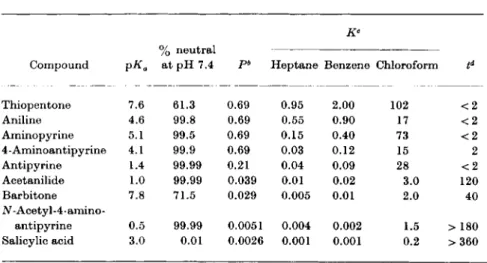
case, however, an additional factor of importance is t h e rate of transfer. This will determine the time in which equilibrium is reached. The more lipid- soluble the drug, the greater the r a t e of transfer, a n d the shorter t h e time to equilibrium. Since only the nonionized fraction of a drug is assumed to be lipid- soluble, the rate of transfer across the membrane is dependent upon its pKa. Thus, a base with a high j)Ka will have a slow rate of penetration. For a weak acid the reverse can be expected. This was experimentally demonstrated by Brodie and co-workers (14, 55). Results of such studies are shown in Table I I I (12, 54, 55).
Ι , Ι . Α . D R U G T R A N S F E R E N C E : D I S T R I B U T I O N 15 I t is clearly seen t h a t substances which are highly lipid soluble at p H 7.4 penetrate very rapidly into the cerebrospinal fluid. The penetration becomes slower with decreasing lipid-solubility. This is consistent with the well-known fact t h a t strong bases, like tetraethylammonium, with a very high p i £a do not penetrate into the brain at all when introduced into the circulation. They are
T A B L E I I
ABSORPTION OF DRUGS FROM THE STOMACH OF RATS"
Drugs pKa Absorption %
Acids
5-Sulfosalicylic Strong 0
Phenol red Strong 2
5 - Nitr osalicy lie 2.3 52
Salicylic 3.0 61
Acetylsalicylic 3.5 35
Benzoic 4.2 55
Thiopentone 7.6 46
^-Hydroxypropiophenone 7.8 55
Barbitone 7.8 4
Quinalbarbitone 7.9 30
Phenol 9.9 40
•ases
Acetanilide 0.3 36
Caffeine 0.8 24
Antipyrine 1.4 14
Aniline 4.6 6
Amidopyrine 5.0 2
p-Toluidine 5.3 0
Quinine 8.4 0
Dextrorphan 9.2 0
Mecamylamine 11.2 0
Darstine Strong 0
Tetraethylammonium Strong 0
a From Schanker (87).
practically completely ionized at the physiological p H and thus their neutral lipid-soluble forms are present in negligible quantities. On the other hand, weaker bases like tertiary amines, for example, atropine, scopolamine, nico
tine, pilocarpine, tremorine, and a weak acid like thiopentone are partially in the neutral lipid-soluble form at the physiological p H and the rapid penetration of these substances into the brain is well known. Typical examples are given in Figs. 5 and 6A.
16 G. A. J . VAN OS, E. J . ARIENS, AND A. M. SIMONIS
T A B L E III
CORRELATION OF PENETRATION OF DRUGS INTO THE CEREBROSPINAL FLUID AND THEIR LIPID SOLUBILITY0
Compound 7o neutral
at pH 7.4 pb Heptane Benzene Chloroform td Thiopentone 7.6 61.3 0.69 0.95 2.00 102 < 2
Aniline 4.6 99.8 0.69 0.55 0.90 17 < 2
Aminopyrine 5.1 99.5 0.69 0.15 0.40 73 < 2
4 - Aminoantipy rine 4.1 99.9 0.69 0.03 0.12 15 2
Antipyrine 1.4 99.99 0.21 0.04 0.09 28 < 2
Acetanilide 1.0 99.99 0.039 0.01 0.02 3.0 120
Barbitone 7.8 71.5 0.029 0.005 0.01 2.0 40
Ν - Acetyl - 4 - amino -
antipyrine 0.5 99.99 0.0051 0.004 0.002 1.5 > 180 Salicylic acid 3.0 0.01 0.0026 0.001 0.001 0.2 >360
a From Mayer (56).
b Ρ: permeability constant.
e Κ: partition coefficient between lipid solvent and a buffer of pH 7.4.
d t: time in minutes to attain a cerebrospinal fluid: plasma ratio of 1.
Figure 5 illustrates t h e results of experiments done by Pfeiffer and J e n n e y (68). R a t s were trained to escape an electric shock preceded b y a warning buz
zer by climbing a wooden pole. This conditioned response is inhibited b y pilo
carpine, which is a tertiary amine and is able to pass t h e blood-brain barrier.
% conditioned responses 100
80 Η
60
-I
XV
^ ^ atropine or 3 -| methyl atropine pilocarpine
20
-30 - 2 0 ~ 10 1 10 20 ι—
3 0
— 1 4 0 50 6 0 ι — 7 0 min FIG. 5. Effect of pilocarpine on the conditioned response of the rat. 1. Pilocarpine alone.
2. Rats were protected with atropine. 3. Rats were protected with methylatropine. From Pfeiffer and Jenney (68).
Ι,Ι.Α. DRUG TRANSFERENCE : DISTRIBUTION 17
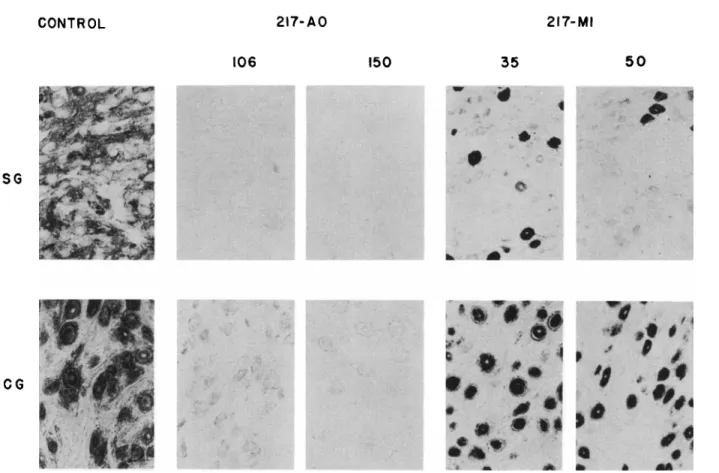
FIG. 6. A. Sections of stellate ganglia (SG) and ciliary ganglia (CG) of cats after treatment with 217-AO or 217-MI, and stained for cholinesterase activity. Dose is in /xg/kg. From Mclsaac (56).
CONTROL 217-AO 217-MI 106 150 35 50
SG
CG
18 G. A. J . VAN OS, E . J . A R I E N S , AND A. M. SIMONIS
t h a t after t r e a t m e n t with t h e t e r t i a r y compound 217-AO, extracellular as well as intracellular AChE activity has been abolished, whereas in t h e case of 217-MI intraneuronal acetylcholinesterase was still heavily stained. B y Rail et al. (74) it has been demonstrated t h a t experimentally induced p H gradients between plasma and cerebrospinal fluid caused changes in t h e distribution of a drug, which were also in agreement with t h e theory outlined above. Attention must be drawn to the fact t h a t t h e barrier between blood and brain tissues a n d t h a t between blood and cerebrospinal fluid differ in certain aspects (26a,b).
I n general it m a y be concluded t h a t t h e lipid solubility of a drug plays a major p a r t in its permeation of t h e central nervous system. Strong bases like most q u a t e r n a r y ammonium bases do not penetrate a n d have no central effects, in contrast to t h e t e r t i a r y bases and also anesthetics like ether a n d chloroform, which are much more lipid soluble a n d so gain rapid access t o t h e central nervous system. For further details see (26c, 28b, 36a, 40a, 56a, 57a, 74a, 76a, 76b, 94b, 98a, 106a, 106b).
The concept of t h e lipid barrier seems t o have a certain, t h o u g h limited value in t h e case of t h e kidney. The first step in t h e action of t h e kidney is t h e forma- tion of t h e plasma filtrate a t t h e glomeruli, in m a n a t a rate of about 125 ml/min.
When t h e rats were protected with atropine, a t e r t i a r y amine too, no influence of pilocarpine is found. Methylatropine, however, a quaternary amine, which is not able t o pass t h e blood-brain barrier, does not protect t h e animal against t h e action of pilocarpine.
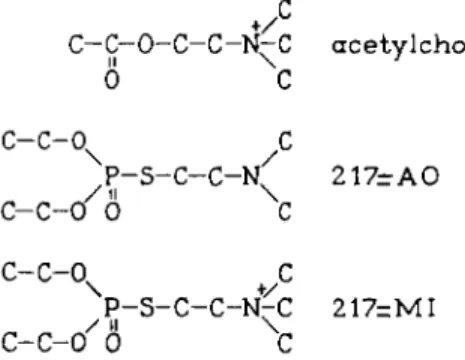
Figure 6A is t a k e n from Mclsaac and Koelle (45a, 56). Cats were treated with two potent irreversible anticholinesterase agents. These compounds are repre- sented by t h e symbols 217-AO and 217-MI; their structural formulas are shown in Fig. 6B. The first drug is a t e r t i a r y amine, t h e second a quaternary amine. The ratio of their respective oil: water partition coefficients is 2 1 7 : 1 . After t r e a t m e n t with enzymologically equivalent doses of both drugs (106 a n d 35 /xg/kg for 217-AO or 150 and 50 /xg/kg for 217-MI), sections of t h e stellate and ciliary ganglia were stained for cholinesterase activity. I t is clearly seen
+
/
C - C - 0 - C - C - N - C a c e t y l c h o l i n e
II \ 1
0 C
c - c - o
xc
P - S - C - C - K 2 1 7 - A O
/ i l \
C - C - 0 0 C
C - C - 0 + C
P - S - C - C - N ^ C 217=MI
c-c-o'6 C
FIG. 6. B . Acetylcholine and the anticholinesterases, 217-AO and 217-MI.
Ι , Ι . Α . D R U G T R A N S F E R E N C E : D I S T R I B U T I O N 19 This filtrate, which is protein free but otherwise has the same composition as the plasma, then runs into the tubules where nearly all the water crosses the tubule wall, returning to the plasma. This results in a urine flow of normally about 1 ml/min. A solute in the filtrate which is not able to pass the tubule wall (e.g., inulin) will then be concentrated and reach a final concentration in the urine of about 125 times t h a t of the free plasma concentration. When the drug
n e u t r a l = 1 γ / / /\ > n e u t r a l = 1
weak b a s e p KQ- 7 . 4
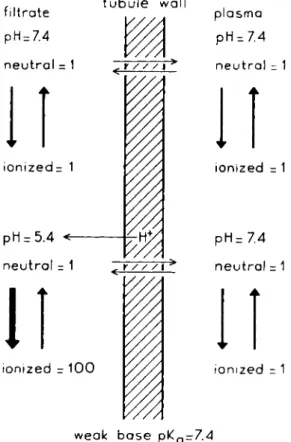
FIG. 7. Influence of the pH of the urine on the excretion of a weak base.
is not bound to plasma protein, 125 ml plasma will be cleared of the solute, or in other words, the clearance of the solute is 125 ml/min. Many drugs are able to pass the tubule wall by passive diffusion and/or by active transport mechan
isms. The active transport may be either from tubular lumen to plasma (reab- sorption) or from plasma to lumen (secretion). When reabsorption is complete, the clearance becomes zero (e.g., glucose). When secretion is complete, the clearance rises to the level of renal plasma flow, normally about 700 ml/min.
Diodrast (see Table V and Fig. 21) is used as a radiopaque contrast medium in the pyelography. These active transport mechanisms will be considered
20 G. A. J . VAN OS, E. J . ARIENS, AND A. M. SIMONIS
later in more detail. Some evidence has been obtained concerning diffusion which suggests t h a t the tubule wall behaves as a lipid barrier. If this is true the influence of the p H of the urine on the excretion of weak acids and bases can be predicted. Consider, for example, a weak base with a pKa of 7.4. In the plasma and in the glomerular filtrate, which have a p H of 7.4, the weak base will be half in the nonionized and half in the ionized form (Fig. 7). Now assume that the filtrate is acidified in the tubule to p H 5.4. At this level of acidity only 1% of the base will be in the nonionized form. Should this form be sufficiently
T A B L E I V
WEAK ACIDS AND BASES EXCRETED BY NONIONIC DIFFUSION"
Plasma Clearance ratio*
Weak base protein
or acid binding
(%)
Acidic excretion
Alkaline excretion
Remarks
Ammonia 9.3 high low
Quinacrine 7.7 80-90 3.0 0.5 Total plasma
clearance; man
Chloroquine 8.05 55 high low Exact figures not
available
Quinine 8.3 70 0.65 0.05 Total plasma
clearance; dog
Procaine 8.95 30 2.25 0.25 Unbound plasma
clearance; dog
Mecamylamine 11.3 28 4.6 0.06 Total plasma
clearance; dog
Salicylic acid 3.0 75 0.02 1.6 Unbound plasma
clearance; man
Phenobarbital 7.2 40 0.1 0.7 Unbound plasma
clearance; dog
α From Milne (58)
b Clearance ratio = clearance of substance/clearance of inulin.
lipid soluble it will be able to pass the tubule wall rapidly, so t h a t equal con
centration of the neutral form on both sides of the barrier will be attained. If we accept the supposition t h a t the barrier is completely impermeable for the ionized form, the concentration of the base in the urine will be about 50 times t h a t in plasma. Thus, with a normal urine production of 1 ml/min. the clearance would be 50 ml/min. When the filtrate is not acidified in the tubule, then the total concentration of the drug in the urine and plasma will be the same and a clearance of 1 ml/min will be found. For weak acids the reverse will be true, the excretion will increase with increasing p H of the urine. A number of weak bases and acids are known to behave according to this concept. Reference to
Ι,Ι.Α. DRUG TRANSFERENCE I DISTRIBUTION 21 Table IV, taken from Milne, Scribner, and Crawford (58), permits one to com
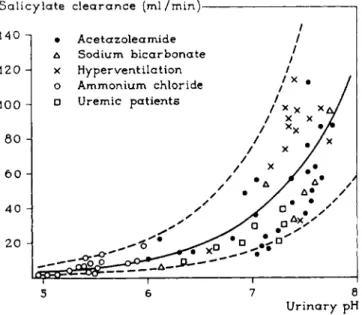
pare the clearance ratio of the drug to t h a t of inulin in acidic and alkaline urine. The effect of urinary p H on the excretion is most striking in the cases of mecamylamine and salicylic acid. The pH-dependent excretion of salicylic acid can also be seen in Fig. 8, taken from Macpherson, Milne, and Evans (53). Excretion increases markedly with rising p H of the urine.
This effect has been used in practice in the treatment of severe barbiturate poisoning. Alkalinization of the urine by administration of sodium lactate, gives a large increase of the excretion of the drug (4a, 47, 60, 62). From Fig. 8 it also appears t h a t the increased excretion has nothing to do with the p H
S a l i c y l a t e c l e a r a n c e ( m l / m i n ) 1
• A c e t a z o l e a m i d e / Δ Sodium bicarbonate /
5 6 7 8 U r i n a r y pH
FIG. 8. Salicylate clearance as a function of urinary pH. From Macpherson (53).
of the body fluids, because acetazoleamide (Diamox) causes a high p H of the urine together with systemic acidosis, while sodium bicarbonate and hyper
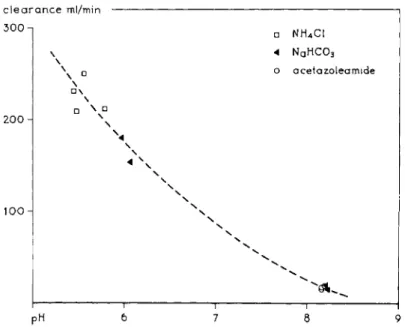
ventilation give rise to a systemic alkalosis. A similar conclusion can be drawn in the case of mecamylamine, illustrated by Fig. 9 which is constructed from data of Baer et al. (4). Another example t h a t speaks in favor of the lipid barrier hypothesis in the kidney is given in Table V. Here the excretion of a series of X-ray contrast media in urine and bile is given. With increasing length of R, i.e., with increasing lipophilic character of the drug, the excretion in the urine decreases because reabsorption is more complete. On the other hand, the excre
tion in the bile increases. I t is often found t h a t hydrophilic substances are excreted in the urine, lipophilic substances in the bile (2). Although these ex
amples accord well with the lipid barrier hypothesis, it should be emphasized
22 G. A. J . VAN OS, E . J . ARIENS, AND A. M. SIM0NIS clearance ml/min
300-
200 Η
100
• NH4C1 4 NAH C 03
ο acetazoleamide
\
• \
\ • \
\
1 1 1 :
PH 6 7 8 9
FIG. 9. Clearance of mecamylamine as a function of urinary pH. From Baer (4).
that, especially in renal secretion, many cases are known where special me
chanisms undoubtedly are involved in the transport. Therefore, at present it can be said t h a t probably in the process of renal excretion, the lipid barrier and therefore nonionic diffusion, plays a part (26d, 40a).
TABLE V
EXCRETION OF A SERIES OF X - R A Y CONTRAST MEDIA (DIODRONE DERIVATIVES) AFTER INTRAVENOUS ADMINISTRATION"
I—C Ο
II
C \N/ C R—C—COOH
R Urine Bile
Η + + +
CH3 + + + —
+ + +
C3H7 + + +
C4H9 — + + +
— + + +
From Archer (3).
ΙΛ1.2. Facilitated Diffusion
There are a number of instances where a substance moves according to existing gradients, ending with equal concentration on both sides of the barrier.
Ι,Ι.Α. DRUG TRANSFERENCE : DISTRIBUTION 23 This occurs in such a way t h a t the movement cannot be explained by simple diffusion. Although energy consumption is not necessarily involved in such a process, some mechanism must be supposed in order to explain this type of transport—which Danielli (23) called "Facilitated diffusion." A classic ex
ample of this type of transport is the permeation of glucose and other sugars in the red cell of man and ape. This permeation has been intensively studied and it seems relevant to consider the results of these studies here in some detail because they represent a typical case of facilitated diffusion. Moreover, facili
tated diffusion usually shows the same characteristic features found in active transport and, therefore, may serve as a suitable model for an understanding of these types of permeation.
0.1
0.Ό5
2 . 0 5RS0
FIG. 10. Exit rate of sugar from human red cells as a function of concentration gradient.
S0: sugar concentration outside = constant. St: sugar concentration inside, v: exit rate of sugar. From Wilbrandt (112).
The human red cell membrane is much more permeable to polar substances such as glucose, glycerol, urea, and chloride ions than can be expected from the simple lipid membrane hypothesis. The permeation of these substances is from 10 to 104 times more rapid than their lipid solubility would theoretically allow. Furthermore, rapid diffusion through the pores also seems unlikely because these pores are very small (94). From the studies of LeFevre (48, 49, 50), Wilbrandt and Rosenberg (75,110, 111, 112,113,114), and Widdas (107, 108, 109), it has become evident t h a t special mechanisms are involved in sugar transport across the red cell membrane. In the first place the glucose permeability of the red cell membrane shows a limited capacity. When the rate of transport is plotted against the concentration difference, a curve of the type shown in Fig. 10 is obtained (112),
Another striking effect demonstrated by Wilbrandt and yielding evidence against simple diffusion, is the dependence of the sugar exit rate upon the external concentration when the outside concentration is low compared with the internal concentration. In the case of simple diffusion it might be expected
24 G. A. J . VAN OS, E. J . ARIENS, AND A. M. SIMONIS
t h a t the exit rate would be only very slightly influenced by variation of the external concentration when this concentration is low, compared with the inside concentration. A strong dependence, however, was found (Fig. 11). The limited capacity of the transport system was also shown by LeFevre using the method of 0rshov. After addition of glucose to a very dilute suspension of red cells, the light transmission is followed by photometric recording (Fig. 12) (49).
At low external glucose concentration equilibrium is rapidly attained, but with increasing external concentration the approach to equilibrium becomes more and more delayed. Similar results were obtained with various other sugars
ν ι 1
FIG. 11. Exit rate of sugar from human red cells as a function of the inside concentration.
S{: inside concentration. S0: different outside concentrations, v: exit rate of sugar. From Wilbrandt (112).
of related structure, for instance, the aldoses, dextrose, mannose, galactose, arabinose, and xylose. The ketoses, levulose and sorbose, on the other hand, penetrated according to simple diffusion. Competition between the sugars for the permeation could also clearly be demonstrated. This is shown in Fig. 13 (49).
The upper curve shows t h a t the uptake of sorbose is completely blocked in the presence of dextrose, but, as appears from the lower curve, presence of sorbose has no effect on the later uptake of dextrose.
I t is evident from these experiments t h a t some special mechanism must be assumed to explain these deviations from simple diffusion. The most widely accepted hypothesis is t h a t of the membrane carrier. [For recent reviews on carrier transport, see (115) and (44).] This presumes t h a t the molecules of the drug may pass the membrane by forming a complex with a carrier molecule
Ι,Ι.Α. DRUG TRANSFERENCE: DISTRIBUTION 25 on one side of the membrane. This complex now is able to cross the membrane since in this form it may be much more lipid soluble than the substrate. On the other side of the membrane the complex is broken and the carrier molecule diffuses back (Fig. 14). When the formation and breakdown of the carrier substrate complex is catalyzed by the same or different enzymes and the dimensions of carrier and complex molecules are small enough, then a rapid
J 1 I u
0 5 10 15 Minutes
FIG. 12. Light transmission of a dilute red cell suspension as a function of time. At zero time, saline isotonic with the suspension and containing glucose was added. Final glucose concentrations are indicated. Immediate deflection at zero time is the resultant of dilution of suspension (upward deflection) and cell volume change (shrinkage downward); subse
quent upward deflection records cell swelling with uptake of sugar and water. From LeFevre (49).
penetration of a substance to which the membrane is otherwise impermeable would be possible. This model can explain fairly well the properties of sugar transport in the case of the red cell membrane (75,109,114). A very simplified theoretical treatment may be instructive to the reader and will be given here.
Suppose the reaction of substrate S with carrier C,
C + S ^ CS (3) because of the presence of the enzymes, is rapid as compared to the diffusion
26 G. A. J . VAN OS, E . J . ARIENS, AND A. M. SIMONIS
^ S o r b o s e
I I I I I 0 5 10 15 20
M i n u t e s since first a d d i t i o n
FIG. 13. Light transmission of a dilute red cell suspension as a function of time, register- ing the entrance of a sugar into red cells, influenced by another sugar. Upper curve:
inhibition of uptake of sorbose in the presence of dextrose. Lower curve: uptake of dex- trose not affected by the presence of sorbose. Deflections interpreted as in Fig. 1 2 . From LeFevre (49).
membrane
FIG. 1 4 . Schematic representation of the membrane carrier mechanism. S: substrate.
C: carrier. CS: carrier-substrate complex.
Ι,Ι.Α. DRUG TRANSFERENCE: DISTRIBUTION 27
rate of complex and carrier in the membrane. Now equilibrium is established on both sides of the membrane. Then:
SxC rr
~ctT
= K<
Wwhere S, C and CS stand for the concentrations and K8 is the equilibrium con
stant or Michaelis-Menten constant. When we assume t h a t the diffusion con
stants of C and CS are equal in the membrane, the total concentration Ct of the carrier molecules in the membrane is constant and Eq. (4) can be written as
Cx(Ct-CS)
—cs—
= K> (5)By solving for CS in this equation, we obtain:
This equation can now be applied to both sides of the membrane, hence:
The transport rate v9 i.e., the amount of substrate penetrating per unit area per unit time, will then be in accordance with Fick's law:
n CS1-CS2
ν — Dx—^ d XK+Sj^ Κ+8J K '
where D is the diffusion constant of carrier and complex and d is the thickness of the membrane.
Let us now consider two extreme cases:
1. The carrier is far from saturation. This means C8/Ct <ξ 1 and, thus, from E q . (6):
CS S S
— = (9) Ct Κ,+S Ks
' y
This case will be found when the substrate concentration is low compared with K8. Equation (8) now becomes:
DC
ν = ^ ( S i - S i ) (10) Hence, the transport rate is proportional to the concentration gradient, as in
simple diffusion (compare first parts of the curves in Figs. 10 and 11).
28 G. A. J . VAN OS, E . J . A R I E N S , AND A. M. SIMONIS
2. The carrier is practically saturated. Now we have [cf. E q . (6)]:
1 or ^ i , (11)
C\ Ks+S
I n this case t h e substrate concentration is high compared with Ks. Then from E q . (8):
DxC, DxCt S^St
v
= -dr-
x(K
s+8
l){K
s+s
2) ~ ~ir
xK°-s^
(12)DxCt v / l 1 \ . . . .
v
- - d -
x E'
x( s
t- s J
( 1 3 )Thus, a t concentrations of Sv which are high compared with those of S2, t h e term becomes very small compared with t h e t e r m ljS2 a n d t h e t r a n s p o r t rate is practically independent of S1 (see horizontal p a r t s of t h e curves in Figs. 10 a n d 11). Moreover, a t constant high concentrations oiS1 t h e transport rate must in this case be highly dependent on variations in t h e low concentra- tion of S2. This is actually found, as is demonstrated in Fig. 11 (110).
I t can further be seen from t h e Eqs. (10) and (13) t h a t in both cases t h e transport rate also depends on t h e affinity ljKs. I n t h e first case (carrier far from saturation) t h e transport rate is proportional to t h e affinity, b u t in t h e second case (carrier nearly saturated) it is inversely proportional to t h e affinity.
The latter conclusion, in contrast with t h e former, seems a t first glance some- w h a t unexpected. I t is, however, quite conceivable for, in t h a t case, t h e trans- port rate is determined by t h e breakdown of t h e substrate-carrier complex a t t h e low concentration side and therefore will decrease with increasing affinity of t h e substrate for t h e carrier.
Wilbrandt's experiments (111) on sugar penetration in red cells are in agree- ment with these conclusions. At low concentrations t h e order of increasing transport r a t e is sorbose, arabinose, galactose, mannose, a n d glucose, whereas a t high concentrations t h e order is just t h e reverse.
The phenomenon of competition can also easily be understood from t h e carrier hypothesis. Suppose two substrates, one with a high, t h e other with a low affinity for t h e carrier, are present b u t t h e carrier is far from saturation for both substrates. When S1—S2 is t h e same for these substrates, t h e transport rate will be highest for t h e substrate with t h e highest affinity (l/Ks) [Eq. 10].
W i t h rising concentration of t h e high affinity substrate t h e carrier soon be- comes saturated and t h e transport of t h e low affinity substrate will t h e n be blocked completely. A substrate of low affinity, however, will n o t be able t o influence t h e transport of a drug with a high affinity (study Fig. 13). F r o m t h e foregoing, another interesting conclusion can be drawn. Powerful competitors, i.e., drugs with a high affinity for t h e carrier, will easily saturate the carrier, b u t a t t h e same time are only slowly transported, and vice versa. Examples of such saturation will be given later.
Ι,Ι.Α. DRUG -TRANSFERENCE : DISTRIBUTION 29 lΛΑ.3. Influence of Other Passive Processes
I.A.1.3.a. B I N D I N G TO PROTEINS
As already mentioned, many drugs, organic as well as inorganic, are more or less bound by proteins. In this respect the plasma proteins, particularly
a m o u n t bound
f „ !
Ci • f r e e c o n c e n t r a t i o n 2 A
free c o n c e n t r a t i o n
• total c o n c e n t r a t i o n FIG. 15. A. Schematic representation of the binding of a drug to protein as a function of the free concentration. B. Free concentration of the drug as a function of the total con
centration, a: saturation value = binding capacity. C±: concentration at which the pro
tein is 50% saturated. 1/Oj: affinity.
albumin, are of importance. There will always be a dynamic equilibrium, be
tween the drug molecules which occupy the protein-binding sites and the drug molecules which are free in solution. Hence, the binding will be a function of the free concentration, and, in general, this function has the form of a Langmuir adsorption isotherm (Fig. 15A), showing t h a t with rising concentration the
30 G. A. J . VAN OS, E . J . A R I E N S , AND A. M. SIMONIS
protein gradually approaches saturation. I t is obvious t h a t with rising plasma level (bound -f unbound) t h e free concentration will first increase slowly be- cause most of t h e drug is bound, b u t a sharper rise in free concentration will occur when t h e proteins are saturated (Fig. 15 B). The forces responsible for the binding are, in t h e case of ions, often of electrostatic n a t u r e . Most plasma proteins have isoelectric points (iep) below t h e physiological p H of 7.4 and, therefore, t h e y carry a negative charge a t this p H . This does not mean t h a t only positive ions can be bound, because t h e charge usually is t h e algebraic sum of a large number of positive and negative groups. Albumin (iep 4.9), for example, has a t p H 7.4 a net negative charge of about 16 electron units, which is composed of 100 negative and 84 positive groups (97). Cations can be bound by t h e negative groups, anions by t h e positive groups. B u t neutral molecules also, especially large stretched or flat organic structures, which fit t h e nonpolar groups of t h e protein molecule, can be adsorbed owing to forces of nonelectro- static n a t u r e . When a molecule contains charged groups together with fitting nonpolar groups, a very strong binding m a y occur. The adsorption of drugs t o proteins has several effects:
1. Excretion is delayed. A typical example is calcium. When t h e plasma albumin content is low, calcium excretion is high and vice versa. Another example is t h e azo dye E v a n s Blue (T1824), which has a very high affinity for albumin. At normal doses t h e free concentration is so low, t h a t it remains in t h e circulation for several days. Because of its very strong binding to plasma proteins, E v a n s Blue is used for t h e determination of plasma volume.
2. I n general, t h e concentration of a drug in a protein-deficient fluid like lymph will be equal t o t h e free concentration of t h e drug in plasma. Thus, there is a difference between t h e total plasma level a n d t h e concentration in lymph which m a y be great when t h e protein affinity is high. I n cases where large quantities of drug are bound to protein, determination of t h e plasma level can be misleading, as t h e activity of t h e drug is dependent upon t h e free drug concentration. Similar considerations often apply in t h e case of t h e cerebro- spinal fluid (CSF). Low concentrations of drugs in this fluid are not always a result of difficult passage of t h e blood-brain barrier b u t m a y be caused by protein binding in plasma. This is probably t h e case for t h e sulfonamides of Table VI. The concentration of these drugs in t h e cerebrospinal fluid is a b o u t t h e same as t h e concentration in plasma ultrafiltrate, i.e., as t h e free plasma concentration, b u t lower t h a n t h e t o t a l plasma level.
3. I n cases of strong binding and low free concentration it is possible t h a t this free concentration is still sufficient to give an effect. Then t h e protein functions as a drug storage depot. A typical example is phenylbutazone. The therapeutic plasma level of this drug is 50-150 mg/liter, b u t a t this level only a few per cent is free in solution (see Table VII) (12). A second example is dicumarol. At its therapeutic plasma level of 5-10 mg/liter, t h e free concen- tration is only 0.02 mg/liter (106).
Ι,Ι.Α. DRUG TRANSFERENCE: DISTRIBUTION 31 4. Heavy metals like mercury are strongly bound by the SH-groups of proteins, which give the protein a function in modifying toxic effects.
5. The absorption of a drug with a poor solubility in water, and therefore in the intestinal fluid, is favored when the drug is strongly bound. The free
T A B L E V I
CORRELATION BETWEEN C S F AND PLASMA ULTRAFILTRATE CONCENTRATION OF SOME SULFANILAMIDES"
Per cent of total plasma cone.
Drug CSF Plasma ultrafiltrate
Sulfanilamide ca. 80 ca. 80
Sulfapyridine 50-70 ca. 60
Sulfadiazine 40-60 ca. 45
Sulfathiazole ca. 20 20-30
Sulfamethylthiodiazole Trace
—
Sulfadimidine ca. 15 ca. 15
Sulfamerazine ca. 15 ca. 15
• See refs. (6, 31, 32, 59, 92).
concentration of the drug in plasma and lymph m a y then be so low that, in spite of the low solubility of the drug, a concentration gradient is maintained between intestinal fluid and extracellular fluid. Presumably, dicumarol is an
T A B L E V I I
UNBOUND DRUG AT DIFFERENT PLASMA LEVELS OF PHENYLBUTAZONE IN MAN"
Total drug Unbound drug (mg/liter) (mg/liter)
100 2 150 5 225 20 250 30
a From Brodie (12).
example of this mechanism. This drug is practically insoluble in water. Never
theless it is reasonably well absorbed when given orally. Probably as a result of its very strong adsorption by plasma proteins, the free concentration in the extracellular fluid is very low [see (3)].
32 G. A. J . VAN OS, E. J . ARIENS, AND A. M. SIMONIS
6. In certain special cases, plasma proteins serve as " vehicles " for transport of biologically important substances. An example is the transport of oxygen by hemoglobin, of F e3 + by transferrin and of C u2+ by ceruloplasmin (62a).
I.A.I.3.6. SOLUBILITY
While the influence of the solubility of a drug on the passage of barriers has been discussed in a previous section, another aspect of the solubility properties will be treated here, viz., the influence of these properties on the duration of the action of the drug.
I.A.I.3.δ (1) Drugs with Brief Action. The very brief action of some barbi
turates, for example thiopentone, was first attributed to their rapid metabolic
m g / k g ,
τ 1 1 ' 1 2 3 hours
FIG. 16. Thiopentone concentrations in various tissues after intravenous administration of 25 mg/kg to a dog. From Brodie (13).
degradation. I t was later found (13) t h a t in dogs after intravenous adminis
tration, thiopentone concentration in plasma and a number of organs showed an initial rapid decline while simultaneously the concentration in body fat rose to high values (Fig. 16). I t then follows t h a t the transient action of thio
pentone must be attributed to its high fat: water partition ratio. Immediately after administration the drug is dispersed, but by subsequent rapid dissolution and storage in body fat the concentration in the extracellular fluid and blood plasma drops. Thus, an effective free-drug-plasma level is present for a brief period only.
The same mechanism partially explains the brief action of an ether narcosis after a single administration. When a prolonged action is desired much more ether is required because the body fat has to be saturated. When this is accom
plished and no ether is lost (closed system), equilibrium is reached and no further administration of ether is necessary.
I. A. 1.3.b (2) Storage Depot Drugs. When a prolonged action is desired, use can
Ι,Ι.Α. DRUG TRANSFERENCE! DISTRIBUTION 33 be made of the solubility properties of a drug. The prolonged action of such substances is often based upon a delayed absorption. This can be reached in two ways:
a. By decreasing the water solubility. Examples are procaine-penicillin and protamine-zinc-insulin. In the first case the solubility of the acidic penicillin
solubility pH tissues
FIG. 17. Schematic representation of the solubility of insulin, protamine, and the insulin- protamine complex as a function of pH.
is lowered by coupling it to the basic compound, procaine. The insoluble com
plex is administered by intramuscular injection. I t is then only slowly absorbed and dispensed in the body fluids. I n the case of protamine-zinc-insulin, a similar result is obtained. Insulin is a protein with an isoelectric point of about 5. At this p H the insulin molecule is uncharged and practically insoluble (Fig. 17). At p H values below 5 the molecule becomes positively charged and more hydrophilic. This increased solubility also occurs when the p H rises above 5, but now because of a negative charge, Protamine, a basic protein, has
34 G. A. J. VAN OS, E. J. ARIENS, AND A. M. SIMONIS
similar properties, but here the isoelectric point is about 8. At a p H of 7.4, both proteins are oppositely charged and a reversible insoluble complex is formed.
After subcutaneous or intramuscular injection the insulin is slowly absorbed.
Sometimes it is possible to chemically modify molecules which form large crystals in order to convert them to a micro crystalline form. When an aqueous suspension of these microcrystals is given by subcutaneous or intramuscular injection, a deposit of solid particles is formed. Now the drug, because of its low solubility, will be slowly absorbed. The rate of absorption increases as the
T A B L E V I I I
INFLUENCE OF FATTY ACID ESTERS OF TESTOSTERONE UPON THE WEIGHT OF THE SEMINAL VESICLE OF CASTRATED RATS0-*
Ο — C — R
Time in weeks after injection
Ester of: R 0 1 2 3 4 5 6
Acetic acid —CH3 50 112 50 40 40
Propionic acid —CH 2 C H 3 50 150 240 190 50 62 Butyric acid —(CH2)2CH8 50 190 330 150 125 112 45 Valeric acid —(CH2)3CH3 50 200 575 440 440 450 200 Caproic acid - ( C H2)4C H3 50 150 550 750 500 300 200 Enanthic acid - ( C H2)5C H3 50 200 625 960 780 750 400 Caprylic acid —(CH2)eCH8 50 275 500 775 525 650 550
a After a single subcutaneous injection of 20 mg in 0.4 ml sesame oil. Weights in mg/1 OOgm.
* From Junkmann (43).
dimensions of the particles decrease. I n this case the storage characteristics of the drug will be dependent upon the size of the microcrystals.
b. By using a drug with a high oil: water partition ratio. When a solution of such a drug in oil is given by subcutaneous or intramuscular injection, a lipo
philic drug can only slowly be absorbed by the hydrophilic extracellular fluid.
In many cases it is possible to make a drug more lipophilic by modifying the molecule. This principle for instance, has been applied in practically all steroid hormones, by esterification of alcoholic OH-groups with a fatty acid.
The lipophilic character of a fatty acid, and therefore of the ester, increases with increasing length of the carbon chain. A demonstration of this effect is presented in Table V I I I (43). The weight of the seminal vesicle of castrated
Ι,Ι.Α. DRUG TRANSFERENCE: DISTRIBUTION 35
FIG. 18. Phosphoric acid ester of stilbestrol (Honvan).
the esterogenic action of stilbestrol will be especially prone to occur in prostate tissue where the phosphoric acid form of stilbestrol is split by the acid phos
phatase (91a).
I.A.I.3.C. CHELATION
A chelate can be formed when an organic molecule has two groups (ligands) present, with characteristics and position permitting them to bind a metal ion in a heterocyclic ring structure. (The name chelate is derived from the Greek word for claw.) The bonds between the ion and the groups of the organic molecule (the ligands) arise from the sharing of electron pairs. The most com
mon electron donating or electron sharing atoms in ligands are nitrogen, oxygen, and sulfur. Usually these chelate structures, in which the metal has lost its ionic character, have a high stability. Complexes between organic ligands and metal ions are known which have no ring structure but are never
theless very stable, for instance, the bond between some metals and sulfur.
In chelates and other stable complexes, most of the physical and chemical properties, and therefore the biological properties of the metal ion and the ligand molecule, are changed. Since the organic molecules in the organism contain many groups capable of forming chelates, di- and trivalent metal ions will easily be bound in stable chelate complexes. Therefore, chelation must be of importance with respect to the transport and distribution of these ions. To support this it should be mentioned t h a t a number of powerful chelating com
pounds have been synthetized in the last few decades, and some of these have proved to be of great therapeutic value.
I.A.I .3.c (1) Natural Chelating Agents. The distribution of several vital metals rats is shown in relation to the length of the carbon chain esterifying the tes
tosterone. With increasing chain length the depot character of the drug grows.
This results in an elevated testosterone blood level for a longer period and, therefore, there is a proportional increase in seminal vesicle weight.
In some cases the storage-depot character of a drug may depend on special properties of certain organs. An example is the uptake of iodine by the thyroid gland. This property is utilized in the therapeutic application of radioactive iodine in the treatment of hyperthyroidism. The great danger of the radioactive derivative of the element strontium (Sr9 0) is also the consequence of a special organ property, namely the uptake of S r90 by bone tissue, where it remains almost permanently stored. Another example is the use of a phosphoric acid ester of stilbestrol (Fig. 18). Prostate tissue is rich in acid phosphatase. Hence,