Vo l u m e 1 .
Editor: Zoltán Szalai
Programme
Rea
Reader g
Leadership Leadership MCC C
MCC Leadership Programme Reader
Vo l u m e 1 .
Editor: Zoltán Szalai
Editor: Zoltán Szalai Co-editor: Szilvia Dóra
This publication was released under project TÁMOP-4.2.2/B-10/1-2010-0028 titled „Cooperation for the talent management of the best”.
Preface ... 6
Gwyn Bevan | The search for a proportionate care law by formula funding in the English NHS ... 7
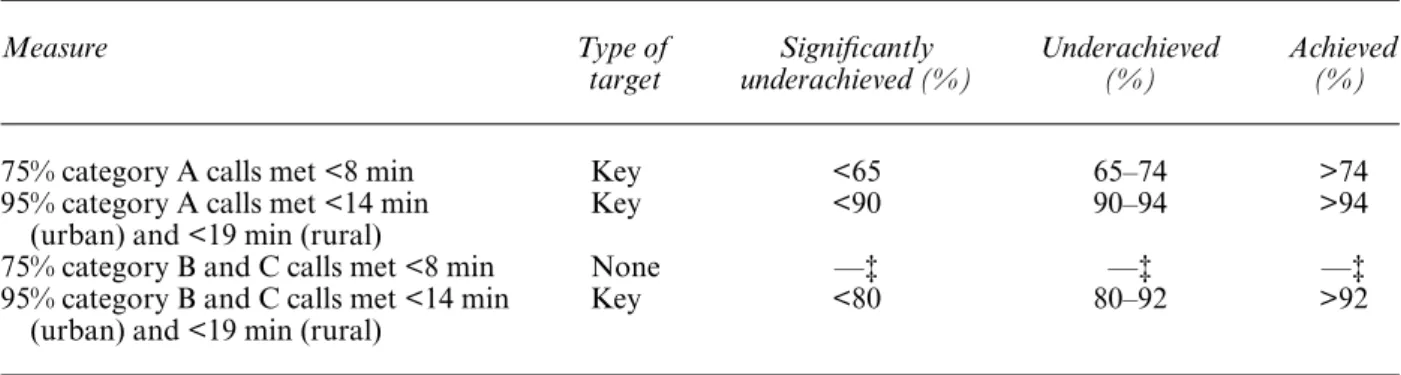
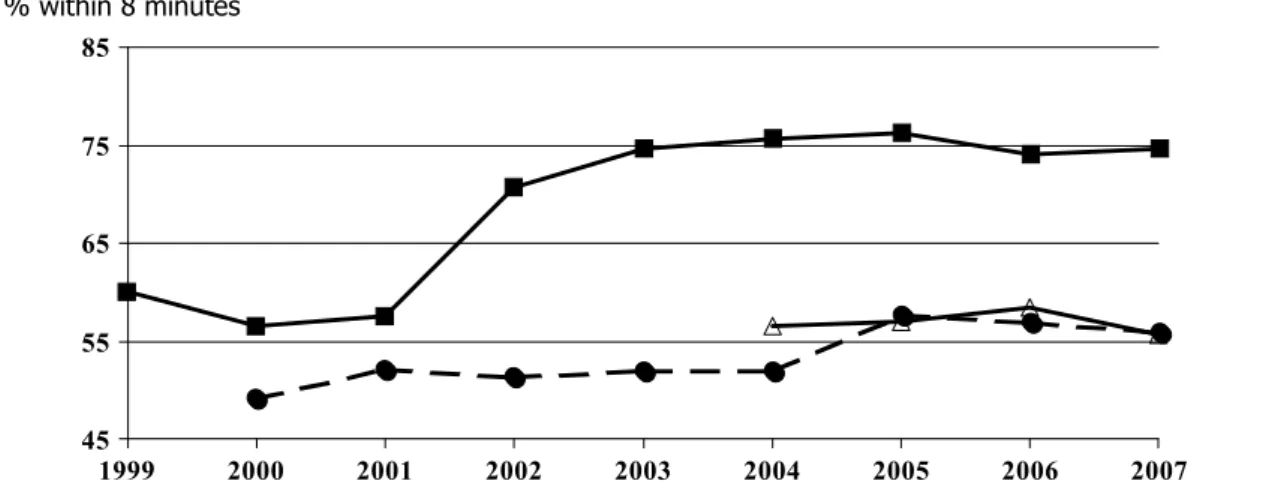
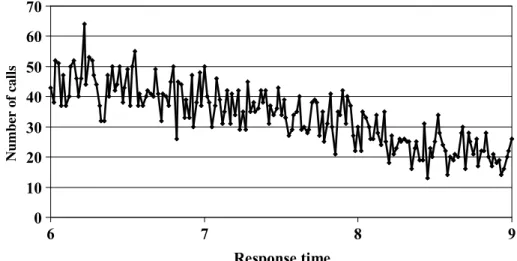
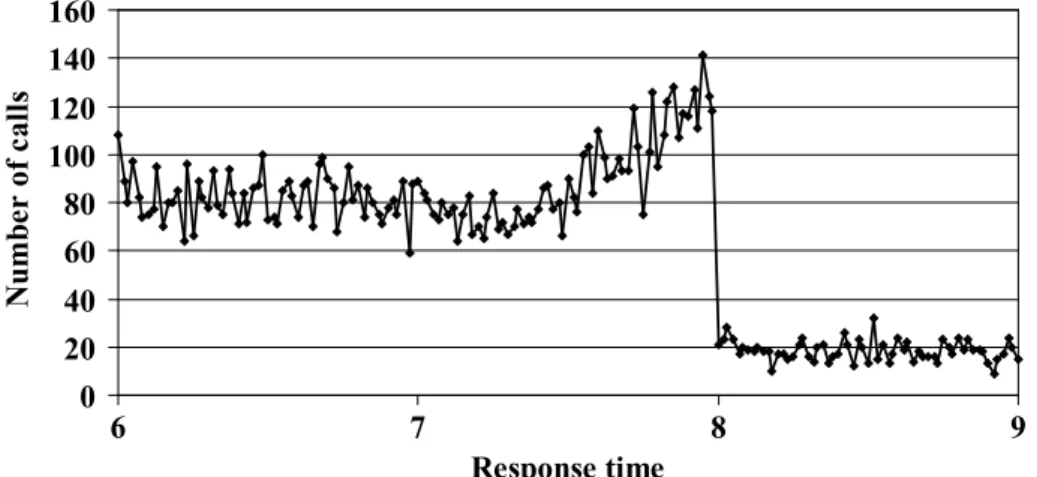
Gwyn Bevan, Richard Hamblin |Hitting and missing targets by ambulance services for emergency calls: effects of different systems of performance measurement within the UK ... 27
Gwyn Bevan, Wynand P. M. M. Van de Ven | Choice of providers and mutual healthcare purchasers: can the English National Health Service learn from the Dutch reforms? ... 57
Gwyn Bevan, Christopher Hood | What’s measured is what matters: Targets and gaming in the English public health care system ... 79
Joseph J. DiStefano, Martha Maznevski | Synergy From Individual Differences: Map, Bridge and Integrate (MBI) ... 101
Joseph J. DiStefano, Martha Maznevski | Culture in International Management: Mapping the Impact ... 105
Benoît Leleux, Ralf Seifert | Shape up your technology start-ups! Or how to avoid the most common management problems in earlystage, science-based companies. ... 109
Vladimir Pucik | Mergers and Acquisitions ... 113
David Venter | Beyonder leadership ... 131
L. A. A. Van den Berghe, Abigail Levrau | Evaluating Boards of Directors: what constitutes a good corporate board? ... 163
Richard E. Boyatzis, Ceferi Soler | Vision, leadership and emotional intelligence transforming family business ... 181
Merce Mach, Simon Dolan, Shay Tzafrir | The differential effect of team members’ trust on team performance: The mediation role of team cohesion... 189
Guido Stein | Challanges for New Managers ... 213
Yih-teen Lee | Global leadership in multicultural teams ... 225
First publications ... 243
MCC Leadership Programme Reader I Volume 1.
I Volume 1.
Preface
The Mathias Corvinus Collegium
The Mathias Corvinus Collegium (MCC) is a unique community of values, both in Hungary and in the world. The students of our institution are those who possess outstanding talent, and who, forming a dynamically developing team, are working on realising important and valuable goals. In our community, which consists of more than 500 members, you can fi nd students from almost all the ethnic groups and layers of the Carpathian Basin. This private institution was founded by András Tombor and Balázs Tombor more than fi fteen years ago. Since it was founded, the MCC has become Hungary’s best interdisciplinary educational institution, which is also acknowledged in Europe.
Among the teachers there are almost thirty internationally recognized foreign professors, an unparalleled number in our country. The MCC forms a community that can infl uence and shape both its im¬mediate environment and the future of the country in a progres¬sive and responsible way.
The MCC Leadership Programme
The aim of the Leadership Programme is to provide unique preparation, a view on the world, and an international way of thinking to the students. The programme is characterized by the educational standards and approaches of the highest ranking universities in the world. The internationally acknowledged professors offer real guidance in the globalized world, and the acquired knowledge means a solid basis for decisions made later. Our students become part of a relationship network and of a community that will stay with them throughout their careers. The solution- oriented, practical collection of tools and techniques acquired on the courses (such as case studies and simulation practices) provide a great competitive advantage to the participants of the programme.
After they have completed the Leadership Programme, not only can the students give outstanding performances in their own fi elds, but they will also be suited to leading working groups in which they can accomplish common goals with experts in different fi elds.
We would like to thank all our professors for the studies they contributed! The work they have done to assist us in realizing our continuing plan to help our students broaden and deepen their knowledge by providing them with the excellent works of most outstanding experts is tremendous. We believe that our fruitful cooperation will progress and we will be able to accomplish the goals of our program together!
MCC Leadership Programme Reader I Volume 1.
THE SEARCH FOR A PROPORTIONATE CARE LAW BY FORMULA FUNDING IN THE ENGLISH NHS
GWYN BEVAN∗
INTRODUCTION
The objective of creating the National Health Service (NHS) in the UK in 1948 was that access would depend on need and not be influenced by an individual’s ability to pay or where that individual happened to live (Bevan et al., 1980, pp. 30-31). Over 20 years later, however, Hart (1971) postulated the existence of an ‘inverse care law’ in the NHS, in which ‘the availability of good medical care tends to vary inversely with the need for it in the population served’. He argued that this was an inevitable consequence of a market arrangement in which access depends on ability to pay. This explains inequities in the distribution of supply of General Practitioners (GPs) and hospital services in the UK prior to the creation of the National Health Service (NHS), as identified by Aneurin Bevan, in 1946, in a speech in the House of Commons (Bevan, 1991), in opening the debate on the second reading of the NHS Bill. This also meant that creating a service free at the point of delivery would not create equity in access without also tackling the maldistributions in supply.
From the start of the NHS, Medical Practice Committees (MPCs) were empowered to prevent GPs moving into ‘over-doctored’ areas (classed as
‘restricted), but could not direct GPs to work in ‘under-doctored’ areas (classed as ‘designated’) (Webster, 1988; and Department of Health, 2000). There was significant initial progress: the percentage of the population in ‘designated’ areas reduced from 51% in 1952 to 19% by 1958 (Webster, 1996, p. 12). But, inequalities persisted between the north and south: in 1979, GPs in the north would on average have about 100 to 200 patients more on their lists than those in the south (Webster, 1996: p. 767). Studies have continued to document inequities
∗The author is Professor of Management Science at the London School of Economics and Political Science. This paper draws on a review for the Secretary of State for Health in England of the work of the Advisory Committee on Resource Allocation (ACRA), which focused on developments in formula funding over six years to 2005, but also put this in context of earlier developments. The Report and the Supplement to the Report (Bevan, 2008a and 2008b) give a fuller set of references than is possible in this paper. The views expressed are those of the author and not of the Department of Health or ACRA. The author is grateful for comments from two anonymous referees and the editors.
Address for correspondence:Gwyn Bevan, Professor of Management Science, Department of Management, London School of Economics & Political Science, Houghton Street, London WC2A 2AE, UK.
e-mail: R.G.Bevan@lse.ac.uk
C 2009 The Author(s)
I Volume 1.
in the distribution of GPs (Birch and Maynard, 1986; Bloor and Maynard, 1995;
Benzeval and Judge, 1996; Gravelle and Sutton, 2001; and Hann and Gravelle, 2004). Bevan and Charlton (1987) showed that there were inequities in the funding of GP’s General Medical Services and HCHS, and contrary to a popular view, high spending on the one did not compensate for low spending on the other.
Little was done to tackle inequities in the distribution of hospitals until after the 1974 reorganisation (Cooper and Culyer, 1971; Bevan et al., 1980; Mays and Bevan, 1987; and Department of Health, 1999a). That replaced a hierarchy organised around hospitals with one organised around health authorities. HAs were defined by geographical areas and responsible for both running services and planning to meet the needs of populations in their areas. This provided indicative statistical evidence of inequalities and an organisational basis for policies to reduce them (Mays and Bevan, 1987, pp. 23–25). (In this paper, HA is used to describe the various types of Health Authorities in successive reorganisations.)
The landmarkReport of the Resource Allocation Working Party(The RAWP Report) (Department of Health and Social Security, 1976) introduced a system of formula funding: that is funding populations with reference to formulas that aim to take account of populations’ needs and unavoidable costs of their providers.
This may be seen as the start of a search for a proportionate care law: so the distribution of medical care varies proportionately with need. The RAWP report laid the basis for principles used by UK countries ever since in seeking an equitable allocation of NHS resources to populations; and, as Smith (2007, p.12) observes:
took formula funding in the UK to a new level of intellectual coherence and sophistication, and have been highly influential internationally.
The formulas used for funding the NHS in England derive target allocations for each organisation as its estimated equitable share of the fixed annual national budget. The derivation of targets requires three elements to be developed:
estimates of populations, weighting these for relative need, and accounting for variations in unavoidable costs of providers. Policies on the pace of change of movement towards targets determine each year’s actual allocations.
This paper considers the developments of formula funding in England to develop a proportionate care law from the RAWP Report of 1976. The governments of England (Department of Health, 2008), Scotland (NHSScotland Resource Allocation Committee, 2007; and NHS National Services Scotland, 2009), Northern Ireland (Capitation Formula Review Group, 2004) and Wales (Townsend, 2001 and 2005) have produced recent reports on the bases of their different methods of formula funding. The methods used by the other UK countries are similar to that of England with two exceptions. First, although the governments of Scotland and Northern Ireland have followed England in developing an empirical basis for estimating needs; the government of Wales
MCC Leadership Programme Reader I Volume 1.
uniquely uses an ‘epidemiological approach’ that relies exclusively on survey data on morbidity (Morris et al., 2004, p. 34). Second, in taking account of unavoidable variations in provider costs there is virtually no provision for rurality in the English formula: the emergency ambulance cost adjustment has minimal impact (Bevan, 2008a, p.61). In Scotland, e.g., there has been a specific focus on the excess costs delivering services in remote and rural areas (Steering Group on the National Review of Resource Allocation, 2001, Chapter 4). In contrast to the effort expended on deciding NHS resource allocationwithin UK countries, the formula used for allocating growth in public expenditure between UK countries (the Barnett formula) uses ratios based on crude populations (Smith, 2007, pp.
141-42).
The rest of the paper is organized into five sections. The next section discusses the context of the development of formula funding in England: how equity is defined, provider incentives and budgetary management, governance and formula development. The following three sections review methods of estimating populations, weighting for need and accounting for variations in unavoidable costs of providers. In formula funding, weighting for age is vital (as the demographic composition of areas varies enormously) but weighting for sex is of marginal importance (although needs of the sexes differ, their composition varies little across areas). The major focus in England has been on accounting for need additional to that for age from empirical analyses of data on utilisation (Bevan, 2008b, pp. 7-11). The final section concludes by outlining continuing problems and new challenges in formula funding.
CONTEXT OF THE DEVELOPMENT OF FORMULA FUNDING IN ENGLAND
Defining Equity
Although the underlying purpose of formula funding is to improve ‘equity’, there is less clarity of what kind of equity ought to be sought (Mooney, 1994, pp. 69–
84). The RAWP Report interpreted the underlying objective of its terms of reference to be ‘to secure through resource allocation equal opportunity of access for people at equal risk’ (Department of Health and Social Security, 1976, p. 7).
This was, until 1999, seen as the bedrock principle against which all methods of developing capitation formulas ought to be judged. In practice, however, the objective of these formulas was to equalise spend per capita adjusted for estimated unavoidable variations in provider cost and relative risk. This objective does not, of itself, correct inequities in access due to age, social class, or ethnicity in seeking care when ill, or discrimination by providers on grounds other than clinical need. By 1997, resources for the NHS in England had been allocated for 20 years with reference to successive formulas. The outcomes were that, for the year 1999-2000, for the then 100 HAs in England, 97 were within six per cent
I Volume 1.
of their targets (Department of Health, 1998a). So, in the sense in which equity had been sought from the time of the RAWP Report, this was close to being achieved. But, the incoming Labour Government was troubled by inequities in health outcomes, and, in 1999, the Minister of State for Health (Denham, 1999) added another objective to resource allocation formulas: ‘to contribute to the reduction in avoidable health inequalities’. So far little progress has been made in framing an adequate approach to achieve this. This problem is considered in the final section of this paper.
Incentives and Managing Demand
The RAWP Report’s interpretation of its terms of reference ignored provider efficiency, because it was not possible to pursue both equity and efficiency with one policy instrument: HAs could be funded to seek either equity or provider efficiency but not both. One problem with the RAWP formula was that it applied to catchment populations (Bevan and Ingram, 1987) and its method of accounting for cross-boundary flows produced bizarre financial incentives: a HA could improve its target position by giving priority in its own hospitals to patients from other HAs (Bevan and Brazier, 1987). The NHS reform, implemented from 1991, of an internal market with a purchaser/provider split (Secretaries of State for Health, Wales, Northern Ireland and Scotland, 1989), in principle, introduced a second policy instrument to achieve efficiency through provider competition:
health authorities, funded to achieve equity, would contract with competing providers (Bevan and Robinson, 2005). In these reforms, NHS providers became NHS trusts independent of health authorities, which meant that HAs were funded for their resident populations and formulas no longer had to take account of cross-boundary flows and their bizarre incentives were removed (Bevan and Robinson, 2005). Health authorities faced the problem, however, both before and after the introduction of the internal market, of being funded for their population’s use of services, with minimal control over their demand, as this was determined collegially by GPs and hospital doctors (Tuohy, 1999; and Bevan and Robinson, 2005).
GP fundholding, an innovation of the internal market, was a limited attempt to enable GPs, who opted for this, to manage demand against budgets as small scale purchasers (for populations typically of about 10,000 for GP prescribing and hospital diagnostic and elective care) (Secretaries of State for Health, Wales, Northern Ireland and Scotland, 1989; and Bevan and Robinson, 2005).
There was criticism that this created a ‘two-tier’ NHS: with patients of GP fundholders’ having been treated more quickly than patients from non- fundholding GPs in the same authority; and suspicions that GP fundholders had been funded more generously than health authorities. GP fundholding thus revealed concerns over two different kinds of equity (Bevan 1998): clinical equity, which is achieved when clinicians decide when patients are to be treated
MCC Leadership Programme Reader I Volume 1.
on grounds of clinical priority only; and financial equity, which is achieved when purchasers are allocated equal levels of resources per capita taking account of the relative risk of their populations. Bevan (1998) argued that, with the well-documented variations in GP referral rates, it is not possible to achieve both kinds of equity and the objective ought to be to secure financial equity.
Following the election of the Labour Government in 1997, fundholding was abolished and, from 1998, new Primary Care Groups (PCGs) were created, initially as subcommittees of health authorities, with the objective of involving GPs in commissioning services for local patients and thus extending ‘to all patients the benefits, but not the disadvantages, of fundholding’ (Secretary of State for Health, 1997, p. 37). Klein (1998) described these changes as either the phasing out, or universalising, of the idea of GP fundholding. PCGs became Primary Care Trusts (PCTs) (currently about 150), which in effect replaced health authorities. One consequence of these changes was that, from April 1999, formula funding applied to all local NHS spending (on primary care and HCHS) in unified allocations (Department of Health, 1998a).
The objective of extending the benefits of fundholding to PCGs and PCTs was always going to prove problematic, because of two vital differences. First, GP fundholding was typically small scale and based on general practices run by GPs, but PCGs and PCTs were large bureaucratic organisations. Second, GPs had a choice over whether to opt to become fundholders or not and one in three practices was involved in fundholding in 1995/96 (Audit Commission, 1996). GPs had no choice over whether they wanted to belong to PCGs and PCTs, and were allocated to these organisations on a geographical basis.
From 2002, the government introduced a package of system reforms on the demand and supply sides ‘to introduce stronger incentives to ensure the extra cash produces improved performance’ (Secretary of State for Health, 2002, p.4;
and Audit Commission and Healthcare Commission, 2008). There were three changes with impacts on the policy of formula funding. First, the idea of GP fundholding re-emerged by involving GPs in ‘Practice-Based Commissioning’
(PBC) from 2005 (official recognition of the failure of PCTs to involve GPs in managing demand). PBC devolves indicative budgets to general practices, and aims to encourage GPs and other primary care professionals to manage referrals and to commission and redesign services in a way that is more cost-effective and convenient for patients. Second, an activity-based funding system (‘Payment by Results’ – PbR) was implemented for hospitals, which aims to take account of case mix so that ‘money follows the patient’. Third, in a new contract, GPs in addition to a capitation element (based on patients registered with general practices) are paid extra for achieving quality targets as measured by the Quality and Outcomes Framework (QoF). PbR and QoF generate strong financial incentives for hospitals to increase the number and complexity of their cases and GPs to improve quality of care. These payment systems mean that PCTs have to find
I Volume 1.
ways of managing the volume of demand for hospital care: PCTs’ allocations are determined with reference to a formula and are cash-limited, they have to pay GPs for performing against national contracts, and PbR determines the prices PCTs pay for hospital services.
GOVERNANCE AND FORMULA DEVELOPMENT
From the RAWP Report of 1976, until the creation of standing advisory groups on resource allocation in 1995, there were three reviews of the funding formula. The first review (Department of Health and Social Security, 1980), was curtailed, recommended minimal changes, but provided the rationale for two innovations: funding of high-cost clinical services serving a number of regions and developed the idea and method of accounting for geographical variations in staff costs – the staff Market Forces Factor (MFF). The second and third reviews derived estimates for additional need from empirical analyses of the relationships between small-area variations in hospital admission rates and proxies of need (mortality and census data). The second review produced official Reports (Department of Health and Social Security, 1986 and 1988). The third review did not: there was only a Report from the research team at the University of York that estimated new weightings for need for hospital services (Carr-Hill et al., 1994a). The Government argued that, as these weightings were derived for hospital services only, this justified the unprecedented change of applying no weighting for need for most community and other health services (24 per cent of HCHS expenditure). This decision limited the scale of the redistribution to favour Conservative constituencies and was heavily criticised (Health Select Committee, 1996, p. xviii; and Carr-Hill et al., 1997).
In what looks to be a response to the lacunae in governance identified by those criticisms, the Government established for the first time, in 1995, two standing advisory groups for the governance and development of formula funding: the Resource Allocation Group (RAG) on policy issues (NHS Executive, 1996 and 1997), and the Technical Advisory Group (TAG) on technical issues.
RAG was charged with developing needs indices for the 24 per cent of NHS expenditure that had not been weighted for need and did so for allocations from 1997/98 (NHS Executive, 1997). In September 1997, RAG was replaced by the Advisory Committee on Resource Allocation (ACRA) (NHS Executive, 1999). The deliberations of these committees are confidential: there is no formal consultation as in Scotland (Mulholland and Granville, 2006), Wales (National Assembly for Wales, 2001), and Northern Ireland (Capitation Formula Review Group, 2004, p. 8). Bevan (2008a: p. 74) suggested following New Zealand’s process of regular five-yearly review that would begin with consultation with the NHS.
The following sections review methods for estimating populations, weighting for need and accounting for variations in the ‘unavoidable’ costs of providers.
MCC Leadership Programme Reader I Volume 1.
ACCOUNTING FOR POPULATIONS
Population Data
Formula funding requires sound estimates of populations for which there are two sources: decennial censuses of geographically-defined areas by the Office of National Statistics (ONS); and lists of patients registered with GPs, which offer natural building blocks for formula funding, as they define populations for which clinicians make decisions on use of health care resources – all other definitions are administrative artefacts (Bevan, 2008b, pp. 4–6). Prisoners and armed forces personnel are included in ONS estimates and entitled to use HCHS;
but they are not registered with GPs and do not make use of their services.
After accounting for these known differences, however, estimates of populations on registered lists typically exceed those derived from censuses, hence this is known as ‘list inflation’. This shorthand term is, however, misleading as it implies that only the registered lists are in error, but the census also faces problems of under-counting (Simpson and Dorling, 1994). The effect of the difference between the two estimates for one London PCT was over £50m in its target (Department of Health, 2007a, p. 108). Little has been done to meet the fundamental requirement of securing reliable data on populations and no single body is responsible for this.
Formula Funding of General Practices
An evaluation of the extension of GP fundholding, in principle to cover all HCHS, in about 50 ‘Total Purchasing Pilots (TPPs)’ found that GPs were more involved in managing budgets in TPPs that were single practices than in TPPs that consisted of larger networks (Baxter et al., 2000; and Bevan et al., 2001). But applying formula funding at the level of general practices encounters two problems.
First, the ‘attribution problem’, which arises in using data on wards from censuses for practice populations to estimate additional need, when the people living in the same ward choose to be registered in different practices. The convention is to attribute the total needs weighting of a ward to the practices serving that ward in proportion to the practices’ share of the ward population, which assumes a random allocation of needs to practices (Department of Health, 1998b). If that assumption does not hold, then serious errors can arise, as it has been consistently found that the most expensive five per cent of the population account for 60 per cent of total expenditure on health services. The problem is illustrated by Figure 1, derived from hospital expenditure in the Netherlands (Lamers and van Vliet, 1996), which gives: the percentages of the populations that account for the top one, five, ten and 25 per cent of expenditure; and what the (much lower) estimated expenditure would have been based on using average spend by age and sex (data available directly at practice level). One solution to the attribution problem is to develop estimates of need from data on utilisation
I Volume 1.
Figure 1
Actual and Estimated Spend by Age and Sex
Source: Lamers and van Liet (1996).
of services at the individual level, and this research has been commissioned to offer a sounder basis for applying formulas to PBC, Bevan (2008a, p. 41).
Second, at practice level, because of the small population, a target will be unreliable and have large margins of error: we can expect estimates for a third of practices to have errors of estimation greater than ten per cent (Martin et al., 1997, p.11). A rule of thumb is that formulas become reliable for about 30,000 patient years. One way of tackling this problem is by allocating budgets over a number of years: e.g., for a practice of 10,000 over a three-year period.
WEIGHTING FOR RELATIVE NEED
Demography
The RAWP Report recommended weighting for demography (age and sex) using national average rates of utilisation, which has been relatively uncontroversial. It was followed until the derivation of a combined weighting for age and additional needs (Morris et al., 2007). An issue with using national average rates of utilisation is that patients may be denied the treatment they need because they are too old (Challah et al., 1984; and Bowling, 1999).
MCC Leadership Programme Reader I Volume 1.
Using Mortality Data
The approach of the RAWP report to accounting for additional need is characterised by elegant economy based on a heroic assumption: using (mainly) the ratio of actual to expected mortality in the form of Standardised Mortality Ratios (SMRs) with a weight of one: i.e. assuming that a health authority with e.g., ten per cent higher (lower) mortality than expected ought to receive ten per cent more (less) resources. This method was applied from 1977/78 to 1990/91.
There are good reasons for the RAWP Report using mortality data as the best proxy measure of additional need in populations. Mortality data are a good measure of the cumulative social and health experience of people living in an area and a sensitive indicator of general health care needs; reliable, accurate and routinely available and provide a more timely indicator of relative need than indices derived from Census data; and independent of supply of, and access to, services (Mays, 1987; Mays and Bevan, 1987; and Sheldon et al., 1993). But many questions have been raised over the use of mortality data in formulas for allocating resources, for example (Mays and Bevan, 1987):
i. For which services is mortality a good measure of morbidity: is it only relevant for acute diseases?
ii. Mortality is focused on morbidity: to what extent do mortality data capture extra needs for health care of deprived populations?
iii. Where mortality is a good measure of morbidity, although the SMR is a popular index, is it the most appropriate?
iv. If the SMR is used what age range should be used? And if the SMR is based on a restricted age range (under 75), then should it, nonetheless, be applied to the whole population?
v. What weight should be used for the chosen mortality index?
vi. For what proportion of morbidity is there effective treatment and therefore ought resources be made available?
Answers to the first two questions are that mortality data are a sensitive indicator of relative need and strongly correlated with all other measures. But other indices have been preferred to the SMR (Mays and Bevan, 1987): in Portugal, age-specific SMRs were better (Oliviera and Bevan, 2003); and in Scotland, the Comparative Mortality Factor (CMF) is preferred (Social Disadvantage Research Centre, 2003, pp. 55-57).
The next subsection discusses attempts to offer a solution to all but the last question by examination of the empirical relationships between actual utilisation of services and indicators of morbidity and material deprivation. To be able to answer the last question requires a quite different approach, of developing a normative formula from the bottom up, which is discussed later in this section.
I Volume 1.
Using Empirical Analyses of Utilisation
There have been four different attempts to estimate weighting for needs from empirical relationships between actual utilisation of services and indicators of morbidity and material deprivation. These were based on the following Reports:
•Review of the Resource Allocation Working Party Formula (the RoR Study:
Department of Health and Social Security, London, 1988; see also Royston et al., 1992). This developed a model for non-psychiatric acute services only that was used from 1988 to 1996 (see e.g., NHS Executive, 1991, Section 2.3).
•A Formula for Distributing NHS Revenues Based on Small Area Use of Hospital Beds (the York Study: Carr-Hill et al., 1994a; see also Carr-Hill et al., 1994b;
and Smith et al., 1994). This developed two models (for general and acute, and psychiatric acute services) that were used from 1997 to 2003 (see e.g., NHS Executive, 1994, pp. 7-11).
•Allocation of Resources to English Areas(the AREA study: Sutton et al., 2002;
see also Gravelle et al., 2003; and Morris et al., 2005). This developed three models (for acute and maternity, mental health, and prescribing) that were used from 2004 to 2008 (see e.g., Department of Health, 2003, pp. 18-34).
•Combining Age Related and Additional Needs (CARAN) Report (the CARAN study: Morris et al., 2007). This developed three models (for acute services, maternity services, and prescribing) that were used in 2009 (see e.g., Department of Health, 2008, pp. 29-35 and 50-52).
Any study that seeks to estimate needs for health care from data on utilisation, however sophisticated the methods, encounters serious limitations with data and severe methodological difficulties (Bevan, 2008a, pp. 16-17; and Stone and Galbraith, 2006):
•The ecological fallacy: when an effect detected at aggregate level of analysis does not exist at individual level. This is at the heart of the attribution problem because we can only link census data to hospital utilisation data at the small-area level.
•Data availability on utilisation of services are best for non-psychiatric acute hospital admissions; it is difficult to derive indicators of need from data on utilisation of other services (Morris et al., 2007).
•Endogeneity between variables measuring supply and need: as Grossman (1972) pointed out, there is a two-way interaction between sickness and use of health care; sickness will have an impact on use of hospitals, and vice- versa. The York study criticised the RoR study for estimating weightings using the technique of ordinary least squares and used the traditional solution to this problem of estimation by two-stage least squares. But this solution was not used by the AREA study, as it requires variables that are
MCC Leadership Programme Reader I Volume 1.
hard to find (as they ought to be correlated with supply but not with the unobserved needs variables).
•Medical practice variations and inappropriate treatment: studies in the UK and the US have found correlations between variations in admission rates in the aggregate and generic social indicators. In contrast other studies of specific conditions and procedures have revealed variations in rates of treatment which, it is consistently argued, cannot be explained by differences in need and are attributed to variations in medical practice. Studies have also found high levels of inappropriate care. The evidence of variations in medical practice and levels of inappropriateness indicate that current practice can be very different from what ought to be provided.
•Relational distance (Black,1970), patients who are well educated and articulate are relationally close to the GPs and hospital doctors and tend to be more skilled users of ‘free’ services than those who are not. Hence data may show that those who are materially deprived do indeed make heavier use of services, but this may still be an underestimate of their need (Asthana et al., 2004).
The York Study was criticised for omitting variables that measured health (Asthana et al., 2004). The subsequent AREA study did include such variables.
Stone and Galbraith (2006) criticised both studies for estimating needs by weighting first for age and then for additional needs. The latest CARAN study (Morris et al., 2007) produced simultaneous estimates of weighting for age and morbidity (hence its title: Combining Age Related and Additional Needs). Stone and Galbraith (2006) questioned whether the models of the York and AREA studies were well specified and whether the results were replicable. Using later data, the AREA study was unable to replicate the York model for acute services (Sutton et al., 2002, pp.101-2) and the CARAN study to replicate the AREA models (Morris et al., 2007, pp 80-87). Differences in estimates of coefficients of needs variables from different datasets, do not, however, necessarily mean that the different formulas produce material differences in the estimation of targets;
this is because the variables used as proxies for needs in all these models are correlated.
One way of examining consistency of the different models, in terms of estimation of targets, is to examine relationships between each model’s index for additional need for acute services (for which all models have produced estimates) and the two mortality indices that have been used: the SMR for under seventy- fives (SMR < 75: York and AREA studies) and the CMF for under sixty-fives (CMF64: AREA and CARAN studies). Table 1 gives, for the different studies, the estimates of the weight on these two mortality indices from their estimates of additional needs for acute services (coefficient derived by regression analysis).1 For the SMR < 75, the AREA study (0.83) gave greater weight than the York study (0.67), and hence implies an increased distribution of resources to poor
I Volume 1.
Table 1
Results of Regressing Composite Acute Additional Needs Indices Against Two Mortality Indices
Estimates of Coefficient on Mortality Index Model Estimate of Mortality
Acute Needs Index Index Allocations Mean Lower 95% Upper 95%
York (1) SMR<75 2002-03: 95 health 0.71 0.67 0.75
authorities
AREA (2) SMR<75 2007-08: 303 PCTs 0.83 0.79 0.86
AREA (2) CMF64 2007-08: 303 PCTs 0.76 0.73 0.79
CARAN (3) CMF64 2008-09: 152 PCTs 0.40 0.37 0.44
Sources: 1. Department of Health (2002); 2. Department of Health (2007b); 3. Department of Health (2009).
areas. For the CMF64, the CARAN study (0.40) gave much lesser weight than the AREA study (0.76), and hence implies a reduced distribution of resources to poor areas. This range of weights on the mortality indices may be compared with those of the RAWP Reports (1.0 for all-age SMR) and RoR’s (0.44 for SMR<75).
These differing outcomes from twenty years’ empirical work suggest that greater sophistication is not resulting in a converging basis for estimating the weighting for needs.
Sheldon and Carr-Hill (1992, p. 412) observed that the RAWP Report ruled out deriving estimates of need from data on utilisation because of the problem of disentangling hospital use from supply factors and argued that a general weakness of any regression analysis is that ‘even the use of simultaneous modelling techniques cannot deal adequately with a system where demand, utilisation and supply are so inextricably intertwined’. The stumbling block encountered by all empirical methods is seeking to estimate what ought to be from what is (Sheldon et al., 1993; and Mays, 1995), so that we avoid perpetuating underlying inequities. Whatever empirical approach is used to estimate variations in need relies on proxy (and not direct) estimates and is hence ‘essentially contested’:
i.e. concepts the proper use of which inevitably involves endless disputes about their proper uses on the part of their users (Gallie, 1955-6, p. 169).
This is because the only way of resolving the dispute would be to produce direct evidence of relative need, but if we had that direct evidence we would not have to rely on proxies.
Normative Alternatives to Empirical Methods
Stone and Galbraith (2006) and Asthana et al. (2004) have argued for a normative approach in which formulas are derived from the bottom up using
MCC Leadership Programme Reader I Volume 1.
estimates of need for health care. But, to do so requires basic epidemiological data on local rates of prevalence (of chronic conditions) or incidence (of acute conditions) with information on severity so that needs for cost-effective care can be estimated (see, for example, Hollinghurst et al., 2000; and Bevan et al., 2007). (Work commissioned by ACRA in 2007, led by Sheena Asthana from the University of Plymouth on developing a bottom-up approach, suggests that this can be for done for mental health (Bevan, 2008a, p. 18)). If it were possible to develop a normative basis for resource allocation from the bottom up, this would, however, create a new set of problems: it is likely that the costs of what was
‘needed’ would exceed the available funding, and so explicit rationing decisions would be required that denied care to those who ‘needed’ it according to the formula.
Sheldon (1997) argued for a return to RAWP’s approach of elegant economy based on a heroic assumption:
The empirical work over the past years seems to have validated the original idea of the Resource Allocation Working Party to use a measure of the death rate as an indicator of relative need. There are no unique and valid indicators of health care need, and, no matter how sophisticated the analysis, research based on the use of services tends to underestimate the effect of poverty because the middle classes are better at accessing health services. As a result of this, a similar result could be produced by basing a formula simply on population size and age, weighted by the under 75 year standardised mortality ratio.
Sheldon made that argument after having been a member of the research team of the York Study, when it appeared that its more sophisticated approach (to that of the RoR study) had validated the RAWP assumption of a weight of one on the SMR (the above analysis of the York Study indicates a weight of 0.7).
The approach that Sheldon advocates offers rough justice, is transparent and based on mortality data with its many virtues (as described above). A difficulty now, however, is that later sophisticated empirical studies have indicated a wide range of values for the weight to be placed on a mortality index.
ACCOUNTING FOR UNAVOIDABLE VARIATIONS IN COSTS
In London, employers pay ‘London weighting’ in some recognition of the higher living costs, but that still means that similar occupations have higher rates of pay in other sectors, with recruitment problems for generic staff (e.g., secretaries).
These problems also arise for nursing and other specialist staff, which suggests that these ‘are mobile geographically within the NHS and the compensation of London weighting is insufficient to overcome the preference to live/work elsewhere’ (NHS Executive 1996, p.15). The staff MFF aims to fund these effects of labour market forces. There are two ways of estimating the staff MFF.
One is the specific cost approach, based on analysing actual variations in costs between NHS organisations in different areas (Crilly et al., 2007). But, as this
I Volume 1.
approach does not indicate whether these extra costs are avoidable, all estimates of the staff MFF have been derived from the alternative general labour market approach (Bevan, 2008b, pp. 12–15), which is based on analysing variations in costs in other labour markets (Elliott et al., 2005). This approach is open to criticisms that general labour market indicators do not adequately proxy the additional (unavoidable) costs faced by NHS providers in different parts of the country, and that NHS labour is less mobile geographically than other types of labour in different occupations (Department of Health, 1999b).
Using formula funding of populations to account for variations in provider costs results in a convoluted method (Department of Health, 2008, pp. 41-48).
The estimates of MFF zones are ‘smoothed’ to address the problem of differences between PCTs, known as ‘cliff edges’; which results in ‘cliff edges’ between providers (NHS Executive, 1996, pp. 16–17; Health Select Committee, 1996, p. xxxi), which are then reduced by ‘interpolation’. It would be more straightfor- ward to produce MFF estimates by provider, and for this to be part of determining PbR payments rather than formula funding. But if that change were to be made, two other issues would continue to pose problems.
First, as the RAG Report (NHS Executive 1997, p. 11) highlighted, the MFF has an asymmetrical impact. Initially the MFF covered the London and the South East only. The 1996 RAG Report observed that this was inadequate, as variations in labour markets also applied in the rest of England (NHS Executive 1996, p. 15). But extending the MFF to cover the whole of England created the problem for areas (in particular Cornwall) where local rates of pay were (and still are) lower than NHS national rates. The Report observed:
Whilst these [HAs] should enjoy some benefits e.g., better quality staff, this is unlikely to be sufficient to offset having allocations that reflect a going rate they cannot pay.
RAG suggested that a possible approach to this problem would be to determine a cut-off point where NHS rates are deemed to equate to the going rate. But the policy was not to do this, with consequent reductions in target allocations for areas with MFF below national average costs.
Second, hospitals follow national rates of pay for nursing staff and hence encounter the problems of recruitment that the staff MFF is intended to overcome. Burgess et al. (2003) found a clear regional divide in hospital performance ratings (published in 2001 and 2002) which was inversely related to relative labour costs: i.e. performance was better in the regions with low labour costs. Hall et al. (2008) found that hospitals paying nurses national rates of pay in areas with high labour costs had to rely disproportionately on temporary agency staff, which was associated with worse health outcomes: a 10% increase in the outside wage was associated with a 4% to 8% increase in death rates for acute myocardial within thirty days of emergency admission. Besley and Ghatak (2003, p. 12) identify a particular difficulty in accounting for variations in labour costs. They argue that:
MCC Leadership Programme Reader I Volume 1.
A system of organization and remuneration for the provision for public goods will have to take into account not only how on-the-job incentives affect how those in the sector work, but also who is attracted to work there.
The problem is that, e.g., nurses who work in hospitals in London will face the same living costs, but the elite teaching hospitals will be able to attract the better quality of staff.
OLD PROBLEMS AND NEW CHALLENGES IN FORMULA FUNDING
The search for proportionate care by formula funding over 30 years in England shows that there is no perfect formula. Formulas can only offer rough justice.
From 1976 there have been repeated examinations of the problems of accounting for populations, need and unavoidable variations in provider costs, but the outcomes seem to be better understanding of the problems. We still lack reliable data on populations. Twenty years of successively more sophisticated methods of empirical analysis do not promise convergence in accounting for need. The MFF ought to be estimated directly for providers as part of PbR, but that still poses problems given national rates of pay.
A fundamental issue raised by formula funding of organisations is that they ought to be able to control their populations’ use of services. To do this, it is vital to involve GPs in the process of managing demand. This requires developing methods that can estimate needs by individuals (rather than by small areas) with accurate data on practice populations (hence resolving the problem of ‘list inflation’). But there are intrinsic tensions in formula funding, as it appears it is easiest to involve GPs in budgeting at the level of practices where any formula will have a large margin of error.
Finally, the new objective, of reducing ‘avoidable’ inequalities in health implies a new perspective. At the time of the RAWP Report it could be argued that giving more funding to areas with high mortality rates did not generate perverse incentives, as there was only a weak relationship between spend on health care and mortality. Indeed that seems sadly to have proved correct over the last 30 years: resources have been redistributed according to a proportionate care law in relation to mortality rates (as they are so strongly correlated with the various indices that have been used), and this has not reduced inequalities in mortality rates. Hence, if an element of formula funding is to reduce ‘avoidable’ health inequalities, we need a different approach: it seems wrong, for example, either to continue extra funding if high mortality rates were to increase; or to reduce funding if high mortality rates were to reduce, if by doing so would only mean that mortality rates would increase again. This suggests developing a method to take account of need and performance; and requires a much deeper understanding of the relationships between funding, need for, and outcomes of, health care than was deemed necessary thirty years ago.
I Volume 1.
NOTE
1 For the York study (Department of Health, 2002, Table 5.6), the indices for additional acute needs and mortality were given in Columns F (acute needs) and D (SMR<75). For the AREA study (Department of Health, 2007b, Table 4b.4), the index for additional acute needs was derived by dividing weighted populations (acute and maternity needs: Column M) by crude populations (Column A); the mortality indices were given in Table 4b.7 Column P (CMF64) and Column F (SMR<75). For the CARAN study (Department of Health, 2009, Table 9), the index for additional acute needs was derived by estimating age-weighted populations using responsible population by age group (Columns AP to BG) and spend per capita by age group (Row 4 of Columns DT to EK), and dividing the acute needs weight by the age-weighted populations (acute needs weight populations: Column FI); the mortality index was given in Column BV (CMF64).
REFERENCES
Asthana, S. et al. (2004), ‘The Pursuit of Equity in NHS Resource Allocation: Should Morbidity Replace Utilisation as the Basis for Setting Health Care Capitations?’ Social Science and Medicine, Vol. 58, pp. 539–51.
Audit Commission (1996), What the Doctor Ordered. A Study of GP Fundholders in England and Wales (HMSO, London).
——— and Healthcare Commission (2008), Is the Treatment Working? (Audit Commission, London, <www.audit-commission.gov.uk/reports/NATIONAL-REPORT.asp?CategoryID=&
ProdID=9F8B7F6A-214D-4165-BE65-716315270A82&fromREPORTSANDDATA=NATIONAL- REPORT>).
Baxter, K. et al. (2000), ‘Primary Care Groups: Trade-offs in Managing Budgets and Risks’,Public Money and Management, Vol. 20, No. 1, pp. 53–62.
Benzeval M. and K. Judge (1996), ‘Access to Health Care in England: Continuing Inequalities in the Distribution of GPs’,Journal of Public Health, Vol. 18, No. 1, pp. 33–40.
Besley, T. and M. Ghatak (2003), ‘Incentives, Choice, and Accountability in the Provision of Public Services’,Oxford Review of Economic Policy, Vol. 19, pp. 235–49.
Bevan, A. (1991), ‘House of Commons, 30 April, 1946’, in C. Webster (ed.), Aneurin Bevan on the National Health Service(Wellcome Unit for the History of Medicine, Oxford).
Bevan, G. (1997),Resource Allocation within Health Authorities: Lessons from Total Purchasing Pilots(King’s Fund Publishing: London).
——— (1998), ‘Taking Equity Seriously: A Dilemma for Government from Allocating Resources to Primary Care Groups’,BMJ, Vol. 316, pp. 39–42.
——— (2008a), Review of the Weighted Capitation Formula, A report submitted to the Secretary of State for Health [RARP 33] (Department of Health, London, <http://www.dh.gov.uk/
en/Managingyourorganisation/Financeandplanning/Allocations/DH 4108515>).
——— (2008b), Supplement to the Review of the Weighted Capitation Formula [Supplement to RARP 33] (Department of Health, London,<http://www.dh.gov.uk/en/Managingyourorganisation/
Financeandplanning/Allocations/DH 4108515>).
——— and J. Brazier (1987), ‘Reviewing RAWP - Financial Incentives of Subregional RAWP’,BMJ, Vol. 295, pp. 836–38.
——— and J. Charlton (1987), ‘Making Access to Health Care More Equal: The Role of General Medical Services’,BMJ, Vol. 295, pp. 764–67.
——— and R. Ingram (1987), ‘Reviewing RAWP – Variations in Admission Rates: Implications for Equitable Allocation of Resources’,BMJ, Vol. 295, pp. 1039–42.
——— and R. Robinson (2005), ‘The Interplay Between Economic and Political Logics: Path Dependency in Health Care in England’,Journal of Health Politics Policy and Law, Vol. 30, Nos 1–2, pp. 53–78.
——— et al. (1980),Health Care: Priorities and Management(Croom Helm, London).
——— et al. (2001), ‘Managing Budgets and Risk’, in N. Mays et al.,The Purchasing of Health Care by Primary Care Organisations. An Evaluation and Guide to Future Policy(Open University Press, Buckingham).
MCC Leadership Programme Reader I Volume 1.
Bevan et al. (2007),Estimating Health and Productivity Gains in England from Selected Interventions(Health Foundation, London).
Birch, S. and A. Maynard (1986),The RAWP Review: RAWPing Primary Care; RAWPing the United Kingdom (Centre for Health Economics, Discussion Paper no. 19, University of York,
<http://www.york.ac.uk/inst/che/pdf/Papers/dp19.pdf>).
Black, D.J. (1970), ‘Production of Crime Rates’, American Sociological Review, Vol. 35, No. 4, pp. 733–48.
Bloor, K. and A. Maynard (1995),Equity in Primary Care(Centre for Health Economics, Discussion Paper 141, University of York,<http://www.york.ac.uk/inst/che/pdf/Papers/DP141.pdf>).
Blundell, R. and F. Windmeijer (1997), ‘Cluster Effects and Simultaneity in Multilevel Models’, Health Economics, Vol. 6, No. 4, pp. 439–43.
Bowling, A. (1999), ‘Ageism in Cardiology’,BMJ, Vol. 319, pp. 1353–55.
Burgess, S.M. et al. (2003),Explaining Differences in Hospital Performance: Does the Answer Lie in the Labour Market?(CEPR Discussion Paper No. 4118, Centre for Economic Policy Research, University of Bristol,<http://ssrn.com/abstract=488922>).
Capitation Formula Review Group (2004), Allocating Resources to Health and Social Services Boards:
Proposed Changes to the Weighted Capitation Formula(Department of Health, Social Services and Public Safety, Belfast,<http://www.dhsspsni.gov.uk/capitation-cfrg-fullrpt-no1.pdf>).
Carr-Hill, R.A. et al. (1994a),A Formula for Distributing NHS Revenues Based on Small Area Use of Hospital Beds [RARP 7] (Occasional Paper 22, Centre for Health Economics, University of York,
<http://www.dh.gov.uk/en/Managingyourorganisation/Financeandplanning/Allocations/DH 4108515>).
——— et al. (1994b), ‘Allocating Resources to Health Authorities: Development of Method for Small Area Analysis of Use of Inpatient Services’,BMJ, Vol. 309, pp. 1046–49.
——— et al. (1997), ‘A New Formula for Distributing Hospital Funds in England’,Interfaces, Vol.
27, pp. 53–70.
Challah, S. et al. (1984) ‘Negative Selection of Patients for Dialysis and Transplantation in the United Kingdom’,BMJ, Vol. 288, pp. 1119–22.
Cooper, M.H. and A.J. Culyer (1971), ‘An Economic Survey of the Nature and Intent of the British National Health Service’,Social Science and Medicine, Vol. 5, No. 1, pp. 1–13.
Crilly, T. et al. (2007), Review of Specific Cost Approach to Staff Market Forces Factor [RARP 31] (Department of Health, London,<http://www.dh.gov.uk/en/Managingyourorganisation/
Financeandplanning/Allocations/DH 4108515>).
Denham, J. (1999),Review of NHS Revenue Resource Allocation(Letter from the Minister of State for Health to the Chair of ACRA, 24 March).
Department of Health (1998a), The Exeter Data Set and Attribution [RAWP 3] (Department of Health, London,<http://www.dh.gov.uk/en/Managingyourorganisation/Financeandplanning/
Allocations/DH 4108515>).
——— (1998b), 1999/2000 Health Authority Revenue Allocations Exposition Book (Department of Health, London, http://www.dh.gov.uk/en/Managingyourorganisation/Financeandplanning/
Allocations/DH 4001003>).
——— (1999a), A Brief History of Resource Allocation in the NHS 1948-98 [RAWP 4]
(Department of Health, London, <http://www.dh.gov.uk/en/Managingyourorganisation/
Financeandplanning/Allocations/DH 4108515>).
——— (1999b),History of the Staff MFF[RAWP 1] (Department of Health, London,<http://www.
dh.gov.uk/en/Managingyourorganisation/Financeandplanning/Allocations/DH 4108515>).
——— (2000),A History of GP Distribution[RAWP 5] (Department of Health, London, http://www.
dh.gov.uk/en/Managingyourorganisation/Financeandplanning/Allocations/DH 4108515).
——— (2002),Exposition Book 2001/02(Department of Health, London,<http://www.dh.gov.uk/en/
Managingyourorganisation/Financeandplanning/Allocations/DH 4000873>).
——— (2003),HCHS Revenue Allocation: Weighted Capitation Formula(Department of Health, London,
<http://www.dh.gov.uk/en/Publicationsandstatistics/Publications/PublicationsPolicyAnd Guidance/DH 4069186>).
——— (2007a), Review of Population Base for PCT Unified Allocations Post-2008 [RARP 29]
(Department of Health, London, <http://www.dh.gov.uk/en/Managingyourorganisation/
Financeandplanning/Allocations/DH 4108515>).
——— (2007b), 2006-07 and 2007-08 Primary Care Trust Initial Revenue Resource Limits (Department of Health, London, <http://www.dh.gov.uk/en/Managingyourorganisation/
Financeandplanning/Allocations/DH 4104471>).
I Volume 1.
Department of Health (2008), Resource Allocation: Weighted Capitation Formula (Sixth Edi- tion) (Department of Health, London, <http://www.dh.gov.uk/en/Publicationsandstatistics/
Publications/PublicationsPolicyAndGuidance/DH 091849>).
——— (2009),Exposition Book 2009-10 and 2010-11(Department of Health, London,<http://www.
dh.gov.uk/en/Managingyourorganisation/Financeandplanning/Allocations/DH 091850>).
Department of Health and Social Security (1976),Sharing Resources for Health in England. Report of the Resource Allocation Working Party(The RAWP Report) [RARP 1] (HMSO; London,<http://www.
dh.gov.uk/en/Managingyourorganisation/Financeandplanning/Allocations/DH 4108515>).
——— (1980), Report of the Advisory Group on Resource Allocation (The AGRA Report) [RARP 2] (Department of Health and Social Security, London, <http://www.dh.gov.uk/en/
Managingyourorganisation/Financeandplanning/Allocations/DH 4108515>).
——— (1986),Review of the Resource Allocation Working Party Formula(Report by the NHS Management Board) [RARP 4] (Department of Health and Social Security, London, <http://www.
dh.gov.uk/en/Managingyourorganisation/Financeandplanning/Allocations/DH 4108515>).
——— (1988),Review of the Resource Allocation Working Party Formula(Final Report by the NHS Man- agement Board) [RARP 5] (Department of Health and Social Security, London, http://www.
dh.gov.uk/en/Managingyourorganisation/Financeandplanning/Allocations/DH 4108515).
Elliott, B. et al. (2005), Final Report. Review of the Market Forces Factor following the introduction of Payment by Results (2005): Exploring the General Labour Market Method[RARP 32] (Department of Health, London,<http://www.dh.gov.uk/en/Managingyourorganisation/Financeandplanning/
Allocations/DH 4108515>).
Gallie, W.B. (1955–6), ‘Essentially Contested Concepts’,Proceedings of the Aristotelian Society, Vol. 56, pp. 167–98.
Gravelle, H. and M. Sutton (2001), ‘Inequality in the Geographical Distribution of General Practitioners in England and Wales 1974–1995’,Journal of Health Services Research and Policy, Vol. 6, No. 1, pp. 6–13.
——— et al. (2003), ‘A Model Supply and Demand Influences on the Use of Health Care:
Implications for Deriving a ‘Needs-Based’ Capitation Formula’,Health Economics, Vol. 12, pp. 985–1004.
Grossman, M. (1972), The Demand for Health: A Theoretical and Empirical Investigation (Columbia University Press, New York).
Hall, E.P. et al. (2008), Can Pay Regulation Kill? Panel Data Evidence on the Effect of Labour Markets on Hospital Performance (CEPR Discussion Paper No. DP6643, Centre for Economic Policy Research, University of Bristol,<http://ssrn.com/abstract=1140572>).
Hann, M. and H. Gravelle (2004), ‘The Maldistribution of General Practitioners in England and Wales: 1974–2003’,British Journal of General Practice, Vol. 54, pp. 894–98.
Hart, J.T. (1971), ‘The Inverse Care Law’,Lancet, Vol. i, pp. 405–12.
Health Select Committee (1996),Allocation of Resources to Health Authorities. Report. Volume I[Session 1995-96, HC4771] (HMSO, London).
Hollinghurst, S. et al. (2000), ‘Estimating the ‘Avoidable’ Burden of Disease by Disability Adjusted Life Years (DALYs)’,Health Care Management Science, Vol. 3, No. 1, pp. 9–21.
Klein, R. (1998), ‘Why Britain is Reorganizing its National Health Service–Yet Again’,Health Affairs, Vol. 17, No. 4, pp. 111–25.
——— (2007),The New Politics of the NHS: From Creation to Reinvention(Radcliffe Publishing, Oxford).
Lamers, L. and R. van Vliet (1996), ‘Multi-Year Diagnostic Information from Prior Hospitalisation as a Risk Adjuster for Capitation Payments’,Medical Care, Vol. 34, No. 6, pp. 549–61.
Martin, S., N. Rice and P. Smith (1997),Risk and the GP Budget Holder(Centre for Health Economics, Discussion Paper 153, University of York).
Mays, N. (1987), ‘Measuring Morbidity for Resource Allocation’,BMJ, Vol. 295, pp. 703–6.
——— (1995), ‘Geographical Resource Allocation in the English National Health Service, 1971–
1994: The Tension Between Normative and Empirical Approaches’,International Journal of Epidemiology, Vol. 24, pp. S96–102.
——— and G. Bevan (1987),Resource Allocation in the Health Service(Bedford Square Press, London).
Mooney, G. (1994),Key Issues in Health Economics(Harvester Wheatsheaf, Hemel Hempstead).
Morgan, M., et al. (1987), ‘Can Hospital Use be a Measure of Need for Health Care?’Journal of Epidemiology and Community Health, Vol. 41, pp. 269–74.
Morris, S. et al. (2005). ‘Inequity and Inequality in the Use of Health Care in England: An Empirical Investigation’,Social Science and Medicine, Vol. 60, pp. 1251–66.