in the United Kingdom
Zsuzsanna Zsibók Institute for Regional Studies, Centre for Economic and Regional Studies, Hungarian Academy of Sciences, Pécs, Hungary.
E-mail: zsibok@rkk.hu
Keywords:
regional economic inequality, United Kingdom, global financial crisis, economic rebalancing
This study examines the trends of regional econom- ic development in the United Kingdom before, dur- ing, and after the economic crisis. The United Kingdom is historically characterised by persistent and significant regional economic disparities, which further grew during the global financial crisis and seem to remain stable at higher levels. Salient fea- tures of the economic spatial structure are the well- known North-South divide and, in parallel, Lon- don’s dominance over the rest of the country (the
‘London problem’). Our research is primarily de- scriptive. Specifically, it combines a literature review covering the latest relevant contributions and em- pirical data analysis. Based on important current policy initiatives, our analyses will also address the issue of a more spatially balanced development.
Introduction
From a socio-economic perspective, the United Kingdom (UK) is a relatively devel- oped nation amongst the member states of the European Union (EU). According to Eurostat data, its GDP per capita was around 130 per cent of the EU average be- tween 2000 and 2014, but it heavily deteriorated during and after the 2008 global financial crisis (from 146 to 127 per cent). Nowadays, even the most economically backward region (West Wales and the Valleys) reaches around 80 per cent of the EU average, while the leading region (Inner London West) is at more than 600 per cent (at the NUTS 2 level). The EU Regional Competitiveness Index (RCI) ranks four UK regions in the top 10 most competitive ones in the EU1, and even the least competitive region, Northern Ireland, ranks 145 out of 262 (Annoni et al. 2017).
The regional RCI variation in the UK is relatively high amongst the most developed EU countries, but this measure is moderate compared to South Eastern European countries, and even to France and Italy. Regional inequalities are historically high in the UK: they have been present since the period of industrial development in the
1 London and regions covered by its commuting zone (rank 1); Berkshire, Buckinghamshire, and Oxfordshire (rank 2); Surrey, East and West Sussex (rank 5); and Hampshire and Isle of Wight (rank 10).
19th century, and deepened during and after several periods of recession, as well as in boom periods (Marshall 1990, Gardiner et al. 2013). The investigation of the spatial processes in the country allows us to draw important conclusions about sources and dynamics of economic disparities, providing useful lessons for other countries, as well.
Our study emphasises that the increasing extent of spatial inequalities across the country cause not only a ‘regional’ but also a ‘national’ problem (McCann 2016), which thus needs substantial attention from policymakers. There has long been a debate over the existence of a trade-off between spatial disparities and national growth in an economy, that is, whether policies aiming to reduce regional economic inequalities are efficient for the country as a whole (Martin 2008). The theoretical models of the New Economic Geography claim that uneven geographical develop- ment may create higher rates of national growth through various increasing returns effects stemming from the spatial agglomeration of economic activities (Gardiner et al. 2013). For this reason, different courses of economic policy placed different emphasis on promoting regionally balanced economic growth in the UK (and, cer- tainly, in other countries as well). Gardiner et al. (2013) argue that spatially unbal- anced development and growth may bias or even compromise national economic policy, as it occurred in the UK during and after the global financial crisis in the second half of the 2000s.
This study examines the extent to which the UK economy is imbalanced and whether the crisis has reinforced trends of regional divergence. Our research meth- odology combines a literature review covering the latest relevant contributions and descriptive empirical data analysis. In the third section, we focus on the long-run trends behind the UK’s regional problem. The fourth section outlines the conse- quences of the financial crisis, while the fifth one maps the opportunities for re- balancing the UK’s economy including the ‘northern powerhouse’ initiative and the ones related to devolution. The last section summarises our findings.
Rising regional inequalities in the United Kingdom
According to McCann (2016), the basic problem of the UK economy is represented by its large interregional economic inequalities, which co-exist with a highly central- ised and top-down governance system. This long-standing problem emerges in sev- eral aspects: uneven geographical development, sectoral composition, balance be- tween consumption and investment, between the size of the public sector relative to the private sector, and merits of export-led growth relative to domestic-led expan- sion (Gardiner et al. 2013). A well-known feature of the UK regional problem is the so-called North-South divide. The concept is present in current economic policy debates in the UK and has deep historical roots (Baker–Billinge 2004). Regional disparities in economic and social conditions have been a persistent feature of the UK since the mid-19th century (Martin et al. 2016). They were triggered by industrial
specialisation, and later expanded and diminished in several waves (Gardiner et al.
2013). Until the inter-war period, booming heavy industries were largely concentrat- ed in northern England, Scotland, and Wales, or ‘outer Britain’ (Morgan 2002);
however, later these areas became depressed as their economies structurally de- coupled from the ‘new economy’ in the South (Mandelson 2001).
According to the classification by Gardiner et al. (2013), the North consists of the following regions: West Midlands, Wales, Yorkshire-Humberside, North West, North East, and Scotland, while the South includes London, South East, South West, East of England, and East Midlands (Table 1). Geographically, the dividing line is usually drawn between the Wash on the northern edge of East Anglia and the Severn Estuary in the South West of England.
Table 1
NUTS 1 Code NUTS 1 Name GDP per capita
(UK = 100.0)*
UKI London 166.5
UKJ South East 107.6
UKH East of England 93.1
UKM Scotland 92.4
UKK South West 90.1
UKD North West 84.9
UKF East Midlands 81.9
UKE Yorkshire and The Humber 81.5
UKG West Midlands 80.7
UKN Northern Ireland 77.3
UKC North East 73.8
UKL Wales 70.7
* GDP per capita is calculated as the average between 2008 and 2014.
Source: Author’s elaboration based on Eurostat data.
Business cycles and economic shocks’ patterns across the UK regions are less correlated than those between EU countries, and London’s economy is becoming increasingly disconnected from the rest of the UK; in other words, there is little or no economic cohesion between the different parts of the country. Moreover, re- gional interests are diverging, which poses difficulties in the country governance (McCann 2016).2 While London and the South East region cover around 8.5 per cent of the area, 27 per cent of the population, and 28 per cent of the employment within the UK, these regions account for 38 per cent of the country gross domestic product (Table 2).
2 ‘The UK has “gone south”[…].’ (McCann 2016, p. 27).
Table 2
Area Population Employment GDP
km2 % 1 000
persons % 1 000
persons % Million
euros %
North East 8,573 3.52 2,614.8 4.06 1,143.3 3.87 66,700 3.00 North West 14,112 5.80 7,120.4 11.06 3,143.8 10.64 209,557 9.43 Yorkshire-Humber 15,369 6.31 5,356.7 8.32 2,408.7 8.15 148,869 6.70 East Midlands 15,594 6.41 4,614.0 7.17 2,132.9 7.22 133,084 5.99 West Midlands 12,964 5.33 5,691.3 8.84 2,478.4 8.38 160,458 7.22 East of England 19,084 7.84 5,981.7 9.30 2,819.3 9.54 194,081 8.73 London 1,574 0.65 8,477.3 13.17 4,157.1 14.06 509,402 22.91 South East 19,067 7.83 8,828.3 13.72 4,170.2 14.11 335,161 15.07 South West 23,860 9.80 5,396.7 8.39 2,488.4 8.42 169,288 7.61 Wales 20,742 8.52 3,095.1 4.81 1,320.3 4.47 75,976 3.42 Scotland 78,418 32.21 5,337.5 8.29 2,509.7 8.49 172,744 7.77 Northern Ireland 14,078 5.78 1,837.3 2.86 787.6 2.66 48,078 2.16 United Kingdom 243,435 100.00 64,351.2 100.00 29,559.7 100.00 2,223,398 100.00
Source: Author’s calculation based on Eurostat data.
Then, we investigate to what extent basic economic indicators, GDP per capita time series, and employment data provided by Eurostat reflect the classification by Gardiner et al. (2013). Figure 1 maps GDP per capita at the NUTS 1 level; the val- ues are expressed in current prices (in euros) between 2008 and 2014, taking the UK average as 100. This map approximately corroborates the regions’ grouping (North and South) mentioned earlier. Scotland seems to be a positive outlier amongst the northern regions, while East Midlands a negative outlier in the South. The position of West Midlands has been debated over the previous decades; economically, it currently belongs to the North.
Figure 1
Source: Author’s elaboration based on Eurostat data.
The North-South divide is a stereotype, and characterising the UK economy with this phenomenon is a simplification. Nonetheless, in broad terms, the diver- gence between these two major areas is undeniable (Martin et al. 2016). Gardiner et al. (2013) show that, in some cases, the existence of such a divide can be questioned, since local areas of economic depression and deprivation can be found in the South, while there are areas of growth and prosperity also in the North. The authors high- light that the picture is more complex at the local level than it is at a regional scale (Table 3). For example, even London includes some areas of high unemployment and poverty. However, the basic argument on the existence of a North-South divide is that areas of economic depression and deprivation are more numerous in the North, while areas of economic prosperity abound in the South (Gardiner et al.
2013).
Table 3
NUTS Code NUTS 2 Name GDP pc*
UKI3 Inner London - West 497.5
UKI4 Inner London - East 172.7
UKM5 North Eastern Scotland 146.2
UKJ1 Berkshire, Buckinghamshire and Oxfordshire 135.8
UKD6 Cheshire 113.1
UKI7 Outer London - West and North West 106.8
UKH2 Bedfordshire and Hertfordshire 104.6
UKJ2 Surrey, East and West Sussex 104.3
UKK1 Gloucestershire, Wiltshire and Bristol/Bath area 104.0
UKJ3 Hampshire and Isle of Wight 102.3
UKH1 East Anglia 92.6
UKM2 Eastern Scotland 92.2
UKE2 North Yorkshire 90.1
UKI6 Outer London - South 89.5
UKF2 Leicestershire, Rutland and Northamptonshire 88.6 UKG1 Herefordshire, Worcestershire and Warwickshire 87.3
UKE4 West Yorkshire 85.6
UKD3 Greater Manchester 84.9
UKM6 Highlands and Islands 84.7
UKD1 Cumbria 84.6
UKL2 East Wales 84.0
UKM3 South Western Scotland 83.2
UKK2 Dorset and Somerset 82.8
UKH3 Essex 82.4
UKJ4 Kent 81.4
UKG3 West Midlands 80.6
UKF1 Derbyshire and Nottinghamshire 79.6
UKE1 East Yorkshire and Northern Lincolnshire 79.5
UKK4 Devon 78.5
UKC2 Northumberland and Tyne and Wear 77.5
UKN0 Northern Ireland 77.3
UKD7 Merseyside 76.8
UKD4 Lancashire 76.2
UKG2 Shropshire and Staffordshire 75.5
UKI5 Outer London - East and North East 73.3
UKF3 Lincolnshire 73.1
UKK3 Cornwall and Isles of Scilly 71.1
UKE3 South Yorkshire 70.8
UKC1 Tees Valley and Durham 69.2
UKL1 West Wales and The Valleys 62.8
* GDP per capita is calculated as the average between 2008 and 2014; the UK average is set at 100.
Source: Author’s calculation based on Eurostat data.
Figure 2
Source: Author’s elaboration based on Eurostat data.
The region that most challenges the North-South classification is Scotland. Ac- cording to McCann (2016), the UK can be considered as consisting of three differ- ent economies: London and its hinterland (South East, East of England, and South West), Scotland, and the rest. In terms of GDP, productivity, and employment, Scotland has improved within the UK, with only the recovery (austerity) after the crisis causing a temporary deterioration in its relative performance. This seems to suggest that the relative catching-up of Scotland is not a direct consequence of the increased devolution in the past few years, but rather a longer-term phenomenon.3 Some of the contributing factors can be the increased importance of oil industry
3 See Greg et al. (2016) for an analysis of the Scottish long-term economic development in the context of devolution from the cities’ perspective.
and green energy, as well as the economic vibrancy of some first- and second-tier cities such as Aberdeen. Given the possibility of Scotland’s independence, economic stability becomes crucial for public finance sustainability and overall prosperity (Harris–Moffat 2016, Armstrong–McLaren 2014).
As per the GDP per capita at the NUTS 2 level between 2008 and 2014, the evi- dence is certainly more mixed (Table 3 and Figure 2). On average, the values range between 63 per cent (West Wales and the Valleys) and 497 per cent (Inner London–
West)4 of the national average. Out of the 40 regions at the NUTS 2 level, only ten regions exhibit a GDP per capita above the national average, and two of them are in the ‘North’ (North Eastern Scotland, 146 per cent and Cheshire, 113 per cent).
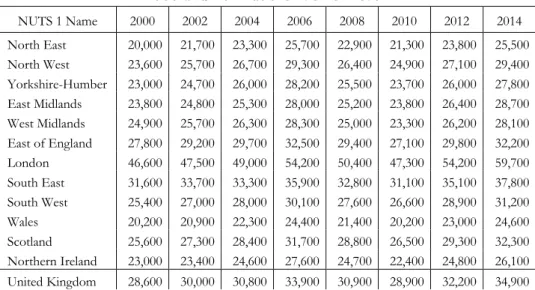
In most regions, the evolution of the regional GDP per capita was more or less stable before and after the global financial crisis relatively to the national average (Table 5), though with some exceptions. London constantly advanced (from 163 to 171 per cent)5, and the North East, the North West, and Scotland also improved their position by around 2 to 3 percentage points.6 The largest deterioration was observed in the West Midlands (from 87 to 80.5 per cent)7, Northern Ireland (from 80 to 75 per cent) and the East of England (from 97 to 92 per cent).8 As pointed out by Martin (2015), the long boom between the early-1990s and 2007 reinforced regional inequalities. The variation coefficient of GDP per capita is around 30 per cent at the NUTS 1 level, and around 70 per cent at the NUTS 2 level, with an in- creasing trend (Table 4). As per McCann (2016), business cycles and economic shocks’ patterns across UK regions are today less correlated than those between EU countries. At the NUTS 1 level, the scale of interregional differences in GDP per capita is comparable to the corresponding international differences across 17 Euro- pean countries and across 22 OECD countries, while at the NUTS 3 region level, these differences are comparable to those across 22 European countries and 27 OECD countries (McCann 2016).
4 Figure 2 indicates the average value for Inner London (336.11 per cent), computed as the average of Inner London West (497.5 per cent) and Inner London East (172.7 per cent). The average value of Outer London is 89.85 per cent, computed as the average of Outer London East and North East (73.3 per cent), Outer London South (89.5 per cent), and Outer London West and North West (106.8 per cent).
5 Nevertheless, Outer London deteriorated significantly from 101 to 92 per cent, while Inner London improved from 301 to 341 per cent. By 2014, the Inner London West NUTS 2 region reached 495 per cent of the national average GDP per capita.
6 Specifically, North Eastern Scotland substantially improved (from 117.5 per cent in 2000 to 150 per cent in 2014), while the other two NUTS 2 regions of Scotland nearly stagnated.
7 Out of the 3 NUTS 2 regions in the West Midlands NUTS 1 region, the West Midlands NUTS 2 region heavily deteriorated (from 91.5 to 79 per cent, while the other regions nearly stagnated.
8 The highest drop was observed in Bedfordshire and Hertfordshire (from 114 to 103 per cent, while East Ang- lia and Essex lost only 2 and 4 percentage points relative to the national average, respectively.
Table 4
2000 2002 2004 2006 2008 2010 2012 2014
NUTS 1
CoV* 27.1 25.8 24.7 25.0 26.8 27.0 28.4 29.6
Max/min 2.33 2.27 2.19 2.22 2.36 2.34 2.36 2.43
NUTS 2
CoV* 59.4 56.5 57.0 58.9 64.1 68.2 70.3 68.0
Max/min 7.27 7.00 6.91 7.03 7.80 8.11 8.11 7.85
* The coefficient is expressed in percentage points.
Source: Author’s computation based on Eurostat data.
Table 5
NUTS 1 Name 2000 2002 2004 2006 2008 2010 2012 2014 North East 20,000 21,700 23,300 25,700 22,900 21,300 23,800 25,500 North West 23,600 25,700 26,700 29,300 26,400 24,900 27,100 29,400 Yorkshire-Humber 23,000 24,700 26,000 28,200 25,500 23,700 26,000 27,800 East Midlands 23,800 24,800 25,300 28,000 25,200 23,800 26,400 28,700 West Midlands 24,900 25,700 26,300 28,300 25,000 23,300 26,200 28,100 East of England 27,800 29,200 29,700 32,500 29,400 27,100 29,800 32,200 London 46,600 47,500 49,000 54,200 50,400 47,300 54,200 59,700 South East 31,600 33,700 33,300 35,900 32,800 31,100 35,100 37,800 South West 25,400 27,000 28,000 30,100 27,600 26,600 28,900 31,200 Wales 20,200 20,900 22,300 24,400 21,400 20,200 23,000 24,600 Scotland 25,600 27,300 28,400 31,700 28,800 26,500 29,300 32,300 Northern Ireland 23,000 23,400 24,600 27,600 24,700 22,400 24,800 26,100 United Kingdom 28,600 30,000 30,800 33,900 30,900 28,900 32,200 34,900
Source: Author’s elaboration based on Eurostat data.
Population in the UK has been growing constantly from 58 million in 2000 to 65 million in 2015, at a 0.66 per cent average annual rate. The growth rate has been positive in every NUTS 1 region since 2003. However, there are significant differ- ences before and after the crisis. Specifically, the annual population growth rate steadily increased before the crisis (from 0.37 per cent in 2001 to 0.82 per cent in 2008), but during the recovery, this tendency stopped, and the growth rate stabilised around an annual average of 0.76 per cent. There has been a sharp increase in the
yearly population growth rate of London between 2004 and 2009, and after the crisis it remained high at around 1.5 per cent. The lowest, though increasing, growth rates were measured in the North East, which moved from -0.2 per cent in 2001 to 0.42 per cent in 2015. After 2008, Northern Ireland, Scotland, and Wales experi- enced diminishing, but still positive population growth rates. After 2013, rates have increased in all NUTS 1 regions except for Wales and Northern Ireland. Consider- ing the period after the crisis, a geographic division emerges: the highest average annual population growth rates were measured in the ‘South’ (0.69 to 1.5 per cent), while the lowest ones in the ‘North’(0.33 to 0.66 per cent).
As for the employment data, Figure 3 firmly supports the North-South classifi- cation by Gardiner et al. (2013). Typically, South East, South West, East of England, East Midlands, and Scotland are above the national average employment rate (71 per cent), while London is on average significantly below this level (Figure 4).
Figure 3
Source: Author’s elaboration based on Eurostat data.
Figure 4
60 62 64 66 68 70 72 74 76 78
2000 2001 2002 2003 2004 2005 2006 2007 2008 2009 2010 2011 2012 2013 2014 2015
%
United Kingdom North East
North West Yorkshire and The Humber
East Midlands West Midlands
East of England London
South East South West
Wales Scotland
Northern Ireland
Source: Author’s elaboration based on Eurostat data.
Figure 5 shows the evolution of the unemployment rates in the United Kingdom at the NUTS 1 level in the 2000s. Among the southern regions, London is a negative outlier, with the highest unemployment rates in the years before the glob- al financial crisis. The rate peaked at 12 per cent in 2011 in Inner London–East, and at 11.1 per cent in Outer London–East and North East. On average, these NUTS 2 regions reported the highest unemployment rates after 2000. The lowest average unemployment rate (3.9 per cent) was measured in North Eastern Scotland (Aber- deen and Aberdeenshire) between 2000 and 2015, and remained at quite a low level (between 3 and 4.8 per cent) during and after the crisis. North Yorkshire (4.2 per cent) and Cheshire (4.6 per cent), though located in the ‘North’, are also among the regions with the lowest unemployment rates.
Figure 5
0 2 4 6 8 10 12
2000 2001 2002 2003 2004 2005 2006 2007 2008 2009 2010 2011 2012 2013 2014 2015
%
London East Midlands West Midlands
Yorkshire-Humber North West Wales
North East South West East of England
Scotland South East Northern Ireland
Source: Author’s elaboration based on Eurostat data.
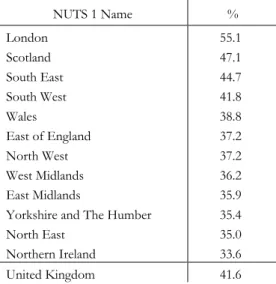
Eurostat data highlight marked differences across NUTS 1 regions with respect to education attainment. Since the beginning of the 2000s, the share of people aged 25 to 64 with less than primary, primary, and lower secondary education has been decreasing constantly all over the country, from an average of 35.6 per cent in 2000 to 20.3 per cent in 2015. In parallel, the share of people aged 25 to 64 having tertiary education has been constantly increasing after the Millennium, from 28.5 per cent in 2000 to 41.6 per cent in 2015. However, cross-sectional (between regions) standard deviation has also increased. In 2015, only London, Scotland, the South East, and the South West regions were above the national average (41.6 per cent) with respect to the share of people aged 25 to 64 with tertiary education (Table 6).
Among the NUTS 2 regions, though in the South West, the lowest share was re- ported in Cornwall and the Isles of Scilly (32 per cent), while the highest one was measured in Inner London–West (69.5 per cent). The East of England and East Midlands also positioned below the national average. The lowest share was reported for Northern Ireland and the North East. This North-South gap is partly a conse- quence of out-migration of the better qualified to more prosperous regions, where a higher proportion of better jobs is offered (Adams et al. 2003). The significant dis-
parities with respect to education attainment (the variation coefficient is around 15 per cent) point to the importance of related policy interventions as a central part of regional development policy.
Table 6
NUTS 1 Name %
London 55.1
Scotland 47.1
South East 44.7
South West 41.8
Wales 38.8
East of England 37.2
North West 37.2
West Midlands 36.2
East Midlands 35.9
Yorkshire and The Humber 35.4
North East 35.0
Northern Ireland 33.6
United Kingdom 41.6
Source: Author’s elaboration based on Eurostat data.
Productivity is widely recognised as the most important long-run driver of economic growth (Harris–Moffat 2016). As showed in Figure 6, in the long term southern regions tend to outperform northern ones in terms of productivity, meas- ured as the nominal gross value added per hour worked. Scottish productivity, espe- cially in Aberdeen city and Aberdeenshire, is similar to that of regions in the South East, owing to the great variety of its industries, while East Midlands and South West seem to exhibit lower performances amongst the southern regions. Rural and remote areas, as well as those regions that are dependent on agriculture and tourism usually lag behind, while large cities tend to be quite productive (Boren 2015). Re- gional inequalities in the UK are amongst the highest of any advanced OECD coun- try, even by excluding the case of London (McCann 2016).
According to the Office for National Statistics (2017a), the very high levels in the Greater London region lead to a skewed distribution of productivity across the UK.
As a result, relatively few regions show productivity levels above the UK average: in 2015, only 47 out of 168 NUTS 3 regions across England, Scotland, and Wales had a gross value added per hour worked above the UK average, of which 21 were in Lon- don. The analysis shows that, in the South of England (South East, South West, and East of England), productivity levels were well above the UK average in the most
productive areas, while the lowest labour productivity levels in 2015 were generally found in rural or coastal areas outside Greater London (Table 7).
Table 7
NUTS Code NUTS Name Productivity Index
Top 10
UKI11 Inner London – West 146.8
UKJ11 Berkshire 133.3
UKI12 Inner London – East 133.2
UKJ23 Surrey 124.7
UKJ13 Buckinghamshire CC 118.6
UKM50 Aberdeen City & Aberdeens. 118.5
UKF11 Derby 116.5
UKM25 Edinburgh, City of 115.7
UKK14 Swindon 113.5
UKJ12 Milton Keynes 112.9
Bottom 10
UKM24 Scottish Borders 75.4
UKM32 Dumfries & Galloway 75.4
UKD41 Blackburn with Darwen 74.4
UKG11 Herefordshire, County of 74.3
UKK30 Cornwall and Isles of Scilly 72.2
UKL12 Gwynedd 72.2
UKL11 Isle of Anglesey 71.8
UKM66 Shetland Islands 71.5
UKL14 South West Wales 69.2
UKL24 Powys 62.1
Source: Author’s elaboration based on Office for National Statistics data.
In the Midlands, two NUTS 3 regions exhibited productivity levels above the UK average in 2015: Solihull (West Midlands) and Derby (East Midlands), where car or aerospace manufacturing plants are located. In the North of England (North West, North East and Yorkshire, and The Humber), in 2015 only Chesire emerged as a positive outlier. The county is renowned for its agricultural industry and its leading role in several high-tech, high-skill industrial sectors (Billington 2011). In Scotland, four NUTS 3 regions9 exceed the average UK productivity level. Harris
9 Aberdeen city and Aberdeenshire (North East Scotland), Edinburgh (Eastern Scotland), South Ayrshire (So- uth West Scotland) and Inverclyde, East Renfrewshire, and Renfrewshire (South West Scotland).
and Moffat (2016) analyse in detail the productivity gap between Scotland and the rest of the UK. Specifically, they identify ‘place’ and ‘non-place’ effects: the former considers the effect on productivity if plants with exactly the same characteristics were relocated from the rest of the UK to Scotland. In other words, such effects measure advantages or disadvantages associated with location. ‘Non-place’ effects, instead, show whether in Scotland there are too many or too few plants with charac- teristics not directly related to location which can be associated with lower or higher productivity. In terms of results, both positive and negative ‘place’ effects emerge in different industries, while ‘non-place’ effects turn out to be negative in all sectors.
Harris and Moffat (2016) also suggest that Scotland suffered more than the rest of the UK from the closure of relatively highly productive foreign-owned plants. At the NUTS 3 level, all the twelve regions in Wales and the five in Northern Ireland fall behind the UK average.
Figure 6
–6 –4 –2 2 4 6 8 10
1997 1998 1999 2000 2001 2002 2003 2004 2005 2006 2007 2008 2009 2010 2011 2012 2013 2014
₤
North East North West& Merseyside
Yorkshire & Humber East Midlands
West Midlands East of England
London South East
SouthWest Wales
Scotland Northern Ireland
Source: Author’s elaboration based on Office for National Statistics data.
The impacts of the global financial crisis
In the UK, spatially unbalanced growth is politically recognised as having contribut- ed to the 2008 financial crisis as well as a hindrance to future economic stability (Martin 2015). This means that regional economic inequalities increased not only in boom phases, but also during and after the crisis at even greater pace, resulting in an increasing concentration of economic activities around the capital city.
The global financial crisis caused a 24.3 per cent drop in GDP per capita be- tween 2007 and 2009. As a response to the recession in 2008 and 2009, in the la- bour market, the UK experienced a prolonged fall in productivity, a stronger em- ployment performance, a rapid growth in part-time and self-employment, and a dramatic decrease in real wages. However, these tendencies differ across regions (Bell–Eiser 2016). In the literature, London and the South East emerged as more resilient than other (older industrial) regions (Fingleton et al. 2012, Industrial Com- munities Alliance 2015, Bell–Eiser 2016).
The crisis resulted in a 2 percentage points’ drop in the average employment rate between 2008 and 2011; however, the rate recovered to nearly 73 per cent by 2015, and it has been constantly increasing since 2012 (Figure 4). The relative position of the NUTS 1 regions has not changed much after the crisis, excepting Scotland, which improved a lot (from 68.5 per cent in 2000 to 73.4 per cent in 2015).10 Lon- don proved quite resilient after the crisis, since it recovered its pre-recession em- ployment level and rate substantially before the other regions (Bell–Eiser 2016).
More in detail, during the recovery, there was a significant rise in part-time work relative to full-time work, which sheds light on the phenomena of underemploy- ment (people work part-time but wish to have a full-time job) and hidden unem- ployment (partial inactivity). Job-to-job moves were relatively rare, and employees tended to keep their jobs, though under less favourable conditions. Similar phe- nomena were captured by Green and Livanos (2015) in the concept of involuntary non-standard employment, consisting of involuntary part-time and involuntary temporary work. The authors point out that weaker regional economies experienced larger than average shares of involuntary non-standard employment (North East, Wales, West Midlands, and Northern Ireland), while the opposite occurred in core regions.
Labour demand fell during and after the crisis due to the programme of fiscal consolidation and the decrease in public sector employment. The latter affected the regions disproportionately, since the regions outside London and the South East are more dependent on it as compared to other ones (Table 8). As per the Office for National Statistics (2017b), Northern Ireland presents the highest proportion of
10 Actually, inequalities exist in Scotland: the highest employment rate was measured in North Eastern Scotland (77.2 per cent) and in the Highlands and Islands region (74.6 per cent), while Eastern Scotland (72.5 per cent) and South Western Scotland (67.9 per cent) have lower rates.
public sector employment relative to the private sector: specifically, it has fallen from 31 to 25 per cent since the crisis (the UK average has fallen from 22 to 17 per cent). Similar figures also apply to Wales, Scotland, and the North East of England.
The lowest proportion of public sector employment was measured in London: it was around 19 per cent in 2009 and has fallen to 14.6 per cent in 2016. In the South East, the proportion changed from 18 to 15 per cent and in East of England and East Midlands from 19 to 15 per cent. The other four regions (Yorkshire and the Humber, North West, South West, and West Midlands) reported proportions near the UK average.
Table 8
NUTS 1 Region Public sector Private sector
North East –20.9 +17.4
North West –17.0 +11.7
Yorkshire-Humber –18.1 +13.9
East Midlands –14.5 +14.4
West Midlands –16.1 +15.8
East –12.6 +17.2
London –9.0 +28.6
South East –12.0 +10.3
South West –18.9 +16.7
Wales –18.0 +16.5
Scotland –14.7 +12.9
Northern Ireland –10.4 +19.2
UK –15.1 +16.4
Source: Author’s elaboration based on Office for National Statistics data.
According to Eurostat data (Figure 5), during the global financial crisis, the highest increase in the unemployment rate was measured in the North East (from 6.1 per cent in 2007 to 10.7 per cent in 2011); moreover, high increases were experienced in York- shire and the Humber (3.8 percentage points), Northern Ireland (3.4 percentage points), Wales (3.4 percentage points), Scotland (3.3 percentage points), and London (3 percentage points). On the other hand, the South East and East of England resisted more to the crisis, as the increase in unemployment rates was relatively low (1.6 and 2 percentage points, respectively). In the recovery phase, unemployment rates have decreased in all NUTS 1 regions, though to a different extent. In London, the de- crease was 3.6 percentage points (from 9.8 per cent in 2011 to 6.2 per cent in 2015);
similarly, it was around 3 percentage points in the Midlands, in Yorkshire and the Humber, and in the North West. The smallest decrease (1.1 percentage points) was
reported in Northern Ireland: from 7.2 per cent in 2011 to 6.1 per cent in 2015, which suggests that this region is the least resilient.
The regional differences in the impacts of the crisis on the labour market can be explained, among other important factors, by internal and international migration flows, as well as by the structure of the immigrant labour force (Bell–Eiser 2016).
Harari (2017) shows that, historically, UK labour productivity has grown by around 2 per cent per year, but it has stagnated since the 2008-09 recession (Figure 7).
Labour productivity at the end of 2016 exceeded the pre-recession peak level (the value in fourth quarter of 2007) by 0.1 per cent only. In 2016, the annual productivity growth was 0.3 per cent. The reasons behind this productivity puzzle are numerous:
falling productivity in the oil and gas and financial sectors; weak investments reducing the quality of equipment; the banking crisis generating lack of lending to more pro- ductive firms; employees being moved to less productive roles within the firm; and slowing rates of innovation and discovery, as well as population ageing. However, these factors are not sufficient on their own to entirely explain the phenomenon (Bar- nett et al. 2014, Harari 2017). The GDP growth realised in the past few years is mainly attributable to the increase in the hours worked (that is, increasing employment and decreasing unemployment) rather than productivity growth, which means that the labour market performance has been relatively strong during and after the crisis. As a result, wages and living standards have stagnated since the end of the crisis, and real wages fell during the recovery to a level around 10 per cent lower than before the recession (Gregg et al. 2014, Bell–Eiser 2016). Nominal wages have been frozen and even cut during the recovery, which resulted in decreasing wages in real terms due to the inflation. These trends were particularly evident in London.
Figure 7
0 20 40 60 80 100 120
1997 1998 1999 2000 2001 2002 2003 2004 2005 2006 2007 2008 2009 2010 2011 2012 2013 2014 2015 2016
Source: Authors elaboration based on Office for National Statistics data.
After the crisis, only London, South East, Scotland, East Midlands, and North East regions were able to restore their productivity to above the pre-crisis level as compared to the national average. East of England fell below the national average, while Scotland almost reached it from a lower level.
Policies for improving economic balance
In response to the crisis and the subsequent recession, the UK government assigned key importance to the need to spatially rebalance the economy, in order to reduce its dependence on London and the South East by powering up northern cities (Martin 2015).11 There is currently much interest in this issue not only at the central gov- ernment level, but also within the major cities, regions, and nations (Martin et al.
2016).
The need for active policies for spatial rebalancing did not emerge as new. The so-called Barlow Report (Report of the Barlow Commission on the Distribution of the Industrial Population, 1940) raised concerns about the fact that concentration of economic activity and growth in London and the South East could lead to problems of congestion, urban sprawl, and inflation (Gardiner et al. 2013). The Commission not only recommended the development of new industrial capacity outside the core region, but even highlighted the importance of controlling London’s growth to reduce the disparities between North and South, resulting in the so-called ‘planned decentralisation’. As a consequence, measures were needed to relocate population and industries to the slow growing regions. Regional policy then prompted a more balanced distribution of employment through direct interventions. Martin (2015) argues that, in contrast to the Barlow Commission proposition, no fixed amount of economic growth or activity has to be distributed across the national economy. In other words, it is useless holding back prosperous areas in order to promote activity in the less prosperous ones. Instead, it has to be ensured that the less prosperous areas are able to realise their full economic potential. To this aim, proper and fair access to both public and private resources is needed. A hindering factor for the development outside the core region is that economic, financial, and political power is too concentrated in London.
Two main arguments support the view that greater spatial balance is needed across the UK (Gardiner et al. 2013, Martin et al. 2016). The first one is related to social equity: sustained outward migration of the relatively most enterprising, quali- fied, and skilled people from the slow-growing regions damages both economic potential and social cohesion of such regions (Rowthorn 2010). The second one is the economic efficiency argument, for which the persistent existence of underuti- lised resources (labour, capital, and infrastructures) in less prosperous regions is
11 As David Cameron said: ‘(We need) a plan to breathe economic life into the towns and cities outside the M25’ (Cameron 2010).
economically inefficient and hinders national economic growth, in addition to in- ducing higher social benefits (Gardiner et al. 2010).
The significant extent of regional inequalities poses challenges for the national economic policies. Due to the economic divergences within the UK, the country cannot be regarded as an optimum currency area (McCann 2016). London is a re- curring source of inflationary pressure (Martin 2015), and a more even geographical distribution of economic activity would lower such pressure in factor markets. Ac- cording to Gardiner et al. (2011), reducing regional disparities may enhance national economic management, while a highly spatially imbalanced economy can distort both fiscal and monetary policies. The authors explain that in regions of persistent high activity, the rate of inflation that maximises growth is likely to be higher than the corresponding optimum rate in low-activity regions. Monetary policy instru- ments and a large part of fiscal policy measures are set centrally and, therefore, are not able to account for regional differences. With large spatial disparities, the effects of common policy instruments are different throughout the country and are not evenly effective. The risk is that national economic policy instruments are set in a way that favours core regions. For example, according to Eddie George, the Gover- nor of the Bank of England between 1993 and 2003, unemployment in the North was an ‘acceptable price to pay to curb inflation in the South’. McCann (2016) points out that such risk is not just potential now, since, according to the rhetoric typical in the London popular press, national UK public policy should strive at all costs to maintain London’s performance (p. 114).
It is now recognised that the growth of the UK economy has been too depend- ent on a narrow range of activities, especially finance, and on the mega-region of London and the Greater South East. A new ‘local growth agenda’ included Local Enterprise Partnerships (after the abolition of Regional Development Agencies), a regional growth fund, local enterprise zones, city deals, as well as various other measures such as infrastructure projects (Martin 2015).
The so-called ‘northern powerhouse’ initiative12 was introduced by Chancellor George Osborne in 2014, stating that northern cities (Manchester, Liverpool, Leeds, and Newcastle) are characterised by individual strength, but collectively they are not strong enough. Grouping the cities sufficiently close to each other would rebalance the economy (Osborne 2014). However, London growth is not hindered in any way (Martin 2015). The idea of the ‘northern powerhouse’ is based on promoting growth in and devolving fiscal powers to a group of northern cities sufficiently close to each other that, combined, would rival London and the South East. The main objectives are to increase jobs and incomes, redress the North-South divide, and lift the nation’s stagnant productivity. However, the success of this initiative is not guaranteed (Martin–Gardiner 2017, Hayton et al. 2016). Experience shows that the
12 A similar initiative has been launched by the government for the Midlands under the ‘Midlands Engine Strategy’ (HM Government 2017) in Spring 2017.
‘march of the makers’ envisaged by Osborne (2011) failed to happen, and finance, which has less vertical (and regional) spill-over effect than manufacturing, remained the main source of economic growth.
Recent policy agendas are centred on two major issues (McCann 2016): govern- ance decentralisation and devolution; and improvement of regional and interregion- al connectivity to counterbalance the highly London-centric infrastructure system.
However, outcomes will not necessarily be as envisaged. Martin (2015) suggests that the impact of the existing economic development policies on a greater spatial bal- ance is expected to be small, since such measures remain piecemeal, ‘add-on’, and marginal to the basic structures and workings of the UK’s national system of fiscal, monetary, and economic management, which generally favours London and its hinterland (Martin 2015).
In questioning whether London is good or bad for the rest of the country, Martin (2015) summarises the main approaches. One argument is that productivity benefits spread across the country, the economy of Greater London generates demand for goods and services in the rest of the UK, and London is a major contributor to the taxes which, in turn, help fund welfare payments and public spending across the whole nation (City of London Corporation 2011). On the contrary, McCann (2016) states that there is no evidence of widespread and beneficial economic spatial spread effects from London to other regions. There are no real spread effects at all, and this results in the weak long-run productivity performance of the country as a whole (McCann 2016). The counter-argument states that London is ‘a different country’, an
‘island’, a quasi-independent ‘city-state’, ‘Planet London’ (O’Brien 2012), or that the UK is actually a ‘Disunited Kingdom’ (Ganesh 2015). Specifically, the region has de- tached from the rest of the UK in terms of prosperity, economic growth, global orien- tation, and cyclical behaviour (Martin et al. 2016). Sturgeon (2014) depicts London as a ‘black hole’ which drains talent, investment, and business from the rest of the coun- try, Europe, and the world.
According to Martin (2015), ‘London is indeed a very “different creature” from the rest of the country’s urban system, and its economy is most certainly partly driv- en by unique political forces.’ The UK has one of the most centralised national po- litical and financial systems amongst the OECD countries, and London receives huge amounts of public spending: around 14 percent of the total UK spending (Ta- ble 9). The balance between regions seems to improve when measured on a per capita basis. On the other hand, London and the South East are significant net con- tributors to the UK economy (Oxford Economics 2007). For this reason, it cannot be claimed that the agglomeration of activities in London is purely ‘market-driven’.
Spatial imbalances in the UK relate to a major spatial imbalance in the location and operation of the key levers of economic, financial, political, and administrative pow- er (Martin–Gardiner 2017). Cities and regions outside London see the national poli- cy as London-centric and ignoring their needs and conditions (Wilcox et al. 2014). It
seems that, while state expenditures attempt to relieve regional disparities through welfare spending and redistribution, they do not really support extra growth in pe- ripheral regions, since the allocated state capital and research spending is distorted towards London and the South.
Table 9
2010-11 outturn 2011-12 outturn 2012-13 outturn 2013-14 outturn 2014-15 outturn
₤ million
₤ per head
₤ million
₤ per head
₤ million
₤ per head
₤ million
₤ per head
₤ million
₤ per head North East 25,813 9,979 25,158 9,690 24,925 9,578 24,720 9,470 24,498 9,355 North West 68,127 9,705 66,376 9,407 66,651 9,408 65,770 9,259 65,652 9,204 Yorkshire-
Humber 47,320 9,005 46,801 8,850 46,547 8,755 46,158 8,648 46,453 8,667 East Midlands 38,012 8,434 37,405 8,244 37,586 8,229 37,548 8,166 37,866 8,165 West Midlands 50,097 9,001 49,451 8,817 49,363 8,748 49,100 8,653 49,650 8,690 East of England 48,474 8,347 46,860 7,993 46,803 7,923 47,308 7,945 47,467 7,887 London 88,040 10,921 85,819 10,460 84,051 10,116 84,073 9,989 84,092 9,848 South East 69,532 8,106 67,526 7,804 68,098 7,805 69,220 7,872 68,877 7,762 South West 44,461 8,451 44,156 8,330 44,326 8,301 44,915 8,352 45,023 8,302 Scotland 55,993 10,641 55,654 10,501 55,978 10,535 55,082 10,339 55,520 10,382 Wales 31,367 10,284 31,323 10,223 30,583 9,949 30,515 9,900 30,649 9,912 Northern Ireland 20,453 11,332 20,436 11,264 20,466 11,223 20,270 11,078 20,457 11,115 UK identifiable
expenditure 587,689 9,364 576,964 9,117 575,378 9,032 574,680 8,965 576,205 8,920 Source: Author’s elaboration based on HM Treasury (2016).
Martin (2015) claims that national political-administrative and economic govern- ance systems, together with their territorial structures, can significantly influence the geography of economic growth and development through their macro-economic policies, taxation and spending priorities, funding of infrastructures, welfare pro- grammes, and measures for crises management (e.g. current fiscal austerity pro- grammes). As previously mentioned, due to the high centralisation of governance, policies are often London-centric and do not address the problems of less devel- oped areas. The high levels of political centralisation and regional economic inequal- ity are interdependent phenomena. In large and highly diverse economies like the UK, the top-down centralised governance system may not be really appropriate, and may even exacerbate the dislocating and decoupling of the national economy (McCann 2016, Martin–Gardiner 2017). A foremost priority of the national eco- nomic policy is to maintain London competitiveness, while disproportionately less attention is paid to the potential comparative advantages and growth prospects of northern regions and centres.
Martin et al. (2016) propose five novel elements for a policy model favouring a more spatially balanced economic development in the UK. These include decentral- isation and devolution of governance in England; a new institutional framework to coordinate policies for spatial imbalance; decentralisation of public administration and employment; fiscal devolution; and, finally, financial system decentralisation.
Recent policy initiatives toward rebalancing are rather fragmented and ad hoc. Ac- cording to McCann (2016, p. 454), ‘Whitehall exhibits only a very limited ability to think spatially’. Nonetheless, recent regional economic trends suggest that central governance is not sufficiently committed to reduce the increasing spatial disparities, and better tendencies will not arise until radical, comprehensive changes will occur in favour of peripheral regions. Since the phenomenon of large interregional ine- qualities poses a national problem, finding an effective solution is of national inter- est.
Summary
We studied several facets of regional economic disparities in the UK, and pre- sented various evidences underlying the tendencies for increasing spatial imbalances before, during, and after the economic crisis. Data mostly support the well-known phenomenon of the North-South divide in terms of production and labour market developments, with Scotland representing the most significant exception. The economy of London and the South East definitely dominates the country’s econom- ic landscape and poses a great challenge for the national policy. During the recovery after the recession, south-eastern regions proved relatively resilient, while northern ones have been recovering more slowly. The primary reasons behind this are the difference in the dependence on the public sector and the vulnerability to austerity measures. A marked, unexpected, and unprecedented issue of the post-crisis period is the productivity puzzle, where the productivity growth rate substantially deviates from the pre-crisis level and does not tend to improve. Output growth is largely based on employment growth, while productivity has been mainly stagnant, and real wages have fallen dramatically.
Presently, the ‘regional problem’ poses challenges for the economic development of the whole nation and requires active policy attention. There are some significant, promising policy initiatives for powering up less prosperous regions and cities; how- ever, these measures might not be sufficiently radical, effective, convincing, and coherent. The economic performance of the UK as a whole is excessively depend- ent on London and the financial sector. As a result, national economic policy places too little attention on the potential competitive advantages of northern regions and subordinates northern interests for the sake of London’s prosperity. Some aspects of the mechanisms behind regional inequalities were not investigated in this study, including disparities on the housing market, innovation, and urban structure. These issues leave room for further research.
Acknowledgements
This study has been prepared with the support of the project No. K_120004 of the Hungar- ian National Research, Development and Innovation Office. I am grateful to two anony- mous referees for their constructive comments and useful suggestions. All remaining errors are my own.
REFERENCES
ADAMS,J.–ROBINSON,P.–VIGOR,A. (2003): A New Regional Policy for the UK Institute for Public Policy Research, London.
ANNONI,P.–DIJKSTRA,L.–GARGANO,N. (2017): The EU Regional Competitiveness Index 2016 European Commission Working Papers No. WP02/2017. European Commission http://ec.europa.eu/regional_policy/sources/docgener/work/
201701_regional_competitiveness2016.pdf (downloaded: 08 June 2017)
ARMSTRONG,J.–MCLAREN,J. (2014): Scotland’s economic performance and the fiscal impli- cations of moving to independence National Institute Economic Review 227 (1):
R3–R13.
BAKER,A.R.H.–BILLINGE,M.D. (eds.) (2004): Geographies of England: the North-South Divide – Imagined and Material Cambridge University Press, Cambridge.
BARNETT,A.–BATTEN,S.–CHIU,A.–FRANKLIN,J.–SEBASTIÁ-BARRIEL,M. (2014): The UK productivity puzzle Bank of England Quarterly Bulletin Q2: 114–128.
BELL,D.N.F.–EISER,D. (2016): Migration and fiscal policy as factors explaining the labour- market resilience of UK regions to the Great Recession Cambridge Journal of Regions, Economy and Society 9 (1): 197–215.
BILLINGTON,N. (2011): Cheshire & Warrington Local Economic Assessment Cheshire East Council, Cheshire West & Chester Council, Warrington Borough Council, Cheshire & Warrington Enterprise Commission. June 2011 (V5 - 10/6/11 ver- sion). consult.cheshirewestandchester.gov.uk/file/2805199 (downloaded: 08 June 2017)
BOREN,Z.D. (2015): Most productive places in the UK: Londoners do the most for the British economy, says ONS data Independent. http://www.independent.co.uk /news/uk/home-news/most-productive-places-in-the-uk-londoners-do-the- most-for-the-british-economy-says-ons-data-10057567.html (downloaded: 08 June 2017)
CAMERON,D. (2010): Transforming the British economy: Coalition strategy for economic growth Transcript of Speech, Prime Minister’s Office, London.
CITY OF LONDON CORPORATION (2011): London’s Competitive Place in the UK and Glob- al Economies Research Report, City of London Corporation, London.
FINGLETON, B.–GARRETSEN, H.–MARTIN, R. (2012): Recessionary shocks and regional employment: evidence on the resilience of UK regions Journal of Regional Sci- ence 52 (1): 109–133.
GANESH,J. (2015): Disunited kingdom: London in a world of its own The Financial Times 2 March, London.