Full Terms & Conditions of access and use can be found at
http://www.tandfonline.com/action/journalInformation?journalCode=ijmf20
The Journal of Maternal-Fetal & Neonatal Medicine
ISSN: 1476-7058 (Print) 1476-4954 (Online) Journal homepage: http://www.tandfonline.com/loi/ijmf20
Predictors of caesarean section – a cross-sectional study in Hungary
Loránd Rénes, Nikoletta Barka, Zita Gyurkovits, Edit Paulik, Gábor Németh &
Hajnalka Orvos
To cite this article: Loránd Rénes, Nikoletta Barka, Zita Gyurkovits, Edit Paulik, Gábor Németh & Hajnalka Orvos (2018) Predictors of caesarean section – a cross-sectional study in Hungary, The Journal of Maternal-Fetal & Neonatal Medicine, 31:3, 320-324, DOI:
10.1080/14767058.2017.1285888
To link to this article: https://doi.org/10.1080/14767058.2017.1285888
Accepted author version posted online: 23 Jan 2017.
Published online: 08 Feb 2017.
Submit your article to this journal
Article views: 91
View related articles
View Crossmark data
ORIGINAL ARTICLE
Predictors of caesarean section – a cross-sectional study in Hungary
Lorand Renesa, Nikoletta Barkab, Zita Gyurkovitsa, Edit Paulikb, Gabor Nemetha and Hajnalka Orvosa
aDepartment of Obstetrics and Gynaecology, University of Szeged, Szeged, Hungary;bDepartment of Public Health, University of Szeged, Szeged, Hungary
ABSTRACT
Purpose:The aim of this study was to analyse the factors associated with caesarean section (CS) at the Department of Obstetrics and Gynaecology, University of Szeged, Hungary.
Study design:Data collection was based on self-administered questionnaire and medical records related to the deliveries in the year of 2014. Maternal age, education level, marital status, pre- gestational body mass index (BMI), infertility treatment, previous CS, gestational diabetes mellitus (GDM), pre-pregnancy hypertension and pregnancy-induced hypertension (HT/PIH) were exam- ined. The participation rate was 67.3%, multiple pregnancies and questionnaires with missing data were excluded (n¼1493). Univariate and multivariate comparisons were performed.
Results:There were 1125 (45.4%) CSs out of 2479 deliveries. CS rate: 40.0%. Underweight 109 (7.1%), normal 921 (60.2%), overweight 320 (20.9%) obese 181 (11.8%). HT/PIH: 7.6% (n¼117), GDM: 10.1% (n¼155). The odds of CS were significantly higher among obese mothers (OR: 1.81) compared with the normal weight group. Increasing maternal age (OR: 0.97) and being under- weight (OR: 0.59) significantly decreased, previous CS (OR: 12.19), infertility treatment (OR: 1.91) and HT/PIH (OR: 1.87) significantly increased the probability of CS.
Conclusions:Pre-gestational obesity, infertility treatment, previous CS and HT/PIH had significant effect on the mode of delivery.
ARTICLE HISTORY Received 6 November 2016 Revised 17 January 2017 Accepted 19 January 2017
KEYWORDS
Caesarean section; obesity;
body mass index; infertility treatment; hypertension
Introduction
Irrespective of the WHO statement (2015) [1] on the recommended rate for caesarean sections (CSs) – which must not exceed 10% of all deliveries–, the per- centage of the procedure has been rapidly increasing in the past three decades in developed countries [2,3].
While the method is mainly overused in the middle and high-income countries, lower rates of CS can be observed in developing regions. In the latter, poorly equipped medical institutions, and a high risk of intra- and postoperative complications are the causes of the low rate.
In Hungary, the CS rate was in the recommended range from 1994 to 1997, but today, similar to other developed countries, a rapid increase has occurred. In 2014, the CS rate was 37.0% throughout the country [4], while at the Department of Obstetrics and Gynaecology, University of Szeged, the percentage of CS stood at 45.4%. This number was significantly higher than the Hungarian average, thus a deeper investigation of the factors influencing CS was deemed necessary at the Department.
The risk factors of CS were studied previously from different aspects. Several authors found connection between increasing body mass index (BMI) and CS rates [5–19], and stated that high BMI is one of the major risk factors for operative delivery. Based on a meta-analysis of 33 studies, the odds ratio of CS was increased by 1.53 in the overweight, 2.26 in the obese and 3.38 in the morbidly obese groups [5]. After a pre- vious CS, the chance of vaginal delivery (VD) was sig- nificantly decreased in obesity; in spite of this, surgical site infectious complications increased [20]. Denison et al. stated that high first trimester BMI and greater increase in BMI during pregnancy were associated with longer gestation and an increased risk of post- term pregnancy, based on a population of 186,087 in Sweden [6].
Today, the Hungarian population has become heav- ily overweight and obese in every age group. Among adolescents, 29% of boys and 18% of girls were over- weight. In the adult population (20 years), the rate of overweight and obese people was 62%, and within this, the obese represented 27.6%. Based on the latest
CONTACTLorand Renes renes.lorand@med.u-szeged.hu Department of Obstetrics and Gynaecology, University of Szeged, Semmelweis Street 1, 6725 Szeged, Hungary
ß2017 Informa UK Limited, trading as Taylor & Francis Group VOL. 31, NO. 3, 320–324
http://dx.doi.org/10.1080/14767058.2017.1285888
estimates in the countries of the European Union (EU), overweight and obesity affect 30–70% and 10–30% of the adults, respectively. Hungary is the eighth in line of prevalence of obesity in the EU region [WHO Country profile, 2008].
Deliveries of in vitro fertilisation and embryo trans- fer (IVF-ET) pregnancies have an increased rate of CS [21]. Beside high BMI, previous CS also increases the rate of operative deliveries in consecutive pregnancies [17,22].
Considering the increasing trend of CS, and the high rate at our Department, the aim of this study was to analyse the factors associated with CS at the Department of Obstetrics and Gynaecology, University of Szeged, Hungary.
Material and methods
A cross-sectional study was conducted among women having their newborns in 2014 at the Department of Obstetrics and Gynaecology, University of Szeged. The study design was developed in cooperation with the Department of Public Health. Data collection was based on a self-administered questionnaire and the health documentation of mothers and newborns.
Participation was offered to each woman who could voluntarily decide to participate. The number of deliv- eries was 2479 in the study period. Altogether 1669 women filled in the questionnaire one or two days after the delivery; the participation rate was 67.3%.
The questionnaires related to multiple pregnancies (54 women) were excluded from the analyses, and we omitted 67 respondents from the study because of missing data on key sociodemographic characteristics (e.g., age), leaving a total sample of 1548. Additional 17 respondents were excluded because of their incom- plete medical records; the remaining size of the sam- ple is 1531 persons from the point of the mode of delivery. In case of cross-tables the percentages based on the actual number of respondents. Finally, due to additional missing answers only 1493 cases were involved in the multivariable analyses.
The self-administered questionnaire comprised mothers’sociodemographic characteristics (age, educa- tion level, marital status), lifestyle (smoking, alcohol consumption, physical activity), dietary factors and pregnancy-related variables of women (previous preg- nancies, abortions, etc.) before and during their preg- nancy. Maternal age at delivery was categorised as 24, 25–29, 30–34 and35 years. Education was cate- gorised into three levels, such as low (primary school, trade school), medium (secondary school) and high (college, university). Marital status was divided into
two subgroups: single or married; the latter included common-law marriages, too.
The mothers’obstetrical data–gestational age, pre- gestational BMI, infertility treatment, previous CS, HT/
PIH and GDM– were taken from the medical records.
BMI was calculated and classified according to the WHO classification underweight (<18.50 kg/m2), nor- mal range (18.50–24.99 kg/m2), overweight (25.00–29.99 kg/m2) and obesity (>30.00 kg/m2) [20].
Patients were checked if there was any kind of infertil- ity treatment, such as ovulation induction/artificial insemination and/or in vitro fertilisation and embryo transfer (IVF-ET). The number of previous CS(s) was reported by the mothers. Chronic diseases– hyperten- sion and diabetes mellitus – diagnosed in the frame- work of pregnancy care were also registered.
Hypertension was verified if systolic blood pressure 140 Hgmm and/or diastolic blood pressure 90 Hgmm at 20 weeks of gestation. These blood pres- sure results should be verified on at least two occa- sions at least 6 h apart (Hungarian Ministry of Human Resources, 2002). During the recruitment, we did not differentiate between pre-pregnancy hypertension (HT) and pregnancy induced hypertension (PIH). GDM was diagnosed by the WHO verified 75 g oral glucose toler- ance test (OGTT). Cut off points are 7.0 mmol/l, for fasting plasma glucose level, and/or 7.8 mmol/l, at 2-h plasma glucose level. Tests were performed between the 24–28th weeks of gestation (in case of high risk for GDM, previously same OGTT was performed between the 16–18th weeks of gestation, according to the recommendations of the Hungarian Diabetes Society and the Board College of Obstetrics and Gynaecology, 2016). Other parameters that are not involved into the present analysis such as abnormal placentation, contraction disorders, use of epidural analgesia etc. were also collected from the medical records.
Simple descriptive statistics were used to describe the overall characteristics of the sample. Univariate comparisons were performed by v2-tests. Multivariate comparisons were assessed by logistic regression ana- lysis. Forward stepwise logistic regression analysis was used to assess the independent contribution of demo- graphic, health-related and obstetrical factors of actual CS. The independent factors we studied were mothers’ age, education level, marital status, pre-gestational BMI, gestational age, infertility treatment, number of previous CS(s), HT/PIH and GDM. Maternal age, num- ber of previous CS(s) and weeks of gestation were continuous variables in the model. The determinations of the logistic regression models were based on the Hosmer–Lemeshow goodness-of-fit tests for each
THE JOURNAL OF MATERNAL-FETAL & NEONATAL MEDICINE 321
dependent variable [23]. Statistical significance was defined at p<0.05. Odds ratios (ORs) and 95% confi- dence intervals (CIs) were calculated for each variable.
Data analyses were performed with the IBM SPSS ver- sion 23 (Armonk, NY).
The study protocol was approved by the Regional and Institutional Human Medical Biological Research Ethics Committee of the University of Szeged (No:
201/2013). Informed written consent was obtained from each participant of the study. The staff distribut- ing the questionnaire emphasised that participation in the survey was entirely voluntary. It was explained that participants could withdraw at any time, particu- larly if they were illiterate or simply did not want to participate, and that such a decision would have no consequences on their clinical management.
Results
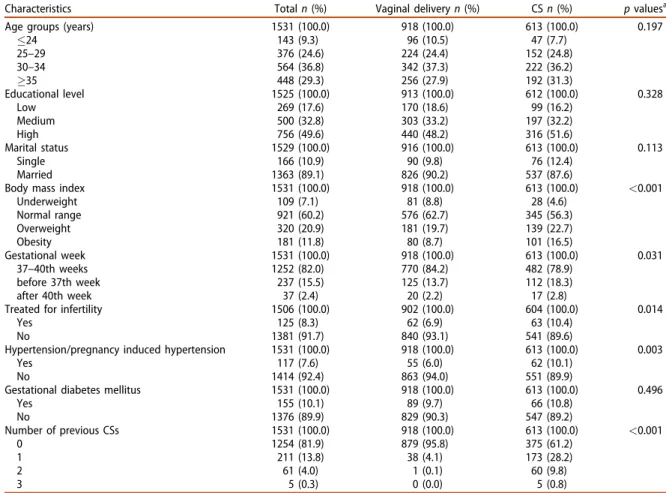
In the period studied, in 2014, there were 2479 deliv- eries at the Department of Obstetrics and Gynaecology, from which the number of CSs was 1125 (45.4%). In our sample (n¼1531), the CS rate was 40.0%. The characteristics of the total sample and the
distributions by the mode of actual delivery are shown byTable 1.
In the univariate analyses, no significant differences were found in connection with the mothers’ age group, educational level and marital status according to the mode of the delivery (vaginal vs. CS). In terms of chronic diseases, CS was more prevalent in case of HT/PIH (10.1% vs. 6.0%), while no significant difference was found in case of GDM (10.8% vs. 9.7%). Pre-gesta- tional BMI, infertility treatment and the presence of previous CS in the anamnesis showed significant asso- ciation with the mode of delivery.
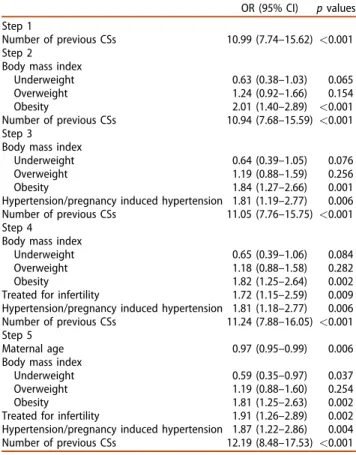
The results of multivariate regression analysis are presented in Table 2. All the factors shown in Table 1 were involved in the forward stepwise logistic regres- sion model. The most significant predictor was a previ- ous CS selected on Step 1. Body mass index was entered on Step 2, HT/PIH on Step 3, infertility treat- ment on Step 4 and maternal age on Step 5. The final model was reached by Step 5. Sociodemographic vari- ables (education, marital status), gestational week and GDM had no significant effect on the mode of deliv- ery; these factors were not entered into the multivari- ate regression model. Based on Step 5, the main
Table 1. Characteristics of mothers and mode of delivery.
Characteristics Totaln(%) Vaginal deliveryn(%) CSn(%) pvaluesa
Age groups (years) 1531 (100.0) 918 (100.0) 613 (100.0) 0.197
24 143 (9.3) 96 (10.5) 47 (7.7)
25–29 376 (24.6) 224 (24.4) 152 (24.8)
30–34 564 (36.8) 342 (37.3) 222 (36.2)
35 448 (29.3) 256 (27.9) 192 (31.3)
Educational level 1525 (100.0) 913 (100.0) 612 (100.0) 0.328
Low 269 (17.6) 170 (18.6) 99 (16.2)
Medium 500 (32.8) 303 (33.2) 197 (32.2)
High 756 (49.6) 440 (48.2) 316 (51.6)
Marital status 1529 (100.0) 916 (100.0) 613 (100.0) 0.113
Single 166 (10.9) 90 (9.8) 76 (12.4)
Married 1363 (89.1) 826 (90.2) 537 (87.6)
Body mass index 1531 (100.0) 918 (100.0) 613 (100.0) <0.001
Underweight 109 (7.1) 81 (8.8) 28 (4.6)
Normal range 921 (60.2) 576 (62.7) 345 (56.3)
Overweight 320 (20.9) 181 (19.7) 139 (22.7)
Obesity 181 (11.8) 80 (8.7) 101 (16.5)
Gestational week 1531 (100.0) 918 (100.0) 613 (100.0) 0.031
37–40th weeks 1252 (82.0) 770 (84.2) 482 (78.9)
before 37th week 237 (15.5) 125 (13.7) 112 (18.3)
after 40th week 37 (2.4) 20 (2.2) 17 (2.8)
Treated for infertility 1506 (100.0) 902 (100.0) 604 (100.0) 0.014
Yes 125 (8.3) 62 (6.9) 63 (10.4)
No 1381 (91.7) 840 (93.1) 541 (89.6)
Hypertension/pregnancy induced hypertension 1531 (100.0) 918 (100.0) 613 (100.0) 0.003
Yes 117 (7.6) 55 (6.0) 62 (10.1)
No 1414 (92.4) 863 (94.0) 551 (89.9)
Gestational diabetes mellitus 1531 (100.0) 918 (100.0) 613 (100.0) 0.496
Yes 155 (10.1) 89 (9.7) 66 (10.8)
No 1376 (89.9) 829 (90.3) 547 (89.2)
Number of previous CSs 1531 (100.0) 918 (100.0) 613 (100.0) <0.001
0 1254 (81.9) 879 (95.8) 375 (61.2)
1 211 (13.8) 38 (4.1) 173 (28.2)
2 61 (4.0) 1 (0.1) 60 (9.8)
3 5 (0.3) 0 (0.0) 5 (0.8)
aBased on chi-square test.
predictors of actual CS were previous CS, HT/PIH, infer- tility treatment, pre-gestational obesity and maternal age. The probability of CS significantly increased with the number of previous CS(s) (OR: 12.19, 95% CI:
8.48–17.53). Pre-pregnancy nutritional status of moth- ers had various effects: being underweight significantly lowered (OR: 0.59, 95% CI: 0.35–0.97), while obesity increased the odds of CS (OR: 1.81, 95% CI: 1.25–2.63).
The actual CS significantly related to the infertility treatment before the current pregnancy: the odds of CS were two times higher among women treated for infertility (OR: 1.91, 95% CI: 1.26–2.89). The risk of HT/
PIH also increased the odds of CS (OR: 1.87, 95% CI:
1.22–2.86). The odds of CS decreased by the maternal age in years (OR: 0.97, 95% CI: 0.95–0.99).
Discussion
The increasing rate of CS is a worldwide phenomenon, both in the developed and the developing countries [2,3]. Our findings revealed that previous CS, obesity, HT/PIH and infertility treatment significantly increased the CS rates. In our study, we have shown that beyond the previously mentioned risk factors, which increased
the incidence CS, the underweight pregnant group significantly lowered the risk for CS. On the contrary, education level, marital status and GDM showed no association with CS. Although for the overweight group CS was more frequent, it could not reach the level of significance.
Risk factors are numerous, and among these previ- ous CS(s) and high BMI have huge impacts. Previous studies also found significant difference in CS rates in case of obesity [5–19] and previous CS [16,22]. The risk and odds ratios vary from study to study; increased by 50% in the overweight group, and doubled for obese women [5], also, rates for CS are 33.8% in the obese and 47.4% in the morbidly obese groups [8].
Multiparous women experiencing an interpregnancy change of BMI 3 have a higher chance of CS in the next delivery [7].
Not only the rate of operative delivery is increasing with BMI, but also as an independent risk factor in CS, the surgical site infection is more common [20]. In case of GDM most of the studies found significant increase in CS rate [16,22], although in our findings it did not reach the level of significance.
In conclusion, among many observed factors for CS, BMI, previous CS(s) and infertility treatment were the most important predictors of operative delivery.
In view of our findings, the best option for preven- tion is to reach the ideal pre-gestational (normal) BMI level. The ultimate goal would be to maintain a nor- mal BMI not only in the pre-gestational period but also throughout childhood and adulthood. It is best not to let children become overweight and obese, so prevention of high CS rates should be started at early ages, optimally, in elementary school. With this, the decreasing chance of CS also reduces the rate of fur- ther CS in the next pregnancy. IVF-ET is much com- mon among nulliparous women at a higher age (because most highly educated women pursue their careers, and this takes their fertile years), thus deliver- ing the first child before the age of 30 can also decrease the chance of CS. For this, we took the data of all the deliveries in 2014 at the department. Based on the results, we were able to identify the risk factors for CS, and as a result, there is a chance of preventing the further increment of operative delivery rate.
A limitation of the study is that the forms were filled in by the patients (though content was revised and corrected against the medical records by a spe- cialist), thus the information could be inaccurate (e.g., weight gain during pregnancy), and we lost several patients (n¼122), because of missing data. We did not differentiate between nulliparous and multiparous women.
Table 2. Results of forward stepwise logistic regression.
OR (95% CI) pvalues Step 1
Number of previous CSs 10.99 (7.74–15.62) <0.001 Step 2
Body mass index
Underweight 0.63 (0.38–1.03) 0.065
Overweight 1.24 (0.92–1.66) 0.154
Obesity 2.01 (1.40–2.89) <0.001
Number of previous CSs 10.94 (7.68–15.59) <0.001 Step 3
Body mass index
Underweight 0.64 (0.39–1.05) 0.076
Overweight 1.19 (0.88–1.59) 0.256
Obesity 1.84 (1.27–2.66) 0.001
Hypertension/pregnancy induced hypertension 1.81 (1.19–2.77) 0.006 Number of previous CSs 11.05 (7.76–15.75) <0.001 Step 4
Body mass index
Underweight 0.65 (0.39–1.06) 0.084
Overweight 1.18 (0.88–1.58) 0.282
Obesity 1.82 (1.25–2.64) 0.002
Treated for infertility 1.72 (1.15–2.59) 0.009 Hypertension/pregnancy induced hypertension 1.81 (1.18–2.77) 0.006 Number of previous CSs 11.24 (7.88–16.05) <0.001 Step 5
Maternal age 0.97 (0.95–0.99) 0.006
Body mass index
Underweight 0.59 (0.35–0.97) 0.037
Overweight 1.19 (0.88–1.60) 0.254
Obesity 1.81 (1.25–2.63) 0.002
Treated for infertility 1.91 (1.26–2.89) 0.002 Hypertension/pregnancy induced hypertension 1.87 (1.22–2.86) 0.004 Number of previous CSs 12.19 (8.48–17.53) <0.001 Reference categories: no infertility treatment, no HT/PIH, normal weight.
Continuous variables: maternal age, number of previous CSs, weeks of gestation.
THE JOURNAL OF MATERNAL-FETAL & NEONATAL MEDICINE 323
We supposed that women, who did not participate in the study, or gave incomplete questionnaire mostly were the mothers of newborns having congenital birth defects and/or preterm deliveries. We presume that the fear of being “guilty” or responsible for the prob- lem lead them not to participate.
Disclosure statement
The authors certify that they have no affiliations with or involvement in any organization or entity with any financial interest or non-financial interest in the sub- ject matter or materials discussed in this manuscript.
ORCID
Gabor Nemeth http://orcid.org/0000-0003-1829-3457
References
1. Betran AP, Torloni MR, Zhang JJ, G€ulmezoglu AM.
WHO Working Group on Caesarean Section. WHO statement on caesarean section rates. BJOG 2016;123:
667–70.
2. Betran AP, Ye J, Moller AB, et al. The increasing trend in caesarean section rates: global, regional and national estimates: 1990-2014. PLoS One 2016;11:
e0148343. doi: 10.1371/journal.pone.0148343
3. Vogel JP, Betran AP, Vindevoghel N, WHO Multi- Country Survey on Maternal and Newborn Health Research Network, et al. Use of the Robson classifica- tion to assess caesarean section trends in 21 countries:
a secondary analysis of two WHO multicountry surveys.
Lancet Glob Health 2015;3:e260–70. doi: 10.1016/
S2214-109X(15)70094-X.
4. Hungarian Central Statistical Office, 2014. (https://
www.ksh.hu/?lang¼en).
5. Poobalan AS, Aucott LS, Gurung T, et al. Obesity as an independent risk factor for elective and emergency caesarean delivery in nulliparous women– systematic review and meta-analysis of cohort studies. Obes Rev 2009;10:28–35.
6. Denison FC, Price J, Graham C, et al. Maternal obesity, length of gestation, risk of postdates pregnancy and spontaneous onset of labour at term. BJOG 2008;115:
720–5.
7. Knight-Agarwal CR, Williams LT, Davis D, et al.
Association of BMI and interpregnancy BMI change with birth outcomes in an Australian obstetric popula- tion: a retrospective cohort study. BMJ Open 2016;6:
e010667.
8. Weiss JL, Malone FD, Emig D, et al. Obesity, obstetric complications and cesarean delivery rate — a popula- tion-based screening study. Am J Obstet Gynecol 2004;190:1091–7.
9. Al-Kubaisy W, Al-Rubaey M, Al-Naggar RA, et al.
Maternal obesity and its relation with the cesarean sec- tion: a hospital based cross sectional study in Iraq.
BMC Pregnancy Childbirth 2014;14:235.
10. Kabiru W, Raynor BD. Obstetric outcomes associated with increase in BMI category during pregnancy. Am J Obstet Gynecol 2004;191:928–32.
11. Doherty DA, Magann EF, Francis J, et al. Pre-pregnancy body mass index and pregnancy outcomes. Int J Gynaecol Obstet 2006;95:242–7.
12. O’Dwyer V, Farah N, Fattah C, et al. The risk of caesar- ean section in obese women analysed by parity. Eur J Obstet Gynecol Reprod Biol 2011;158:28–32.
13. Kwon HY, Kwon JY, Park YW, Kim YH. The risk of emer- gency cesarean section after failure of vaginal delivery according to prepregnancy body mass index or gesta- tional weight gain by the 2009 Institute of Medicine guidelines. Obstet Gynecol Sci 2016;59:169–77.
14. Lee HR, Kim MN, You JY, et al. Risk of cesarean section after induced versus spontaneous labor at term gesta- tion. Obstet Gynecol Sci 2015;58:346–52.
15. Vinturache A, Moledina N, McDonald S, et al. Pre-preg- nancy body mass index (BMI) and delivery outcomes in a Canadian population. BMC Pregnancy Childbirth 2014;14:422.
16. Dzakpasu S, Fahey J, Kirby RS, et al. Contribution of prepregnancy body mass index and gestational weight gain to caesarean birth in Canada. BMC Pregnancy Childbirth 2014;14:106.
17. Al Busaidi I, Al-Farsi Y, Ganguly S, Gowri V. Obstetric and non-obstetric risk factors for cesarean section in Oman. Oman Med J 2012;27:478–81.
18. Beyer DA, Amari F, L€udders WD, et al. Obesity decreases the chance to deliver spontaneously. Arch Gynecol Obstet 2011;283:981–8.
19. Chu SY, Kim SY, Schmid CH, et al. Maternal obesity and risk of cesarean delivery: a meta-analysis. Obes Rev 2007;8:385–94.
20. Lakhan P, Doherty J, Jones M, Clements A. A system- atic review of maternal intrinsic risk factors associated with surgical site infection following caesarean sec- tions. Aust Inf Contr 2010;15:35–41.
21. Sheiner E, Shoham-Vardi I, Hershkovitz R, et al.
Infertility treatment is an independent risk factor for cesarean section among nulliparous women aged 40 and above. Am J Obstet Gynecol 2001;185:888–92.
22. Patel RR, Peters TJ, Murphy DJ. ALSPAC Study Team.
Prenatal risk factors for caesarean section. Analyses of the ALSPAC cohort of 12,944 women in England. Int J Epidemiol 2005;34:353–67.
23. Hosmer DW, Lemeshow S. Applied logistic regression.
1st ed. New York: John Wiley and Sons; 1989.