CERS-IE WORKING PAPERS | KRTK-KTI MŰHELYTANULMÁNYOK
INSTITUTE OF ECONOMICS, CENTRE FOR ECONOMIC AND REGIONAL STUDIES, BUDAPEST, 2020
Do individuals with children value the future more?
DÁNIEL HORN - HUBERT JÁNOS KISS
CERS-IE WP – 2020/10
February 2020
https://www.mtakti.hu/wp-content/uploads/2020/02/CERSIEWP202010.pdf
CERS-IE Working Papers are circulated to promote discussion and provoque comments, they have not been peer-reviewed.
Any references to discussion papers should clearly state that the paper is preliminary.
Materials published in this series may be subject to further publication.
ABSTRACT
In recent years public and political debate suggested that individuals with chil- dren value the future more. We attempt to substantiate the debate and using a representative survey we investigate if the number of children (or simply having children) indeed is associated with a higher valuation of the future that we proxy with an aspect of time preferences, patience. We find that in general there is no correlation between having children and patience, though for young women with below-median income we find some weak evidence in line with the conjecture. We also show some evidence that for this subpopulation it is not having children that matters, but marital status. More precisely, young single women are less patient than other young non- single women.
JEL codes: D91, J13
Keywords: Children, Patience, Time preferences.
Horn Dániel
KRTK KTI, 1097 Budapest, Tóth Kálmán u. 4.
and
Budapesti Corvinus Egyetem, 1093 Budapest, Fővám tér 8 e-mail: horn.daniel@krtk.mta.hu
Kiss Hubert János
KRTK KTI, 1097 Budapest, Tóth Kálmán u. 4.
and
Budapesti Corvinus Egyetem, 1093 Budapest, Fővám tér 8
e-mail: kiss.hubert.janos@krtk.mta.hu
A gyermekes egyének fontosabbnak értékelik a jövőt?
HORN DÁNIEL - KISS HUBERT JÁNOS
ÖSSZEFOGLALÓ
Az utóbbi években folytatott politikai viták és a közbeszéd is azt sugallta, hogy a gyermekes egyének fontosabbnak értékelik a jövőt. Reprezentatív felmérés adatai segítségével igyekszünk hozzájárulni a vitához azt vizsgálva, hogy a gyermekek száma (vagy egyszerűen a gyermekek léte) valóban együttmozog-e azzal, hogy miként értékeljük a jövőt, amit az időpreferenciák egyik vetületével, a türelemmel mérünk. Azt találjuk, hogy általában nincs összefüggés a türelem és aközött, hogy valakinek van-e gyermeke, bár fiatal és medián jövedelem alatti nők esetében találunk némi nyomot, hogy ilyen kapcsolat létezhet. Azt is megmutatjuk, hogy ebben a csoportban nem az számít, hogy van-e valakinek gyermeke, hanem inkább a családi állapot. Pontosabban, a fiatal egyedülálló nők kevésbé türelmesek, mint a fiatal nem egyedülálló nők.
JEL: D91; J13
Kulcsszavak: gyerekek, időpreferencia, türelem
Do individuals with children value the future more? ∗
D´ aniel Horn
§, Hubert J´ anos Kiss
¶Abstract
In recent years public and political debate suggested that individuals with chil- dren value the future more. We attempt to substantiate the debate and using a representative survey we investigate if the number of children (or simply having children) indeed is associated with a higher valuation of the future that we proxy with an aspect of time preferences, patience. We find that in general there is no correlation between having children and patience, though for young women with below-median income we find some weak evidence in line with the conjecture. We also show some evidence that for this subpopulation it is not having children that matters, but marital status. More precisely, young single women are less patient than other young non-single women.
JEL classifications: D91, J13.
Keywords: Children, Patience, Time preferences.
∗We are very grateful to participants of research seminar at the Institute of Economics of the Hun- garian Academy of Sciences. The usual disclaimers apply.
§MTA KRTK KTI and Corvinus University of Budapest. E-mail: horn.daniel@krtk.mta.hu. Finan- cial support from the National Research, Development & Innovation (NKFIH) under project K 124396 is gratefully acknowledged.
¶MTA KRTK KTI and Corvinus University of Budapest. E-mail: kiss.hubert.janos@krtk.mta.hu.
Financial support from the Spanish Ministry of Economy, Industry and Competitiveness under the project ECO2017-82449-P and from the National Research, Development & Innovation (NKFIH) under project K 119683 is gratefully acknowledged.
1 Introduction
In May, 2013 related to Keynes’s famous claim “In the long run we are all dead.” the renowned historian, Niall Ferguson remarked mordantly that because John Maynard Keynes was childless, he did not really care about the long run. He added that long term was only of interest to those who have children. He later apologized for his harsh words, stating that people who do not have children also care about the future.1 However, there were some commentators that supported Ferguson’s view that having children is related to how one views the future.2
In 2016, after the Brexit referendum David Cameron resigned and the Conservative party was looking for a new prime minister. One of the candidates was Andrea Leadsom who said that being a mother makes her a better candidate for prime minister than Theresa May because it means that she has “a very real stake” in the future of Britain.
She claimed that contrary to Theresa May ”I have children who are going to have children who will directly be a part of what happens next.”3 In a similar vein, during the campaign in the 2017 French election Jean-Marie Le Pen told of Emmanuel Macron that ”He talks to us about the future, but he doesn’t have children!”4Many other articles dealt with the fact that leaders (or ex-leaders) of many other important countries are also childless (e.g. the German Chancellor Angela Merkel, Dutch Prime Minister Mark Rutte, Swedish Prime Minister Stefan Lofvren, Luxembourg Prime Minister Xavier Bettel, Scottish First Minister Nicola Sturgeon, and European Commission President Jean-Claude Juncker) and hence do not have a long-term view.5
Based on the previous examples, it seems that many individuals believe that having children is associated with how individuals value the future. However, research on this conjectured association is almost non-existing. In order to contribute to the debate, we use representative survey data from Hungary and attempt to see if the previous conjecture holds. We proxy the valuation of the future with an aspect of time preferences, patience. The survey contains extensive demographic data, including many items related to family. We introduced into the survey questions that measure patience using multiple price lists. The main question in this paper is if the number of children (or the fact of having children) is related to how the respondent values the future. First, we investigate through simple correlations if there is some association between patience and the number of children. Then we carry out a regression analysis to control for a host of factors that may be hidden in simple correlations. As a robustness check, we also carry out the same
1See, https://www.theguardian.com/books/2013/may/04/niall-ferguson-apologises-gay-keynes or http://www.niallferguson.com/blog/an-unqualified-apology. Retrieved 4 February 2020
2See, for instance comments by Jerry Bowyer at https://www.forbes.com/sites/jerrybowyer/2013/05/12/perhaps- niall-ferguson-had-a-point-about-keynes/74240a461683. Retrieved 4 February 2020
3See https://www.thetimes.co.uk/edition/news/being-a-mother-gives-me-edge-on-may-leadsom- 0t7bbm29x. Retrieved 4 February 2020
4See http://www.newyorker.com/news/daily-comment/emmanuel-macron-and-the-modern-family.
Or, https://www.thetimes.co.uk/article/childless-macron-not-fit-to-lead-says-le-pen-zvj97qgs5. Both retrieved 4 February 2020
5For instance, James McPherson in the Washington Examiner asks “Do childless political leaders have skin in the game long-term?”. See http://www.washingtonexaminer.com/emmanuel-macron-and- the-barren-elite-of-a-changing-continent/article/2622925. Retrieved 4 February 2020
analysis using a dummy for having children instead of the number of children.
We report three findings. First, in general patience is not associated with the number of children, without and also with additional controls. Second, in line with Bauer and Chytilov´a (2013) we document that in the case of young women with a low income the relationship holds at least weakly. Third, our investigation reveals that marital status, more precisely being single or not correlates with patience for women (but not for men).
Once we control for marital status, children cease to be associated with patience. When we focus on having children, we find qualitatively the same results.
The rest of the paper is structured as follows. Section 2 reviews the literature.
Section 3 presents the data, while section 4 contains the statistical analysis with the results. Section 5 concludes.
2 Literature review
Patience has been shown to be an importantdeep determinant of economic development (e.g., Olsson and Hibbs Jr, 2005; Spolaore and Wacziarg, 2009; Algan and Cahuc, 2010;
Ashraf and Galor, 2013; Alsan, 2015; Dohmen et al., 2018), higher level of patience being associated with higher income (or income growth) both on individual and country level. Therefore, a growing literature seeks to understand the factors that affect time preferences. For instance, Weber (2002) claims the importance of protestantism, Chen (2013) shows the effect of language, while Galor and ¨Ozak (2016) indicate the relevance of agricultural origins in understanding time preferences. Our study represents a con- tribution to this literature by investigating if being a parent may be a factor related to patience.
The literature on this issue is scarce. Concerning climate change that is somewhat related to how much individuals care about the future, Sundblad et al. (2007) show that parenthood does not associate with worries and risk judgment about future climate change. However, Kreibich (2011) finds that individuals who have young children are more likely to undertake precautionary measures against climate change. The paper that is closest to ours is Bauer and Chytilov´a (2013) who investigate the factors affect- ing patience and future-oriented choices using an Indian sample. They measure risk and time preferences experimentally and relate these variables to socioeconomic and demographic characteristics. The main focus of their paper is gender differences and its causes, but they also show that women with young child(ren) are significantly more patient than their counterparts without offspring. They also document that women’s patience increases in the number of children up to a point. However, there is no clear relationship between patience and children in the case of men. Moreover, there is no significant difference in patience between men and women with no children. Interest- ingly, it is not the number of children per se that matters, but the number of young children, more concretely sons up to 18 years. Furthermore, the links identified between patience and children are significant only in the case of poor (below median wealth) families. Our study differs in several points from Bauer and Chytilov´a (2013). On the
one hand, we have a representative sample of the population of a whole country instead of a sample of 426 married individuals from southwestern India. which we consider a strength. On the other hand, our sample is from a (middle-income) developed country, so this study is a test if findings from a developing country hold also in more developed countries. Furthermore, Bauer and Chytilov´a (2013) incentivize their measurement of time preferences, while we could not implement an incentivized measurement. However, Branas-Garza et al. (2019) show that the lack or the presence of incentivization does not lead to different results when measuring time preferences.
In section A of the Online Appendix we review briefly how in our representative sur- vey data patience associates with life outcomes. We claim that our measure of patience is appropriate since we confirm most of the findings in the literature between patience and life outcomes in a companion paper (Horn and Kiss, 2019).
3 Data
A quarterly, representative survey of the Hungarian population with a randomized sam- ple of about 1000 adult individuals is carried out by the T ´ARKI Social Research Institute (https://tarki.hu/eng).6 It is based on personal interviews. A substantial part of the survey is asked in each quarter, comprising data on gender, age, family status and struc- ture, level of education, labour market status, individual and family incomes, wealth and financial situation. Importantly, this information allows us to see if the respondent has children and also the number of children.
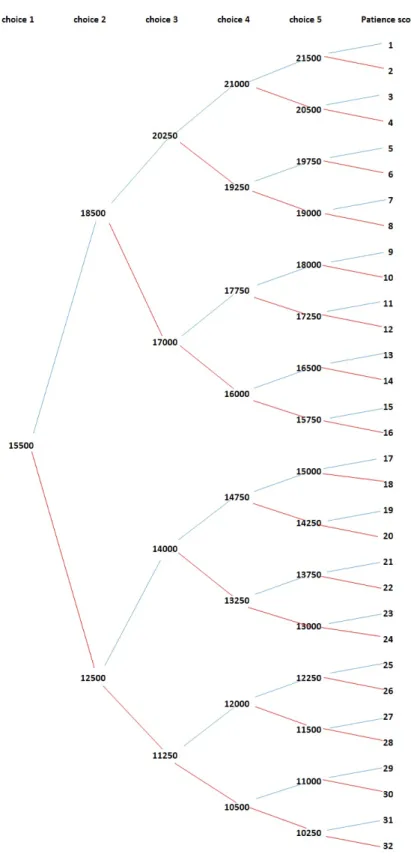
Scholars can introduce questions into the survey at a cost, so we asked T ´ARKI to introduce three items into the first survey in 2017.7 Following Falk et al. (2018), we used the staircase (or unfolding brackets) method (for details see, for instance, Cornsweet, 1962) to measure time preferences with 5 questions, because it is an efficient way to approximate the indifference point between an earlier and a later payoff. We utilized interdependent hypothetical binary choices between 10000 Forints (about 32.2 EUR / 34.4 USD at that time) today or X Forints in a month. We did not change the 10000 Forints during the 5 questions, but we changed the amount X systematically depending on the previous choices. For example, if an individual chooses 10000 Forints today instead of X=15500 Forints in a month, then it shows that she has an indifference point that is larger than 15500 Forints, hence in the next question we increased X. With 5 questions, there are 25 = 32 possible last choices, that we use as a proxy for the indifference point, as we explain later. In section C of the Online Appendix we present the whole structure of the staircase method with the concrete numbers that appeared in the survey.
6T ´ARKI follows strict data protection and security protocols that are in line with the General Data Protection Regulation (GDPR) of the European Union and with national regulation (concretely, the Act CXII of 2011 on the Right of Informational Self-Determination and on Freedom of Information).
More information is available at https://tarki.hu/sites/default/files/2018- 08/Data Protection and Se- curity.pdf.
7Section B in the Online Appendix contains the exact wording of the items.
The future is unavoidably uncertain, so risk attitudes may be confounded with time preferences. Without controlling for risk preferences we may underestimate the effect of time preferences, hence we needed to measure risk preferences. To do so, we followed Sutter et al. (2013) and used a simple question that asked how much of 10000 Forints the respondent would risk in the following gamble. Hypothetically, we draw randomly a ball from a bag that contains 10 black and 10 red balls. The individual has to guess the colour (black or red) of the ball and if she is right, then she receives the double of the risked amount. Otherwise, the bet is lost. We made also clear that hypothetically the individual would receive the amount not risked in the gamble. The amount risked in the gamble can be seen as a proxy of risk attitude.8
The third item that we introduced into the survey was almost identical to the first one, the only difference being the time horizon. In this case, the earlier date was in a year, while the later one in a year and a month. According to the (β, δ)-model (see, for instance Laibson, 1997) the now vs. 1 month task not only measures patience (δ), but also time inconsistency (β), so following the literature we use the third item to measure patience.9 Respondents encountered the preference tasks in the same order as described here.
We calculate our measure of patience in the following way. Based on the last answer of the respondent to the previous ”money earlier or later” questions on the longer horizon, we can infer the indifference point of the respondent. For instance, if the respondent in the last choice prefers the earlier 10000 Fts to the later 16500 Fts, then we know that her indifference point is between 16500 Fts and the next largest amount. For simplicity, we take the lower bound, so we assign to this respondent the indifference point 16500 Ft. Then, her patience (or individual discount factor) is computed as 10000/16500, or in more general termsmoney earlier/money later.10
Importantly, the survey has a wide range of socio-demographic data, including the number of children. We group the rest of the variables as follows. Theexogeneousvari- ables include age, age squared, a female dummy, and if the interviewer believes that the respondent is of Roma origin.11 Theregion variables contain dummies for the regions of Hungary and the type of settlement the respondent lives in.12 Thefamily variables include dummies related to the marital status (single, married, separated, living with partner, widow, divorced). The survey uses a 9-point scale to measure educational at- tainment, ranging from less than elementary schooling to university diploma. From this
8Our proxy is reminiscent of the investment game in Gneezy and Potters (1997). Crosetto and Filip- pin (2016) investigate four risk elicitation methods and show that the investment game is a meaningful way to distinguish individuals according to their risk attitudes.
9The time preference measures on the two horizons are highly correlated (pairwise correlation of 0.67, p-value<0.001). The main finding of the paper - that the number of children and time preferences do not relate - do not change qualitatively if we use the data related to the first item.
10For details, see section C in the Online Appendix.
11It is prohibited by law to ask the ethnicity of the respondent that is why the judgement of the interviewer is use. Being Roma or not may be important to explain time preferences as shown by Mart´ın et al. (2019).
12As for the regions, we have six dummies for the regions of Hungary, the baseline region being Central Hungary. To control for settlement type, we use three dummy variables (town, city, Budapest), the baseline being village.
information we form two education dummies indicating if the respondent has a higher than basic education and if the respondent has a tertiary education degree. Theincome variables provide information on the income level13, on the wealth level14and on finan- cial difficulties15. The last group of variables refers towork and contains information on if the respondent works in the private or the public sector and her employment status (e.g. unemployed, employee, employed, inactive etc.).
4 Results
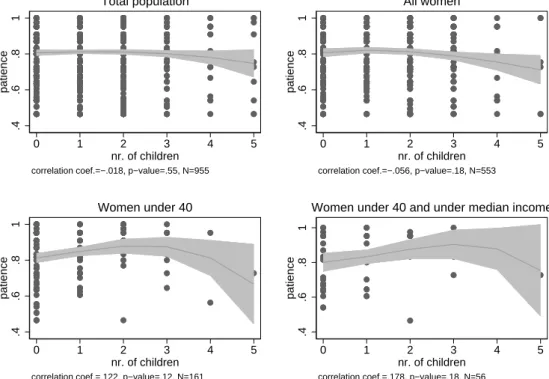
As a first step, we look at non-linear bivariate associations captured by fractional- polinomial plots allowing an illustrative representation of the correlations. Figure 6 indicates the association between the number of children and patience in the total pop- ulation and three subpopulations. In choosing these subpopulations, we follow Bauer and Chytilov´a (2013) who show that women, and especially poor women, with young children are more patient. In Figure 6, we see a flat relationship between patience and the number of children in the total population. When we consider women only the rela- tionship is overall somewhat negative, suggesting that women with children tend to be slightly more impatient. When we study women under 40 (who have probably younger children than the average women), then the association begins to exhibit some curva- ture, in that women with one or two kids seem to be a bit more patient than women without children; albeit this relationship is very weak. When investigating women under 40 and below the median income, then we observe the pattern described in Bauer and Chytilov´a (2013), however the number of cases here is small (N=56). Pairwise linear correlations reveal that the association between the number of children and patience fails to be significant in any of these instances.16
In section D.2 of the Online Appendix we report the fractional-polinomial plots of other subpopulations to show that there is no significant relationship between the number of children and patience. We find that irrespective of the subpopulation, the number of children does not associate positively with patience.
To understand better the potential relationship between patience and the number of children, we proceed with a regression analysis. We use coefficient plots to present our results as these provide a clear illustration on the association of the number of children and patience, with controls included. The coefficient plots visualize the associations at
13In the survey, respondents could either report an estimated average monthly amount of their net income or could state the level of their net income on a 1-8 scale. We have imputed the 8-category income variable with the continuous income variable, and included an additional dummy for the missing cases.
14To assess wealth, we constructed the principal factor of six dummy variables showing if the respon- dent has a 1) car, 2) dishwasher, 3) washing machine, 4) landline phone, and 5) whether the respondent owns the property she lives in, and whether 6) she owns another real estate property. We replaced missing values (for 34 respondents of the total 998) on this principal factor with zero (the average value) and included amissingdummy to control for this in the regressions below.
15We have information on whether the individual has problems of 1) paying public utility bills, 2) servicing a mortgage or 3) other types of loans. Principal factor analysis allows us to create from these three dummy variables an index that proxies the extent of financial difficulties
16In section D.1 of the Online Appendix, we reproduce the same figure for men, with similar findings.
.4.6.81patience
0 1 2 3 4 5
nr. of children correlation coef.=−.018, p−value=.55, N=955
Total population
.4.6.81patience
0 1 2 3 4 5
nr. of children correlation coef.=−.056, p−value=.18, N=553
All women
.4.6.81patience
0 1 2 3 4 5
nr. of children correlation coef.=.122, p−value=.12, N=161
Women under 40
.4.6.81patience
0 1 2 3 4 5
nr. of children correlation coef.=.178, p−value=.18, N=56
Women under 40 and under median income
Figure 1: Fractional-polinomial curves showing bivariate association between the num- ber of children and patience
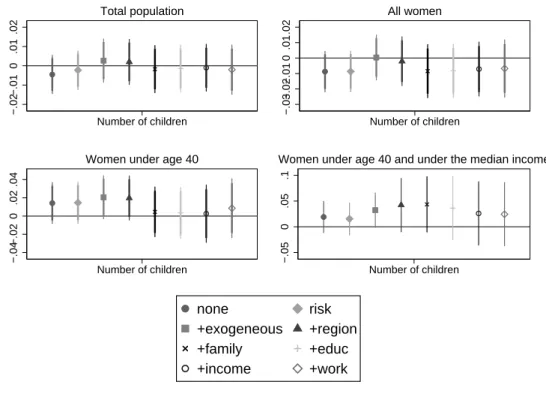
the 10 / 5% significance levels using thick / thin lines.17 We present various specifica- tions. In the first specification, we include as an explanatory variable only the number of children. The second specification contains also our measure of risk attitude as control.
Then, we add, in a consecutive manner, the set of variables that we presented above.
Hence, in specification 3 we add the exogeneous controls, then we introduce region, family,education,income andwork controls in this order.
−.02−.010.01.02
Number of children Total population
−.03−.02−.010.01.02
Number of children All women
−.04−.020.02.04
Number of children Women under age 40
−.050.05.1
Number of children
Women under age 40 and under the median income
none risk
+exogeneous +region +family +educ +income +work
Figure 2: The association of patience and the number of children in different subpopu- lations. Coefficient plots.
Figure 2 indicates that when considering the total population in none of the speci- fications do we observe any significant correlation between the number of children and patience. The same holds when studying only women. However, when considering women under 40, we find that the number of children has a marginally significant and positive association with patience in one of the specifications, namely when risk and exogenousvariables are included. However, when we add more controls, the association becomes insignificant. The largest change occurs, when we control for marital status (family), suggesting that marital status plays a key role. When considering women un- der 40 and below the median income we find a marginally significant positive association in the same specification as in the previous case, but again adding more controls makes the association insignificant, though here the relationship remains clearly positive. Note
17Section E in the Online Appendix contains the coefficients and the significance of the variables of interest.
that we have only 53 observations for women under 40 and below median income, so this finding should be taken with a pinch of salt.18 We carry out the same analysis for men, but in none of the specification do we observe any significant association between the number of children and patience.19 Overall, we do not find convincing evidence that the number of children correlates significantly with patience.
−.10.1.2 Married Separated Living w/ partner Divorced
Number of children
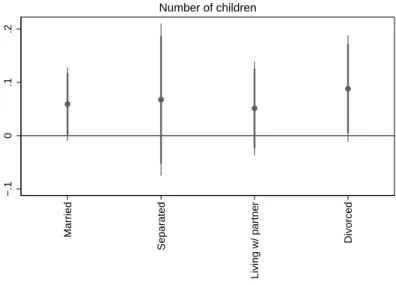
Figure 3: The association of patience and marital status in the case of women under 40.
Coefficient plots. (Reference category: single)
The previous analysis suggests that marital status may be an important factor to understand patience. Figure 3 indicates that compared to single women under 40 other (that is, married, separated, partnered or divorced) women under 40 exhibit a higher level of patience, the difference being marginally significant for married and divorced women.20 If we compare single and non-single women under 40, then there is significant difference in patience between these two groups, even after controlling for risk, the ex- ogenous variables, regional dummies, education, income and vaiables related to work.21 Naturally, having a partner correlates very well with having children: almost 90% of single women under 40 are childless, while 70% of non-single women have at least one child. Note that since Bauer and Chytilov´a (2013) only investigate married individuals, they were not able to discover the role of marital status.
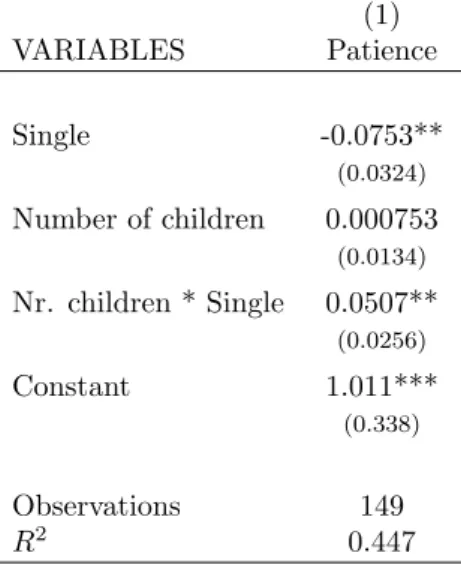
Can we disentangle better the effect of being single and the number of children? If we include both the number of children and the single status in the full regressions as well as their interactions, Table 1 shows that it is the fact of being single that drives the association and not the number of children. It seems that either patience and the
18Section E.1 in the Online Appendix contains the regressions that corresponds to the graphs in Figure 2.
19Section E.2 in the Online Appendix contains the corresponding regressions.
20Coefficients are from the complete model, including all covariates listed above.
21Section E.3 in the Online Appendix has the regressions underlying the results depicted in Figure 3 and the comparison between singe and non-single women under 40.
Table 1: The association of patience and marital status for women under 40 (1)
VARIABLES Patience
Single -0.0753**
(0.0324)
Number of children 0.000753
(0.0134)
Nr. children * Single 0.0507**
(0.0256)
Constant 1.011***
(0.338)
Observations 149
R2 0.447
All other controls included.
Robust standard errors in parentheses
*** p<0.01, ** p<0.05, * p<0.1
number of children are uncorrelated, or that the correlation that might be seen for young women is due only to partnership status: single women under 40 tend to be more impatient. So to put it more bluntly: if anything, it is the partner and not the children that makes one more patient! Note that being single makes a difference in terms of patience only for women under 40.22 To put in some context the difference in patience between single and non-single women under 40, it is about 14% of the range between the minimum and maximum patience levels that we observe in our data. Moreover, it is more than twice as big as the difference in patience between individuals with at most elementary schooling and individuals with university education.
4.1 Robustness check
Until now we have focused on the number of children, but potentially it is the fact of having children that matters and not their numbers. Thus, here we report findings when the independent variable of interest is having at least one child. When considering the total population or the population under 40 (for details, see section G.1 and G.2 in the Online Appendix), we obtain the same results as before: having child(ren) is not signif- icantly correlated with patience. When restricting our attention to women (for details, see section G.3 in the Online Appendix), we see somewhat larger coefficients of our variable of interest, but still associations fail to be significant. Going one step further and only considering women under 40 (for details, see section G.4 in the Online Ap- pendix) yields very similar findings as before. More concretely, having at least one child
22In section F of the Online Appendix Table F shows patience for single and non-single individuals in different subpopulations and statistical tests reveal significant differences only for women under 40.
correlates significantly with patience when only risk, exogenous variables and regional dummies are considered, but ceases to be significant once we add marital status. We see the same results when limiting our attention to women under 40 and below median income. Here in one specification the association becomes significant even at the 5%
significance level. If we investigate the effect of marital status on patience for women under 40 (for details, see section G.6 in the Online Appendix), then - similarly to the previous findings - relative to their single counterparts women of other marital statuses are more patient and in some cases the differences are marginally significant. We also observe that when being single is included in the regression, then the effect of having at least a child becomes insignificant.
Overall, considering the number of children or having at least one child yields the same findings.
5 Conclusion
The public and political debate presented in the Introduction strongly suggests that many people believe that individuals with children value more the future as they have a larger stake in the future. The only study that directly investigates this hypothesis is Bauer and Chytilov´a (2013). They provide some supporting evidence using an Indian, non-representative sample, where they claim that women with young children (and es- pecially the poor ones) are more patient than those without children. To shed more light on this issue, we measure patience in a non-incentivized but representative survey of the Hungarian population to see if our measure associates with the number of the children (or having children in general) at all.
Our main result is that parenthood and patience do not go together in general. Peo- ple with children are not more patient than people without children. Hence, politicians with or without children are not expected to care about the future to a different ex- tent. However, on a small subsample of low-income women under age 40 we do find some positive association of patience and children. Once we add sufficient controls, the association disappears. More precisely, the fact of being single seems to play a crucial role. Single young women (who are more often childless) are more impatient, than their partnered counterparts, and this is what drives the previous results. Hence, our data do not support the claim that individuals with children value the future more in general and we show that having (or having had) a partner seems to affect patience for young women.
A potential issue with our approach is that our measure of patience (based on binary monetary choices) does not capture enhanced valuation of the future that parents may exhibit. Indeed, there is some evidence of domain specificity related to patience. For instance, Chapman and Elstein (1995) and Chapman (1996) find that individuals have different discount rates for monetary decisions and health-related decisions.23 Clearly,
23Weatherly et al. (2010) also report unlike discount rates for different domains. However, no signif- icant differences are found by Hardisty and Weber (2009) regarding the discounting of monetary and
more research is needed to see if our findings hold for different measures of patience.
References
Algan, Y. and Cahuc, P. (2010). Inherited trust and growth. American Economic Review, 100(5):2060–92.
Alsan, M. (2015). The effect of the tsetse fly on african development.American Economic Review, 105(1):382–410.
Ashraf, Q. and Galor, O. (2013). The’out of africa’hypothesis, human genetic diversity, and comparative economic development. American Economic Review, 103(1):1–46.
Bauer, M. and Chytilov´a, J. (2013). Women, children and patience: Experimental evidence from i ndian villages. Review of Development Economics, 17(4):662–675.
Borghans, L. and Golsteyn, B. H. (2006). Time discounting and the body mass index:
Evidence from the netherlands. Economics & Human Biology, 4(1):39–61.
Bradford, D., Courtemanche, C., Heutel, G., McAlvanah, P., and Ruhm, C. (2017).
Time preferences and consumer behavior. Journal of Risk and Uncertainty, 55(2- 3):119–145.
Bradford, W. D. (2010). The association between individual time preferences and health maintenance habits. Medical Decision Making, 30(1):99–112.
Branas-Garza, P., Jorrat, D., Espin, A. M., and Sanchez, A. (2019). Paid and hypo- thetical time preferences are the same: Lab, field and online evidence. mimeo.
Burks, S., Carpenter, J., G¨otte, L., and Rustichini, A. (2012). Which measures of time preference best predict outcomes: Evidence from a large-scale field experiment.
Journal of Economic Behavior & Organization, 84(1):308–320.
Burks, S. V., Lewis, C., Kivi, P. A., Wiener, A., Anderson, J. E., G¨otte, L., DeYoung, C. G., and Rustichini, A. (2015). Cognitive skills, personality, and economic prefer- ences in collegiate success.Journal of Economic Behavior & Organization, 115:30–44.
Cadena, B. C. and Keys, B. J. (2015). Human capital and the lifetime costs of impa- tience. American Economic Journal: Economic Policy, 7(3):126–53.
Chabris, C. F., Laibson, D., Morris, C. L., Schuldt, J. P., and Taubinsky, D. (2008).
Individual laboratory-measured discount rates predict field behavior. Journal of risk and uncertainty, 37(2-3):237.
Chapman, G. B. (1996). Temporal discounting and utility for health and money.Journal of Experimental Psychology: Learning, Memory, and Cognition, 22(3):771.
environmental outcomes, a finding that has been reproduced by Ioannou and Sadeh (2016).
Chapman, G. B. and Elstein, A. S. (1995). Valuing the future: Temporal discounting of health and money. Medical Decision Making, 15(4):373–386.
Chen, M. K. (2013). The effect of language on economic behavior: Evidence from savings rates, health behaviors, and retirement assets. American Economic Review, 103(2):690–731.
Cornsweet, T. N. (1962). The staircase-method in psychophysics. The American journal of psychology, 75(3):485–491.
Crosetto, P. and Filippin, A. (2016). A theoretical and experimental appraisal of four risk elicitation methods. Experimental Economics, 19(3):613–641.
De Paola, M. and Gioia, F. (2017). Impatience and academic performance. less effort and less ambitious goals. Journal of Policy Modeling, 39(3):443–460.
Dohmen, T., Enke, B., Falk, A., Huffman, D., and Sunde, U. (2018). Patience and comparative development. Technical report.
Falk, A., Becker, A., Dohmen, T., Enke, B., Huffman, D., and Sunde, U. (2018). Global evidence on economic preferences. The Quarterly Journal of Economics, 133(4):1645–
1692.
Galor, O. and ¨Ozak, ¨O. (2016). The agricultural origins of time preference. American Economic Review, 106(10):3064–3103.
Gneezy, U. and Potters, J. (1997). An experiment on risk taking and evaluation periods.
The Quarterly Journal of Economics, 112(2):631–645.
Golsteyn, B. H., Gr¨onqvist, H., and Lindahl, L. (2014). Adolescent time preferences predict lifetime outcomes. The Economic Journal, 124(580).
Grossman, M. (2006). Education and nonmarket outcomes. Handbook of the Economics of Education, 1:577–633.
Hardisty, D. J. and Weber, E. U. (2009). Discounting future green: money versus the environment. Journal of Experimental Psychology: General, 138(3):329.
Horn, D. and Kiss, H. J. (2019). Time preferences and their life outcome correlates:
Evidence from a representative survey. Available at SSRN 3346024.
Ioannou, C. A. and Sadeh, J. (2016). Time preferences and risk aversion: Tests on domain differences. Journal of Risk and Uncertainty, 53(1):29–54.
Khwaja, A., Silverman, D., and Sloan, F. (2007). Time preference, time discounting, and smoking decisions. Journal of Health Economics, 26(5):927–949.
Komlos, J., Smith, P. K., and Bogin, B. (2004). Obesity and the rate of time preference:
is there a connection? Journal of biosocial science, 36(2):209–219.
Kreibich, H. (2011). Do perceptions of climate change influence precautionary measures?
International Journal of Climate Change Strategies and Management, 3(2):189–199.
Laibson, D. (1997). Golden eggs and hyperbolic discounting. The Quarterly Journal of Economics, 112(2):443–478.
Lawrance, E. C. (1991). Poverty and the rate of time preference: evidence from panel data. Journal of Political Economy, 99(1):54–77.
Mart´ın, J., Branas-Garza, P., Esp´ın, A. M., Gamella, J. F., and Herrmann, B. (2019).
The appropriate response of spanish gitanos: short-run orientation beyond current socio-economic status. Evolution and Human Behavior, 40(1):12–22.
Meier, S. and Sprenger, C. D. (2012). Time discounting predicts creditworthiness. Psy- chological Science, 23(1):56–58.
Non, A. and Tempelaar, D. (2016). Time preferences, study effort, and academic per- formance. Economics of Education Review, 54:36–61.
Olsson, O. and Hibbs Jr, D. A. (2005). Biogeography and long-run economic develop- ment. European Economic Review, 49(4):909–938.
Pender, J. L. (1996). Discount rates and credit markets: Theory and evidence from rural india. Journal of Development Economics, 50(2):257–296.
Psacharopoulos, G. and Patrinos, H. A. (2004). Returns to investment in education: a further update. Education economics, 12(2):111–134.
Spolaore, E. and Wacziarg, R. (2009). The diffusion of development. The Quarterly Journal of Economics, 124(2):469–529.
Sundblad, E.-L., Biel, A., and G¨arling, T. (2007). Cognitive and affective risk judge- ments related to climate change. Journal of Environmental Psychology, 27(2):97–106.
Sutter, M., Kocher, M. G., Gl¨atzle-R¨uetzler, D., and Trautmann, S. T. (2013). Im- patience and uncertainty: Experimental decisions predict adolescents’ field behavior.
American Economic Review, 103(1):510–31.
Tanaka, T., Camerer, C. F., and Nguyen, Q. (2010). Risk and time preferences: linking experimental and household survey data from vietnam. American Economic Review, 100(1):557–71.
Weatherly, J. N., Terrell, H. K., and Derenne, A. (2010). Delay discounting of different commodities. The Journal of General Psychology: Experimental, Psychological, and Comparative Psychology, 137(3):273–286.
Weber, M. (2002). The Protestant Ethic and the” spirit” of Capitalism and Other Writings. Penguin.
Weller, R. E., Cook III, E. W., Avsar, K. B., and Cox, J. E. (2008). Obese women show greater delay discounting than healthy-weight women. Appetite, 51(3):563–569.
Yesuf, M., Bluffstone, R., et al. (2008). Wealth and time preference in rural ethiopia.
Technical report.
A Online Appendix - Patience and its life outcome correlates
Time preferences are important as many choices in our life involve costs and benefits that occur at different points in time. In many cases, costs related to an action are incurred now, while benefits accrue in the future and the extent to which an individual discounts those benefits determines if she undertakes the action or not. To show the importance of time preferences, consider education outcomes that determine to a large extent success in life as captured, for instance by the wage premium (e.g. Psacharopoulos and Patrinos, 2004) or the positive relation between schooling and other socioeconomic outcomes (e.g. Grossman, 2006). Using a Swedish sample, Golsteyn et al. (2014) doc- ument that less patience at the age is associated with worse school performance and educational attainment. Similar results are obtained by Burks et al. (2015), Cadena and Keys (2015), Non and Tempelaar (2016) and De Paola and Gioia (2017) in different countries and settings. Falk et al. (2018) show that this finding holds also when studying representative data from 76 countries.
Patience also correlates with income and wealth. Lawrance (1991) shows that poor households exhibit less patience than rich ones in the US. Similar results were reported by Yesuf et al. (2008) for Ethiopian and by Pender (1996) for South Indian households.
Tanaka et al. (2010) and Golsteyn et al. (2014) find that income and patience are positively correlated in Vietnam and Sweden, respectively.
Concerning the relationship between time preference and financial decisions, Sutter et al. (2013) report that impatience explains saving decisions of Austrian adolescents, more impatient ones being less likely to save. In a similar vein, Bradford et al. (2017) document positive correlation between patience and different forms of savings for a representative sample of the US adult population. This finding is global as shown by Falk et al. (2018). Evidence shows that time preferences may associate also to financial troubles. According to Chabris et al. (2008), more patient individuals are more likely to pay their bills without problems in a US sample and may exhibit higher creditworthiness (Meier and Sprenger, 2012). Moreover, credit scores correlate positively with patience in Burks et al. (2012).
Health may be also associated with individual time preferences. Komlos et al. (2004), Borghans and Golsteyn (2006), Weller et al. (2008) and Golsteyn et al. (2014) report that patience and health correlate positively. Khwaja et al. (2007), Bradford (2010) and Sutter et al. (2013) show that patience is also related to smoking behavior. Bradford et al. (2017) indicate that patience is related to self-reported health and also to different health behaviors (e.g. obesity, BMI, smoking, binge drinking) in the US.
Reassuringly, we confirm most of the aforementioned findings in our dataset in a companion paper (Horn and Kiss, 2019). That is, more patient individuals in Hungary are less likely to get stuck at the lowest levels of education and more likely to have a diploma. Patience is also positively correlated with wealth, banking and saving decisions and it weakly associates with self-reported health. Since we are able to reproduce most
of the findings of the existing literature, we firmly believe that our measurement of patience really captures important aspects of the time preferences of the Hungarian adult population.
B Online Appendix - Survey questions
1. During the next questions we will play a short game. You have to choose between two amounts of money. Not only are the amounts different, they also differ in when you would receive them. Please assume there is no inflation, i.e., future prices are the same as today’s prices. This situation is only hypothetical, but please answer as if it was a real choice.
1.a. Would you rather receive 10000 Forints today or X1 in a month?
1 – 10,000 Ft today, or 2 – X1 Ft in a month?
9 – DK
(And 4 other questions of this sort followed.)
2. Please assume that you receive 10000 Forints and you have the opportunity to place a bet (between 0 and 10000 Ft) on a colour in the next gamble. There is a bag that contains 10 black and 10 red balls. We will draw one. If the colour of the ball drawn coincides with your bet, then we double the amount of your bet. If not, the your bet is lost. The amount not placed as bet is yours.
Please, select a colour!
2.a Selected colour:
2.b. How much would you bet?
Amount of the bet:
3. Now I will ask similar questions as before, but there is a difference. You would receive the earlier payoff in a year, and the later payoff in a year and a month. How would you choose?
3.a. Would you rather receive 10000 Forints in a year or X1 in a year and a month?
1 – 10,000 Ft today, or 2 – X1 Ft in a month?
9 – DK
C Online Appendix - Staircase method to measure time preferences and individual discount rates
Figure 4 represents the tree behind the staircase method. The first question asked if the individual preferred 10000 Forints today or 15500 Forints in a month. If the individual chose the former / latter one, then it revealed that the amount of money in a month that makes her indifferent to 10000 Forints today is more / less than 15500 Forints, so the next question asked if she preferred 10000 Forints today or 18500 / 12500 Forints in a month. This algorithm was repeated in all the 5 questions. In Figure 4, the blue lines correspond to the choice of 10000 Forints (instead of the larger later amount) that implied that the later amount was increased in the next question, while the red lines denote the choice of the later amounts (instead of the earlier 10000 Forints), ensuing a lowering of the later amounts in the next question.
The answers to these 5 interdependent questions allows us to zoom in on the in- difference point, but note that we cannot infer the the exact amount that makes the individual indifferent. However, we know lower and upper bounds of the real indifference point.
Figure 4: Tree for the staircase time preference task
D Online Appendix - Fractional-polinomial plots
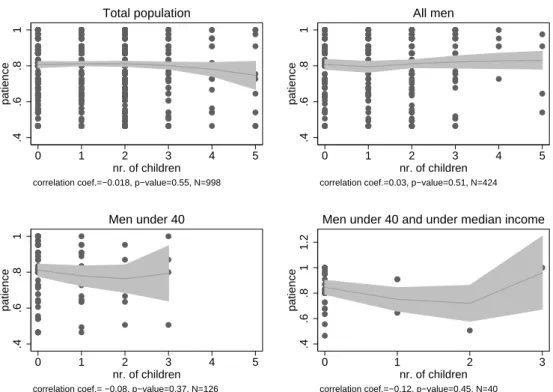
D.1 Fractional-polinomials for men
.4.6.81patience
0 1 2 3 4 5
nr. of children correlation coef.=−0.018, p−value=0.55, N=998
Total population
.4.6.81patience
0 1 2 3 4 5
nr. of children correlation coef.=0.03, p−value=0.51, N=424
All men
.4.6.81patience
0 1 2 3 4 5
nr. of children correlation coef.= −0.08, p−value=0.37, N=126
Men under 40
.4.6.811.2patience
0 1 2 3
nr. of children correlation coef.=−0.12, p−value=0.45, N=40
Men under 40 and under median income
Figure 5: Fractional-polinomial curves showing bivariate association between the num- ber of children and patience, men
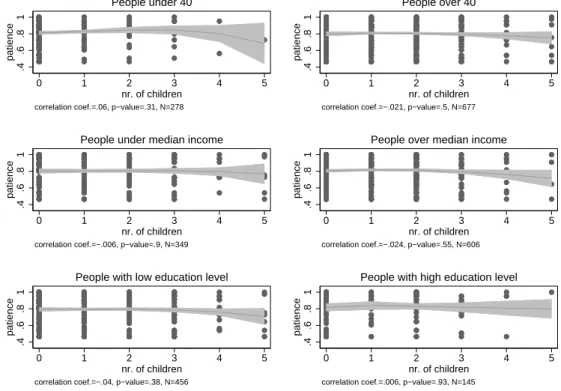
D.2 Fractional-polinomials, other subpopulations
.4.6.81patience
0 1 2 3 4 5
nr. of children correlation coef.=.06, p−value=.31, N=278
People under 40
.4.6.81patience
0 1 2 3 4 5
nr. of children correlation coef.=−.021, p−value=.5, N=677
People over 40
.4.6.81patience
0 1 2 3 4 5
nr. of children correlation coef.=−.006, p−value=.9, N=349
People under median income
.4.6.81patience
0 1 2 3 4 5
nr. of children correlation coef.=−.024, p−value=.55, N=606
People over median income
.4.6.81patience
0 1 2 3 4 5
nr. of children correlation coef.=−.04, p−value=.38, N=456
People with low education level
.4.6.81patience
0 1 2 3 4 5
nr. of children correlation coef.=.006, p−value=.93, N=145
People with high education level
Figure 6: Fractional-polinomial curves showing bivariate association between the num- ber of children and patience
E Online Appendix - Regression tables and coeffi- cient plots
E.1 Patience and number of children - regressions related to Figure 2
(1) (2) (3) (4) (5) (6) (7) (8)
VARIABLES Patience Patience Patience Patience Patience Patience Patience Patience Number of children -0.00452 -0.00226 0.00270 0.00198 -0.00173 -0.00142 -0.00100 -0.00201 (0.00516) (0.00521) (0.00583) (0.00606) (0.00633) (0.00627) (0.00629) (0.00661)
Constant 0.811*** 0.785*** 0.846*** 0.808*** 0.839*** 0.857*** 0.796*** 0.714***
(0.00878) (0.0117) (0.0497) (0.0537) (0.0562) (0.0572) (0.106) (0.122)
Observations 955 901 901 901 901 901 901 901
R2 0.001 0.015 0.030 0.073 0.095 0.102 0.114 0.129
additional controls: none +risk +exog +region +family +educ +income +work Robust standard errors in parentheses
*** p<0.01, ** p<0.05, * p<0.1
Table 2: Patience and the number of children, total population
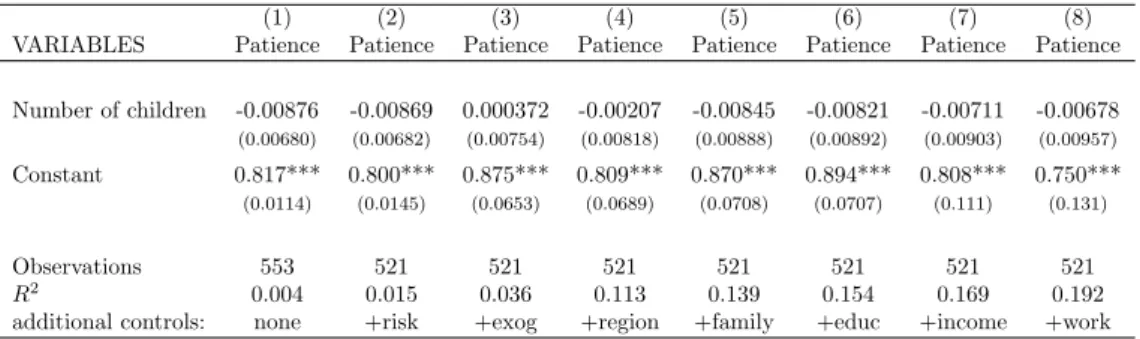
(1) (2) (3) (4) (5) (6) (7) (8)
VARIABLES Patience Patience Patience Patience Patience Patience Patience Patience Number of children -0.00876 -0.00869 0.000372 -0.00207 -0.00845 -0.00821 -0.00711 -0.00678 (0.00680) (0.00682) (0.00754) (0.00818) (0.00888) (0.00892) (0.00903) (0.00957)
Constant 0.817*** 0.800*** 0.875*** 0.809*** 0.870*** 0.894*** 0.808*** 0.750***
(0.0114) (0.0145) (0.0653) (0.0689) (0.0708) (0.0707) (0.111) (0.131)
Observations 553 521 521 521 521 521 521 521
R2 0.004 0.015 0.036 0.113 0.139 0.154 0.169 0.192
additional controls: none +risk +exog +region +family +educ +income +work Robust standard errors in parentheses
*** p<0.01, ** p<0.05, * p<0.1
Table 3: Patience and the number of children, women
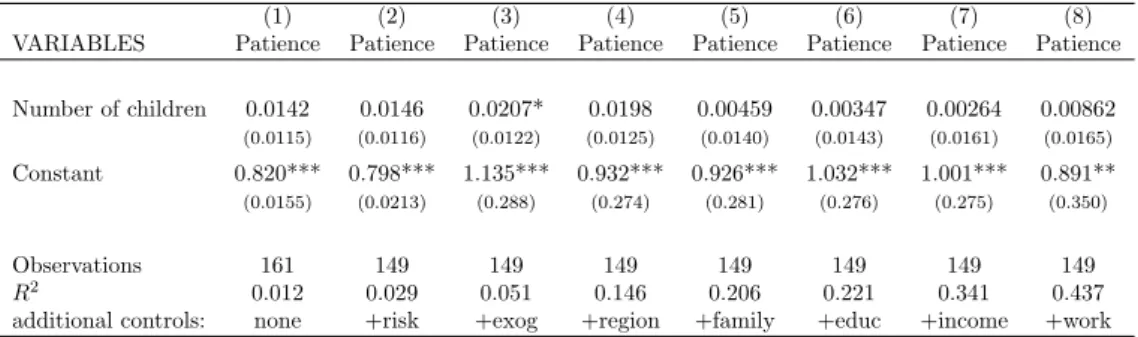
(1) (2) (3) (4) (5) (6) (7) (8) VARIABLES Patience Patience Patience Patience Patience Patience Patience Patience Number of children 0.0142 0.0146 0.0207* 0.0198 0.00459 0.00347 0.00264 0.00862 (0.0115) (0.0116) (0.0122) (0.0125) (0.0140) (0.0143) (0.0161) (0.0165)
Constant 0.820*** 0.798*** 1.135*** 0.932*** 0.926*** 1.032*** 1.001*** 0.891**
(0.0155) (0.0213) (0.288) (0.274) (0.281) (0.276) (0.275) (0.350)
Observations 161 149 149 149 149 149 149 149
R2 0.012 0.029 0.051 0.146 0.206 0.221 0.341 0.437
additional controls: none +risk +exog +region +family +educ +income +work Robust standard errors in parentheses
*** p<0.01, ** p<0.05, * p<0.1
Table 4: Patience and the number of children, women and under 40
(1) (2) (3) (4) (5) (6) (7) (8)
VARIABLES Patience Patience Patience Patience Patience Patience Patience Patience Number of children 0.0191 0.0154 0.0323* 0.0422 0.0435 0.0362 0.0259 0.0244
(0.0155) (0.0158) (0.0170) (0.0260) (0.0268) (0.0306) (0.0303) (0.0298) Constant 0.818*** 0.792*** 0.639 0.641 0.786* 0.951** 1.393** 1.464**
(0.0282) (0.0416) (0.496) (0.419) (0.419) (0.421) (0.594) (0.635)
Observations 56 53 53 53 53 53 53 53
R2 0.029 0.060 0.120 0.332 0.389 0.416 0.588 0.724
additional controls: none +risk +exog +region +family +educ +income +work Robust standard errors in parentheses
*** p<0.01, ** p<0.05, * p<0.1
Table 5: Patience and the number of children; women, under 40 and under median income
E.2 Patience and children - men
(1) (2) (3) (4) (5) (6) (7) (8)
VARIABLES Patience Patience Patience Patience Patience Patience Patience Patience Number of children 0.000972 0.00509 0.00336 0.00429 0.00437 0.00504 0.00760 0.00544 (0.00776) (0.00789) (0.00964) (0.00971) (0.00959) (0.00958) (0.00974) (0.00997)
Constant 0.805*** 0.768*** 0.830*** 0.844*** 0.837*** 0.845*** 0.957*** 0.886***
(0.0133) (0.0186) (0.0770) (0.0826) (0.0883) (0.0886) (0.104) (0.134)
Observations 402 380 380 380 380 380 380 380
R2 0.000 0.021 0.037 0.081 0.121 0.123 0.184 0.200
additional controls: none +risk +exog +region +family +educ +income +work Robust standard errors in parentheses
*** p<0.01, ** p<0.05, * p<0.1
Table 6: Patience and the number of children, men
(1) (2) (3) (4) (5) (6) (7) (8)
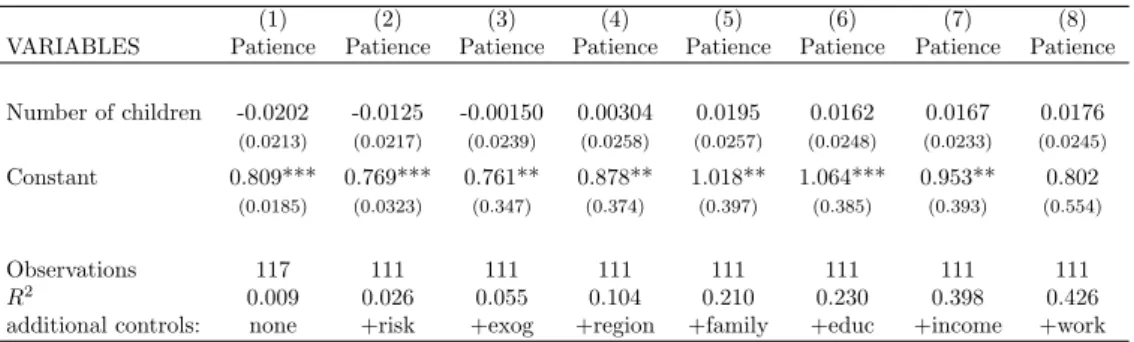
VARIABLES Patience Patience Patience Patience Patience Patience Patience Patience Number of children -0.0202 -0.0125 -0.00150 0.00304 0.0195 0.0162 0.0167 0.0176
(0.0213) (0.0217) (0.0239) (0.0258) (0.0257) (0.0248) (0.0233) (0.0245) Constant 0.809*** 0.769*** 0.761** 0.878** 1.018** 1.064*** 0.953** 0.802
(0.0185) (0.0323) (0.347) (0.374) (0.397) (0.385) (0.393) (0.554)
Observations 117 111 111 111 111 111 111 111
R2 0.009 0.026 0.055 0.104 0.210 0.230 0.398 0.426
additional controls: none +risk +exog +region +family +educ +income +work Robust standard errors in parentheses
*** p<0.01, ** p<0.05, * p<0.1
Table 7: Patience and the number of children, men under 40
(1) (2) (3) (4) (5) (6) (7) (8) VARIABLES Patience Patience Patience Patience Patience Patience Patience Patience
Number of children -0.0308 -0.0297 -0.00420 0.0154 0.00954 0.00851 -0.0662 -0.0798 (0.0424) (0.0403) (0.0539) (0.0502) (0.0614) (0.0688) (0.0455) (0.0515)
Constant 0.847*** 0.871*** 0.544 0.919 0.984 1.250 1.284 1.330
(0.0249) (0.0366) (0.925) (1.506) (1.672) (1.634) (0.999) (1.521)
Observations 36 34 34 34 34 34 34 34
R2 0.028 0.049 0.180 0.473 0.502 0.514 0.885 0.913
additional controls: none +risk +exog +region +family +educ +income +work Robust standard errors in parentheses
*** p<0.01, ** p<0.05, * p<0.1
Table 8: Patience and the number of children; men under 40 and under median income
E.3 Patience and children - role of marital status
(1) (2) (3) (4) (5) (6)
VARIABLES Patience Patience Patience Patience Patience Patience
Number of children 0.00862 0.000753 0.000753
(0.0165) (0.0134) (0.0134)
Married 0.0592* 0.0607*
(0.0349) (0.0358)
Separated 0.0676 0.0744
(0.0721) (0.0699)
Living w/ partner 0.0513 0.0517
(0.0447) (0.0439)
Divorced 0.0880* 0.0957*
(0.0505) (0.0503)
At least one child 0.00590 -0.0153 -0.0153
(0.0376) (0.0370) (0.0370)
Single -0.0753** -0.0830** -0.0753** -0.0830**
(0.0324) (0.0356) (0.0324) (0.0356)
Nr. children * Single 0.0507** 0.0507**
(0.0256) (0.0256)
At least one child * Single 0.0882 0.0882
(0.0722) (0.0722)
Constant 0.891** 0.881** 1.011*** 0.986*** 1.011*** 0.986***
(0.350) (0.347) (0.338) (0.336) (0.338) (0.336)
Observations 149 149 149 149 149 149
R2 0.437 0.436 0.447 0.440 0.447 0.440
All other controls included.
Robust standard errors in parentheses
*** p<0.01, ** p<0.05, * p<0.1
Table 9: Patience and the number of children - the role of marital status
F Online Appendix - Patience and being single
Overall Women Men Women under 40 Women over 40 Men under 40 Men over 40
Single 0.798 0.795 0.801 0.793 0.802 0.798 0.797
Non-single 0.810 0.811 0.808 0.870 0.798 0.790 0.811
Difference (non-single - single) 0.012 0.015 0.007 0.077 -0.005 -0.008 0.014
Wilcoxon ranksum test 0.284 0.237 0.758 0.003 0.837 0.772 0.825
Kolmogorov-Smirnov test 0.154 0.116 0.996 0.012 0.842 0.995 0.922
Epps-Singleton test 0.417 0.407 0.907 0.005 0.782 0.469 0.523
Table 10: The level of patience for singles and non-singles in different subpopulations.
For the tests p-values are reported.