CERS-IE WORKING PAPERS | KRTK-KTI MŰHELYTANULMÁNYOK
INSTITUTE OF ECONOMICS, CENTRE FOR ECONOMIC AND REGIONAL STUDIES,
Patient democracies?
SÁRA KHAYOUTI – HUBERT JÁNOS KISS – DÁNIEL HORN
CERS-IE WP – 2020/12
February 2020
https://www.mtakti.hu/wp-content/uploads/2020/02/CERSIEWP202012.pdf
CERS-IE Working Papers are circulated to promote discussion and provoque comments, they have not been peer-reviewed.
Any references to discussion papers should clearly state that the paper is preliminary.
Materials published in this series may be subject to further publication.
ABSTRACT
We test if the political regime of a country associates with the patience of the citizens.
Recent findings indicate that i) more democratic countries tend to have higher growth, and ii) patience correlates positively with economic development, suggesting a potential link between the political regime and patience. We document a positive association between the level of democracy and patience for most of the political regime indices that we use, even after controlling for region, economic development, geographical conditions, and culture. We report some evidence that political participation is behind our findings.
JEL codes: democracy, patience, political regime, time preferences Keywords: D02, D12
Sára Khayouti
University of Amsterdam, Roetersstraat 11, 1018 WB Amsterdam, The Netherlands e-mail: sara.khayouti@student.uva.nl
and
Hubert János Kiss
KRTK KTI and Corvinus University of Budapest, 1097 Budapest, Tóth Kálmán u. 4.
and 1093 Budapest, Fővám tér 8, Hungary.
e-mail: kiss.hubert@krtk.mta.hu and
Dániel Horn
KRTK KTI and Corvinus University of Budapest, 1097 Budapest, Tóth Kálmán u. 4.
and 1093 Budapest, Fővám tér 8, Hungary.
e-mail: horn.daniel@krtk.mta.hu
Türelmes demokráciák?
KHAYOUTI SÁRA – KISS HUBERT JÁNOS – HORN DÁNIEL
ÖSSZEFOGLALÓ
Ebben a tanulmányban azt vizsgáljuk, hogy a politikai berendezkedés összefüggésben áll-e a türelemmel. Eddigi eredmények alapján i) a demokratikusabb országok gyorsabban nőnek, és ii) a türelem pozitívan korrelál a gazdasági fejlettséggel, ami azt sugallja, hogy létezhet összefüggés a türelem és a politikai berendezkedés között.
Megmutatjuk, hogy pozitív összefüggés van a demokrácia szintje és a türelem között a legtöbb általunk vizsgált politikai berendezkedés index esetében, még akkor is, ha a régióval, gazdasági fejlettséggel, földrajzi adottságokkal és kultúrával kapcsolatos tényezőket figyelembe vesszük. Arra is találunk némi bizonyítékot, hogy a politikai részvétel lehet az eredményeink mögött.
JEL: D02; D12
Kulcsszavak: Demokrácia, Időpreferencia, Politikai berendezkedés, Türelem.
Patient democracies?
S´ara Khayouti
University of Amsterdam, Roetersstraat 11, 1018 WB Amsterdam, The Netherlands
Hubert J´anos Kiss1
KRTK KTI and Corvinus University of Budapest, 1097 Budapest, T´oth K´alm´an u. 4. and 1093 Budapest, F˝ov´am t´er 8, Hungary. Phone: +36304938062
D´aniel Horn2
KRTK KTI and Corvinus University of Budapest, 1097 Budapest, T´oth K´alm´an u. 4. and 1093 Budapest, F˝ov´am t´er 8, Hungary.
Abstract
We test if the political regime of a country associates with the patience of the cit- izens. Recent findings indicate that i) more democratic countries tend have higher growth, and ii) patience correlates positively with economic development, suggesting a potential link between the political regime and patience. We document a positive association between the level of democracy and patience for most of the political regime indices that we use, even after controlling for region, economic development, geographical conditions and culture. We report some evidence that political partici- pation is behind our findings.
Keywords: democracy, patience, political regime, time preferences JEL: D02, D12
Email addresses: sara.khayouti@student.uva.nl(S´ara Khayouti),
kiss.hubert@krtk.mta.hu(Hubert J´anos Kiss),horn.daniel@krtk.mta.hu(D´aniel Horn)
1Corresponding author. Financial support from the Spanish Ministry of Economy, Industry and Competitiveness under the project ECO2017-82449-P, the National Research, Development
& Innovation (NKFIH) under project K 119683 is gratefully acknowledged. This research was supported by the Higher Education Institutional Excellence Program of the Ministry for Innovation and Technology in the framework of the ”Financial and Public Services” research project (reference number: NKFIH-1163-10/2019) at Corvinus University of Budapest.
2Financial support from the National Research, Development & Innovation (NKFIH) under project K 124396 is gratefully acknowledged.
1. Introduction
Acemoglu et al. (2019) argue that democracy causes growth, a finding supported by a recent metastudy by Colagrossi et al. (2020).3 Moreover, Dohmen et al. (2018) document that an aspect of time preferences, patience, is strongly correlated with the level and growth of income. If more democratic countries tend to have higher income, and higher income associates with more patience, then potentially there is a relationship between democracy and patience, more democratic countries exhibiting a higher level of patience. In this paper, we investigate if such an association exists and if the connection remains once we take into account economic development.
Such a relationship may be mechanic through the correlation of the political regime and patience with income (or the growth of income). However, there may be a direct link between political regime and patience. Here we present briefly some potential channels. Opposed to the traditional assumption that preferences are exogenously given, there is a growing literature that claims that they are en- dogenously formed by social arrangements (see, for instance Bowles, 1998, and refer- ences therein). This literature investigates mainly how economic institutions (above all market transactions) affect values and preferences. For example, Weber (1978) stresses the impersonality of the markets and its effect on individuals, and experi- mental evidence also shows how individuals act differently in market situations than in other arrangements (Shleifer, 2004; Falk and Szech, 2013). There is also some evidence how arrangements related to one’s job may affect preferences. For example, Kohn et al. (1990) show how self-direction on the job engenders the valuation of self-direction in other walks of life in a causal sense. They claim that ”social struc- ture affects individual psychological functioning mainly by affecting the conditions of people’s own lives”. The political regime is an important social structure, and hence may affect the citizens’ preferences. The relationship may go also in the op- posite direction, that is preferences may affect the political regime. If a population (for whatever reason) becomes more forward-looking and willing to accummulate, then they may prefer political regimes that are stable and honour private property
3Barro (1996) finds that democracy has a weakly negative effect on growth once properly con- trolling for relevant factors, though it may enhance growth at low levels of democracy. Note that the data in Barro (1996) end in 1990, while the other studies use longer time series. Considering the opposite direction, Acemoglu et al. (2008) provide evidence that income does not have a causal effect on democracy. However, Barro (1999) claims that higher per capita GDP associates with higher propensity for democracy. Cervellati et al. (2014) highlight that being a colony, colonial his- tory and early institutions affect the sign of the correlation between political regime and economic development.
(e.g. Charron and Lapuente (2010)). Our data do not allow us to see which way the causation goes (if there is a causal relationship), we simply investigate if there is a firm association between patience and political regime, even if we control for a host of potential confounding variables (like economic development).
Our patience measure comes from the Global Preferences Survey (Falk et al., 2016, 2018) that provides a representative sample of patience from 76 countries cov- ering about 90% of the world population. It includes experimentally validated mea- sures of time and risk preferences, altruism, positive and negative reciprocity and trust. In this paper we use the time preference module that consists of a qualitative and a quantitative measure, with weights 0.288 and 0.712, respectively. In the qual- itative part, the respondents self-assess their willingness to sacrifice an immediate reward for a larger future reward on an 11-point Likert scale.4 The quantitative part contains a series of five choices between receiving some amount of money immedi- ately or a different and larger amount in a year.5 The Global Preferences Survey reveals that there is a great heterogeneity in patience between countries (see Figure 1 and Table III in Falk et al. (2018)).6 This patience measure is valid in the sense that it predicts behavior. Importantly, on the country level patience associates pos- itively and significantly with GDP per capita. Using the same data, Dohmen et al.
(2018) show that on the country level patience also correlates significantly with gross national savings, capital stock per capita and schooling. Overall, patience seems to be a deep determinant of accumulation decisions.
We use political regime measures from well-known and widely used datasets: the Polity Score, the Economist Intelligence Unit (EIU) Democracy Index, the Freedom House’s (FH) Freedom in the World measure, the MaxRange (MR) index and the Unified Democracy Score (UDS). We use different measures to allow for different interpretations on what constitutes democracy and how to measure it properly (as explained in section 3).
We study if patience on the country level associates with democracy (or the lack of it) as measured by those indices. We use simple OLS regressions and first regress patience on the democracy measure. Then, in consecutive steps we add regional control variables; controls related to the economic development of the countries; ge-
4The exact question is the following: ’How willing are you to give up something that is beneficial for you today in order to benefit more from that in the future?’
5This ’money earlier or later’ format is widely used (Cohen et al., 2016) and to make it more efficient in finding the approximate indifference point between a fixed earlier amount and a larger later amount Falk et al. (2018) make the decisions interdependent, following Cornsweet (1962).
6Falk et al. (2018) state that from all possible (2,850) pairwise comparisons of patience between countries in 83% of the cases the difference is significant at 1% level.
ographical controls and cultural controls. We interpret the regressions as correlation because the data do not allow to establish causal relationships. We are interested in seeing i) if the correlation has the expected sign (more democratic countries exhibit- ing more patience), ii) if it is statistically significant, and iii) how the significance changes as we add more and more controls.
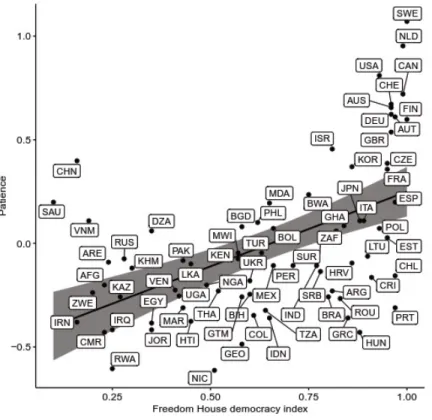
For a first glimpse, consider Figure 1 that depicts the relationship between the Freedom House index and patience. Using our cross-country data, Figure 1 indicates that there is a clear positive relationship (ρ = 0.53) between political regime and patience.7 Note also that there are countries that do not score high on democracy indices, but have a rather patient population (e.g. China or Saudi Arabia), suggesting that our conjectured association may depend on other (e.g. cultural) factors.
While Figure 1 indicates a strong correlation, the association may be driven by third factors. Interestingly, we find that even as we add regional controls and take into account economic development (captured by the GDP per capita and unem- ployment rate of the country), the relationship remains positive and significant at 5% forall the political regime measures considered. If we add geographical (average temperature, average precipitation and distance to the Equator) and cultural (mea- sured by the share of religious affiliation in the country, including the unaffiliated citizens) controls, then the association still remains clearly positive, but the signifi- cance disappears in some cases. More precisely, after adding all the control variables in the case of the MaxRange index the relationship fails to be significant, for Polity and the FH index the association is significant at 10%, while for EIU index and the UDS it is significant even at 5%. We also investigate the relative importance of the above factors to understand patience. We find that economic development and culture are the most important factors to explain patience, while political regime has an explanatory power similar to the geographical conditions or the regional controls.
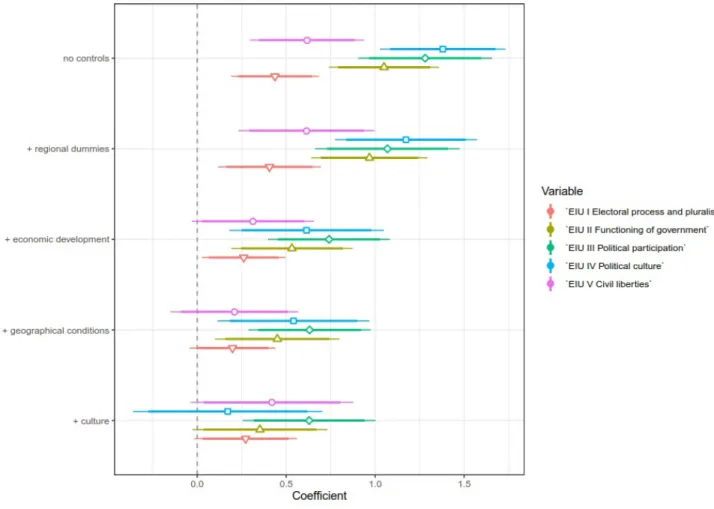
We also try to gain some insight into which elements drive the results, so we dissect the EIU Democracy index and consider how the five categories (electoral process and pluralism, functioning of government, political participation, political culture, civil liberties) that make up the index associate with patience.8 Without controls and when only regional dummies are added, all of the categories prove to be significant,
7If we use the other indices, we obtain a very similar picture, the strength of the association, measured by the correlation varying between 0.33 (MaxRange) and 0.6 (UDS), the correlation being significant at any conventional significance level. The associations are represented in Figures C.4 - C.7 in section Appendix C.
8In section 4.2 we explain that carrying out the same exercise for the other indices is impossible or impractical.
Figure 1: Patience and political regime (as captured by the Freedom House’sFreedom in the World index, higher scores denote more democratic countries), no additional control variables
however after adding all the controls political participation is the category that re- mains significant at the 1% significance level, indicating the first-order relevance of this aspect of democracy to understand patience.
The remainder of the paper is structured as follows. In section 2 we review briefly the literature and formulate our hypothesis. Section 3 presents the data that we use.
Section 4 contains the findings and section 5 concludes.
2. Literature review and hypothesis
As mentioned above, Bowles (1998) claims that preferences are not exogenously given (see Stigler and Becker (1977)), but they are shaped by markets and other eco- nomic institutions.9 Most of the examples on endogenous preferences are economic in motivation or nature, but there are also studies investigating the role of other fac- tors. For instance, Hoff et al. (2011) study how belonging to a caste in India affects the preference to enforce norms. Other example is the effect of war and conflicts on preferences (Voors et al., 2012; Gneezy and Fessler, 2011; Bauer et al., 2014, 2016).
There is also a growing literature showing the effect of social institutions on pref- erences and outcomes. For instance, Acemoglu et al. (2001) document how different modes of colonization affects present economic performance. Nunn and Wantchekon (2011) report association between current levels of trust and slave trade. Becker et al.
(2016) show how being part or not of the Habsburg empire relates to present levels of trust and affects corruption in courts and police in Central and Eastern Europe to- day. Zooming in on political regimes, there is an expanding literature that shows that different political regimes may lead to different preferences. The case of Germany provides a natural experiment on how political regime may affect the preferences of culturally identical people. Brosig-Koch et al. (2011) document that East Germans show less solidarity than their Western counterparts, but according to Alesina and Fuchs-Sch¨undeln (2007) they have stronger preferences for redistribution and state intervention. Moreover, Rainer and Siedler (2009) and Heineck and S¨ussmuth (2013) find that even after many years of reunification, East Germans exhibit less trust than West Germans. However, regarding risk attitudes Heineck and S¨ussmuth (2013) doc- ument a convergence. In our view the paper that is closest to our study is Friehe and Pannenberg (2017) as they study the relationship between time preferences and political regime. They focus on the natural experiment that the German reunifica- tion provided. They find that residents of the former German Democratic Republic
9In a similar vein, Fehr and Hoff (2011) speak also about endogenous preferences, while Licht- enstein and Slovic (2006) use the term ’construction of preferences’.
exhibit less present bias than their counterparts from the former Federal Republic of Germany, while they do not find a significant difference in patience. Hence, the German example suggests that there is no difference in patience due to differences in the political regime. The Global Preference Survey did not measure present bias, however we investigate the association between political regime and patience in 76 countries that allows us to document results for more countries.
In section 1 we claimed that the mere positive relationship between democracy and economic development and between patience and economic development may imply an association between patience and democracy. Here we briefly consider three plausible mechanisms based on the literature that may relate the political regime and patience.
On the one hand, Becker and Mulligan (1997) postulate theoretically that wealth- ier individuals tend to be more patient. Moreover, they claim that wealth causes patience. If it is the case and this finding holds on the country level, then wealthier countries should exhibit more patience which is in fact the case as demonstrated by Dohmen et al. (2018). Relatedly, Kotschy and Sunde (forthcoming) show that income shocks are conducive to changes in political institutions and hence affect the political regime, though the effect depends also on the level of inequality. As mentioned earlier, Acemoglu et al. (2019) find that democracy causes economic de- velopment, so one may draw the conclusion that democracy implies patience through rising income. Hence, the relationship between democracy and patience is mediated through wealth.10
A second explanation is based on evolutionary theory. More severe and less certain environments are conducive to individual strategies used in different walks of life that discount the future in favor of present goals. Similarly, less harsh and more predictable conditions lead to strategies that value more the future. As a consequence, it may be optimal to be less patient in harsher environments, so there is a link between patience and the harshness of the socio-ecological setting (Brumbach et al., 2009; Bulley and Pepper, 2017; Mart´ın et al., 2019; Ramos et al., 2013). As far as the political regime is responsible for or at least contributes to the harshness of the environment (less democratic countries experiencing a larger degree of harshness), then we would see a relationship between political regime and patience. Note that this evolutionary account is similar to previous ideas if one proxies the harshness of the environment with income.
As a third explanation, a more direct relationship between democracy and pa-
10However, Dohmen et al. (2018) doubt that wealth causes patience, because oil production (that can be seen as an exogenous source of income) does not correlate with patience.
tience is put forward by Charron and Lapuente (2010). They claim that there is a conditional association between democracy and the quality of government, and one of the channels is that more patient citizens represent a powerful demand side that pressures politicians to have a long-term view and hence a better government.
Therefore, here patience drives the improvement of government and this represents a link between patience and democracy.
In sum, some explanations relate patience to the political regime through income or the quality of life (that can be captured by income), while others propose a more direct association. The data that we have do not allow to test which of the mechanisms has a better explanatory power, but we can see if beyond income there is some relationship between patience and the political regime.
3. Political regime data
We use various sources of political regime measurement. All of them are widely used and the corresponding data are freely available. The political regime indices that we utilize are the Polity2 Score, the Economist Intelligence Unit’s (EIU) Democracy Index, the Freedom House’s (FH) Freedom in the World measure, the MaxRange (MR) index and the Unified Democracy Score (UDS).
We use different sources because measuring and scoring a political regime is problematic conceptually and methodologically as well. Although most individuals have an idea how a democratic country looks like, democracy does not have a precise definition that allows researchers to gauge it unambigously. That is, we do not have a list of all the well-defined characteristics that a society has to have to qualify as a full-fledged democracy. Or, put in another way, while there is some consensus on the core features (e.g. rule of people) that a democracy exhibits, beyond these elements there is a great debate.11 Most of these indices use a list of components that generally are thought to be characteristic of democracies and weigh them to come up with a score. Hence, most of the political regime indices consider several dimensions representing various aspects of democracy and then through weighting this multidimensional concept is reduced to a score. The weighting is often done arbitrarily and there is no established theoretical foundation on how this aggregation should be done (Treier and Jackman, 2008; Pemstein et al., 2010). Furthermore,
11Coppedge et al. (2017) refers to this problem as the issue of definition. For instance, the Polity2 Score qualifies the USA as a fully democratic country throughout the last century, even though the suffrage was not general and many segments of the population were excluded from the electorate.
In contrast, the MaxRange index considers general suffrage as a prerequisite of full democracy.
these indices do not take into account potential measurement errors that may affect if coefficients estimated with a regression are biased or not. Relatedly, some indices rely on polling data which is often not comparable across countries. Or, the data of interest may not be surveyed in the country, and in this case often a country expert provides an estimation of the variable in question, introducing some arbitrariness into the data collection.
We admit these shortcomings of the political regime indices and we use five of them to make sure that our findings are not due to some specificity of an index.
Moreover, one of the indices that we use is the Unified Democracy Score (Pemstein et al., 2010) that combines ten existing (among them the Polity2 Score and the Freedom House index) scores and has desirable properties (as will be explained later).
The Polity dataset (Marshall et al., 2016) is one of the most widely used dataset on political regimes covering almost all independent states over more than 200 years.
Polity2 contains revised Polity scores that assign to each country a score ranging from -10 (hereditary monarchy, like Saudi Arabia) to 10 (consolidated democracy, e.g. the Scandinavian countries).12 The main criticism raised against the Polity scores are the ones mentioned above: the aggregation of the different components into a score is not well-founded (Gleditsch and Ward, 1997) and measurement errors may be present (Bollen and Paxton, 2000; Treier and Jackman, 2008).
The EIU Democracy Index (Kekic, 2007) is a weighted average of five categories (electoral process and pluralism, civil liberties, functioning of government, political participation, and political culture) that are evaluated mostly based on experts’
assessment and public-opinion surveys. Scores range between 0 and 10, the minimum in our sample being 1.71 (Saudi Arabia) and the maximum 9.73 (Sweden). Besides the flaws that afflict all the indices that we use, another criticism raised against the EIU democracy index is the lack of transparency about who the experts are and their independence of special interests.13
The Freedom House’s (FH)Freedom in the World measure (FreedomHouse, 2012) considers 25 indicators (e.g. political rights, civil liberties), each of them receiving 0-4 points. Hence, the aggregate score per country ranges between 0 and 100. The minimum score in our sample is 10 (Saudi Arabia) and the maximum is 100 (Finland and Sweden). It should be noted that FH was criticised for having intimate links
12An alternative three-item regime categorization classifies countries with a score from -10 to -6 as autocracies, countries with a score from -5 to 5 as anocracies, while the rest of countries are considered democracies.
13See, for instance https://asia.nikkei.com/NAR/Articles/Peter-Tasker-The-flawed-science- behind-democracy-rankings, accessed 3rd June, 2019.
with the US government that FH acknowledges on its webpage (’Freedom House is a strong voice for a U.S. foreign policy that places the promotion of democracy as a priority.’).
The MaxRange dataset (R˚ange et al., 2015) also allows to rank regimes according to their extent of democracy. The researchers behind this dataset use seven main criteria (territorial control, political competition, civil liberties, electoral integrity and quality, constitutional consensus / legitimacy, general suffrage, constitutional order) that define if a country can be classified (and to which extent) as a democracy.
The range of this index goes also from 0 to 100, the minimum score in our sample being 11 (Thailand) and the maximum 100 (e.g. Sweden, Netherlands). Besides the cited problems related to indices measuring political regimes, we are not aware of any specific problem with this dataset.
The aim of the UDS score (Pemstein et al., 2010) is to leverage the efforts of scholars to measure political regimes and combine those assessments using a Bayesian latent variable approach. According to the makers of the UDS score, the resulting index is at least as reliable as the most reliable component measure, making it perhaps the most trustworthy measurement. In our sample Saudi Arabia has the minimum and Sweden the maximum score.
Although these indices are calculated by different organizations and institutions and use different methodology, the correlation between them is high. Pairwise corre- lation ranges from 0.723 (between MaxRange and EIU) to 0.969 (between EIU and UDS) and these correlations are significantly different from zero at all conventional significance levels.
4. Findings
We investigate how political regime indices associate with patience. We run OLS regressions and add new controls in each step. With each political regime index, we run the same regressions and we represent the results in an efficient way, using coefficient plots. The coefficient plots visualize the effects at the 10 / 5%
significance levels using thick / thin lines. Appendix A contains the coefficients and the significance of the variables of interest.14
The dependent variable is patience and we take the data from Falk et al. (2018) who standardize the patience measure at the individual level. That is, it has a mean
14We provide also an online appendix (section Appendix D) that contains the regressions with all the variables.
of zero and a standard deviation of one in the individual-level world sample. In the following regressions we use the patience measure aggregated on country level.15
Our first specification contains only the political regime index as an explanatory variable. We have converted all the political regime indices to a 0-1 scale. The higher the value, the more democratic is the country. This way the coefficients from the regressions with different political regime indices are easily comparable and we can depict them in one figure. The coefficient indicates the difference between the minimum and maximum values of the indices.16
In the second regression we add regional dummies (Sub-Saharan Africa, Middle East and North Africa also known as MENA, South Asia, East Asia Pacific, North America, South America, the baseline being the largest group, that is Europe and Central Asia). Falk et al. (2018) provide ample evidence on the regional disparities in patience, that is why we use regional controls in our specifications. Falk et al. (2018) show that populations of European ancestry tend to exhibit higher levels of patience than the world mean, all of the 10 most patient countries in the world being either located in the neo-European, English-speaking world, or else in Western Europe.
Moreover, the scores of the political regime indices also vary with region, countries in Western Europe, America and Australia being overwhelmingly democratic, while a more varied picture emerges in Africa and Asia. Therefore, without controling for region, we could mistakenly find a correlation between patience and democracy.
As a next step we introduce variables related to economic development (that is, GDP per capita and unemployment rate in the country in 2012). Based on our motivation and arguments in section 2, patience is related to political regime potentially through economic development. If we control for economic development, then we can see if there is an association between political regime and patience beyond this factor.
The fourth specification contains controls related to geography and climate (more precisely, average temperature, average precipitation and distance to Equator) that we take from Falk et al. (2018). It is important to control for factors related to geog- raphy and climate for several reasons. On the one hand, Easterly and Levine (2003), Gallup et al. (1999), Krugman (1997) among others show that geography has a large effect on economic development that in turn is related to patience and democracy.
15The country-level data are available on https://www.briq-institute.org/global- preferences/downloads.
16If the index did not have a minimum or maximum value, we took the lowest and highest value from the sample as minimum or maximum values. None of these alterations influence statistically the significance of the variables.
Moreover, geography determines to great extent the suitability for agriculture that has a big impact on time preferences according to Galor and ¨Ozak (2016). Lankina and Getachew (2006) put forward a theory that links geography to democratization through diffusion processes. In sum, since geography and climate is intimately cor- related with patience and some of our explanatory variables, it is essential to take them into account directly.
The last specification adds cultural variables, that we proxy with the share of dif- ferent religions in the population.17 Gorodnichenko and Roland (2011, 2017) show that cultural dimensions, notably the individualism vs. collectivism classification (based on Geert Hofstede’s work, Hofstede (2011)) is a strong predictor of economic development, as individualism has a positive impact on growth through innovation.
Moreover, the same authors (Gorodnichenko and Roland, 2015) show that individ- ualism and collectivism is theoretically and empirically also related to democrati- zation, individualism being strongly associated with average democracy scores and the length of democracy. Our proxy for culture is the share of religions (unaffili- ated, Protestant, Christian, Muslim, Hindu, Buddhist, Jewish, Folk religions, Other religions) in the population of the country.18 There are several reason to use the religious composition of a country as a proxy for culture. On the one hand, religion is tightly related to culture (Geertz, 1966; Dawson, 2013). Moreover, religion may be related to economic development as well. For instance, Weber (2013) shows how the evolution of capitalism was affected by the Protestant ethic. In fact Falk et al.
(2018) find that patience is highly correlated (0.45) with the share of Protestants in a country and this correlation is significant at the 1% significance level.
Since the Global Preference Survey data were collected in 2012, we use data from this year for all the variables that appear in our analysis. The only exception is the share of different religions in the population for which we have the nearest data from 2010.
Figure 2 shows that without further controls each of the political regime indices is positively and significantly correlated with patience, both at 10% (thick lines) and
17We obtain the data from the Pew Research Center website
(https://www.pewforum.org/2012/12/18/table-religious-composition-by-country-in-percentages/).
18We considered other cultural measures as well, more concretely the dimensions of Hofstede (2011) and the dimensions of Inglehart and Welzel (2010). In the end we did not choose the Hofstede dimensions since they capture preferences. More precisely, the dimension called long- term orientation conceptually is very similar to the idea of patience. In fact, Falk et al. (2018) claim that long-term orientation can be seen as a preference proxy. Concerning the Inglehart- Welzel dimensions, we did not use them as they are only available for a subset of countries that we consider, so we would have lost numerous observations.
Figure 2: Association between patience and democracy indices without and with controls, coefficient plots
5% (thin lines). More precisely, if we only consider the political regime indices, then all of them are significant at the 1% significance level.19 Moreover, these indices alone are able to explain 9.8% (MaxRange index) - 35.5% (UDS) of the variation in patience between countries according to adjusted R2-s.
Even if we add regional controls and the controls related to the economic perfor- mance of the countries, each political regime index is significant at the 5% significance level, though the coefficients decrease. Thus, even if we take into account the role of economic development that based on previous arguments seemed to be the most rel- evant confounder, the association between the political regime and patience remains clearly significant.
When adding variables related to geographical conditions and culture, the co- efficients of the political regime indices are still clearly positive, but in some cases the significance vanishes. When all controls are added, the EIU index and UDS still exhibit significance at 5%, the Polity2 and the FH indices are significant at 10%, while the MaxRange index fails to be significant. To put it differently, it takes to add an extensive set of controls related to regional location, economic development, geographical conditions and culture to erode somewhat the association between the political regime and patience. Overall, political regime seems to be intimately related to patience.
When considering the most complete regressions (see Appendix D for details), the following pattern can be observed. From the regional indices the dummy for North America exhibits a clear positive and always significant coefficient, indicating that the population of the countries in that region are more patient than the baseline (Europe and Central Asia), ceteris paribus. The rest of regional dummies fails to be significant. Variables related to economic development are consistently signifi- cant. The per-capita GDP has a strong positive correlation with patience in each case (that is, it is significant at the 1% significance level), while unemployment has a negative (though only marginally significant) association. The variables related to geographical conditions generally do not have a significant effect.20 From the cul- tural variable captured by the religious composition of the countries, the share of Protestants has a consistent positive effect (that is at least marginally significant),
19For more detail, see regression output tables in Appendix A.
20The only exception is the distance to Equator that in the specification with the MR index has a marginally significant positive coefficient.
while other religions do not exhibit significant coefficients in any of the cases.21 4.1. Relevance of political regime in patience
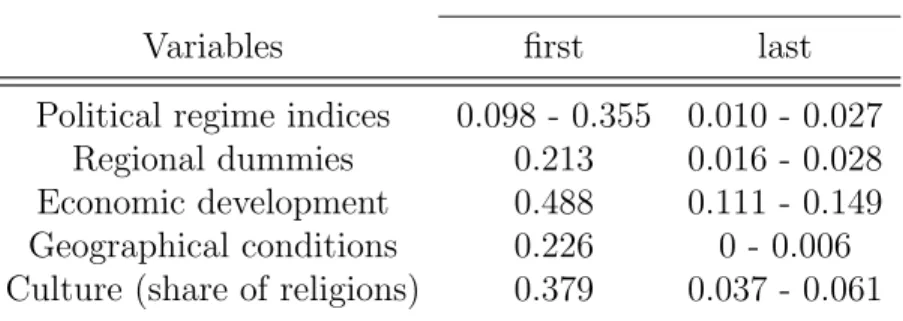
Given the importance of several factors discussed in the previous paragraph, it is natural to consider their relative relevance. To do that, we carry out the following exercise. Our aim is to provide an upper and lower bound on the explanatory power of the factors that we consider. To obtain the upper bound, we run regressions and only add the variable of interest and record the adjusted R2-s. In Table 1 we see that economic development is clearly the most important explanatory variables of patience because alone it is able to explain almost 50% of the variance in patience.
Culture (captured by religious composition) comes in second with an explanatory power of almost 40% when considered alone. The explanatory power of political regime varies with the index that we use. Three of these indices (EIU, FH and UDS) are able to explain the variability of patience at least as good as the regional dummies or the geographical conditions, while Polity2 and MR index have a lower explanatory power (11.6 and 9.8%, respectively). To obtain the lower bound, we consider all the variables, but now we add the variables of interest as last to see how much they can increase adjustedR2once all other factors are accounted for (see Table 1). Again, economic development is the most relevant factor as it is able to augment R2 by 11 - 15%, followed by culture (4-6%). Political regime indices fare only better than geographical conditions by boosting adjusted R2 by a mere 1 - 2.7% and it performs similarly to the regional dummies. In sum, political regime is an important factor to understand how patience varies across countries as in most cases it has a significant association with patience even after controlling for all other factors, but the overall relevance of political regime is clearly lower than the importance of economic development and culture (and is on par with regional variables).
4.2. What drives the results?
The previous findings strongly suggest that on the country level there is an as- sociation between patience and political regime that remains significant even after controlling for a host of potential confounders. Hence, the relationship seems to be genuine and not mechanic. In sections 1 and 2 we mentioned some potential mech- anism that may relate political regime and patience. While we cannot test what is the mechanism that links political regime to patience, it is still intriguing to ask
21We tested if quadratic terms of the political regime indices are missing from our preferred specification with all the control variables using the Wald-test and the likelihood-ratio test. These tests revealed no need to include quadratic terms in those regressions.
Table 1: The additional explanatory power of the explanatory variables when added first and last, adjustedR2-s
Increase in R2 when added
Variables first last
Political regime indices 0.098 - 0.355 0.010 - 0.027 Regional dummies 0.213 0.016 - 0.028 Economic development 0.488 0.111 - 0.149 Geographical conditions 0.226 0 - 0.006 Culture (share of religions) 0.379 0.037 - 0.061
what may be behind the result? A way to answer this question is to consider the components of the political regime indices. They are made up by many elements and based on what we have done up to this point it is not clear which one of those elements associate with patience. Next, we investigate how components in the EIU index associate with patience. As mentioned earlier, the EIU index has 5 categories (electoral process and pluralism, functioning of government, political participation, political culture, civil liberties).22
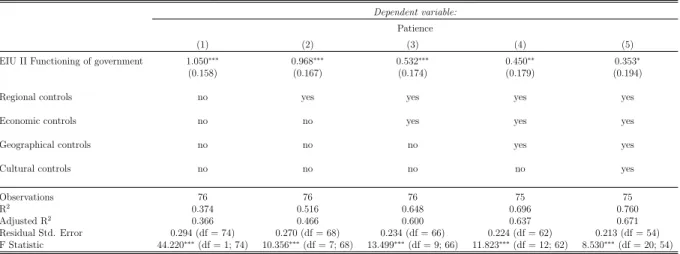
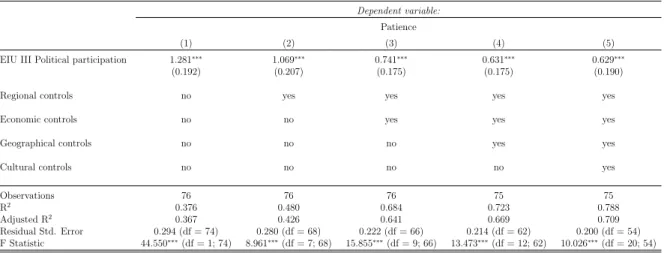
Figure 3 (and regressions in Appendix B) indicate that all components correlate at 1% significance level with patience without controls and also when regional dum- mies are added. With further controls components lose some of their significance, however even after adding all the controls only political culture becomes insignifi- cant. Civil liberties, functioning of government and electoral process and pluralism remain marginally significant. The category that is most strongly related to patience is political participation as it is significant at 1% even after taking into account all the controls.
The political participation score is based on information, among others, on voter participation in national elections, on the autonomy of religious, ethnic and other minorities, participation of women in the parliament, extent of political participation (membership in political parties and political NGO-s), citizens’ engagement with politics. Therefore, political activism and engagement seems to correlate most with patience. It remains to be investigated which are the exact channels that relate political participation to patience.
22In the case of Polity2 score, MR index and UDS there are no published subcomponents of the indices. The FH index has 25 indicators and tracking 25 indicators is unwieldy that is why we explore the components of the EIU index.
Figure 3: Association between patience and the categories of the EIU index, coefficient plots
5. Conclusion
Are people in democratic countries more patient than in non-democratic ones?
And if it is the case, then why? These questions are important as a growing literature documents how patience is positively related to accummulation decisions that in turn associate with a higher per-capita growth. Thus, it is natural to ask whether besides the economy political regime also correlates with patience. In fact, we find that more democracy goes hand in hand with more patience on the country level, a finding that is in general robust to taking into account potential confounders like regional location, economic development, culture or geographical conditions.23 We also show that even though political regime is important to understand patience, but economic development and culture are more important factors. Last, we show some evidence that the element of political regime that most associates with patience is political participation. Unfortunately, the data that we use allow us only to establish assocation, but not causal relationship. Further research is needed to see if such a relationship exists between political regime and patience.
References
Acemoglu, D., Johnson, S., Robinson, J.A., 2001. The colonial origins of comparative development: An empirical investigation. American economic review 91, 1369–
1401.
Acemoglu, D., Johnson, S., Robinson, J.A., Yared, P., 2008. Income and democracy.
American Economic Review 98, 808–42.
Acemoglu, D., Naidu, S., Restrepo, P., Robinson, J.A., 2019. Democracy does cause growth. Journal of Political Economy 127, 47–100.
Alesina, A., Fuchs-Sch¨undeln, N., 2007. Goodbye lenin (or not?): The effect of communism on people’s preferences. American Economic Review 97, 1507–1528.
Barro, R.J., 1996. Democracy and growth. Journal of economic growth 1, 1–27.
Barro, R.J., 1999. Determinants of democracy. Journal of Political economy 107, S158–S183.
23In a companion paper (Khayouti et al., 2020) we argue that following a similar line of reasoning one may expect an association between trust and political regime, but we fail to document any relationship.
Bauer, M., Blattman, C., Chytilov´a, J., Henrich, J., Miguel, E., Mitts, T., 2016. Can war foster cooperation? Journal of Economic Perspectives 30, 249–74.
Bauer, M., Cassar, A., Chytilov´a, J., Henrich, J., 2014. War’s enduring effects on the development of egalitarian motivations and in-group biases. Psychological Science 25, 47–57.
Becker, G.S., Mulligan, C.B., 1997. The endogenous determination of time prefer- ence. The Quarterly Journal of Economics 112, 729–758.
Becker, S.O., Boeckh, K., Hainz, C., Woessmann, L., 2016. The empire is dead, long live the empire! long-run persistence of trust and corruption in the bureaucracy.
The Economic Journal 126, 40–74.
Bollen, K.A., Paxton, P., 2000. Subjective measures of liberal democracy. Compar- ative political studies 33, 58–86.
Bowles, S., 1998. Endogenous preferences: The cultural consequences of markets and other economic institutions. Journal of Economic Literature 36, 75–111.
Brosig-Koch, J., Helbach, C., Ockenfels, A., Weimann, J., 2011. Still different after all these years: Solidarity behavior in east and west germany. Journal of Public Economics 95, 1373–1376.
Brumbach, B.H., Figueredo, A.J., Ellis, B.J., 2009. Effects of harsh and unpredictable environments in adolescence on development of life history strategies. Human Nature 20, 25–51.
Bulley, A., Pepper, G.V., 2017. Cross-country relationships between life expectancy, intertemporal choice and age at first birth. Evolution and Human Behavior 38, 652–658.
Cervellati, M., Jung, F., Sunde, U., Vischer, T., 2014. Income and democracy:
Comment. American Economic Review 104, 707–19.
Charron, N., Lapuente, V., 2010. Does democracy produce quality of government?
European Journal of Political Research 49, 443–470.
Cohen, J.D., Ericson, K.M., Laibson, D., White, J.M., 2016. Measuring time prefer- ences. Technical Report. National Bureau of Economic Research.
Colagrossi, M., Rossignoli, D., Maggioni, M.A., 2020. Does democracy cause growth? a meta-analysis (of 2000 regres- sions). European Journal of Political Economy 61, 101824. URL:
http://www.sciencedirect.com/science/article/pii/S0176268019300552, doi:https://doi.org/10.1016/j.ejpoleco.2019.101824.
Coppedge, M., Gerring, J., Lindberg, S.I., Skaaning, S.E., Teorell, J., 2017. V-dem comparisons and contrasts with other measurement projects. V-Dem Working Paper 45.
Cornsweet, T.N., 1962. The staircase-method in psychophysics. The American Jour- nal of Psychology 75, 485–491.
Dawson, C., 2013. Religion and culture. CUA Press.
Dohmen, T., Enke, B., Falk, A., Huffman, D., Sunde, U., 2018. Patience and com- parative development. Technical Report. Working Paper.
Easterly, W., Levine, R., 2003. Tropics, germs, and crops: how endowments influence economic development. Journal of Monetary Economics 50, 3–39.
Falk, A., Becker, A., Dohmen, T., Enke, B., Huffman, D., Sunde, U., 2018. Global evidence on economic preferences. The Quarterly Journal of Economics 133, 1645–
1692.
Falk, A., Becker, A., Dohmen, T., Huffman, D., Sunde, U., 2016.
The Preference Survey Module: A Validated Instrument for Measur- ing Risk, Time, and Social Preferences. Working Papers 2016-003.
Human Capital and Economic Opportunity Working Group. URL:
https://ideas.repec.org/p/hka/wpaper/2016-003.html.
Falk, A., Szech, N., 2013. Morals and markets. Science 340, 707–711.
Fehr, E., Hoff, K., 2011. Introduction: Tastes, castes and culture: The influence of society on preferences. The Economic Journal , F396–F412.
FreedomHouse, 2012. Freedom in the World. Technical Report. Retrieved from https://freedomhouse.org/report/freedom-world/freedom-world-2012.
Friehe, T., Pannenberg, M., 2017. Time preferences and political regimes: Evidence from reunified germany. Journal of Population Economics , 1–39.
Gallup, J.L., Sachs, J.D., Mellinger, A.D., 1999. Geography and economic develop- ment. International regional science review 22, 179–232.
Galor, O., ¨Ozak, ¨O., 2016. The agricultural origins of time preference. American Economic Review 106, 3064–3103.
Geertz, C., 1966. Religion as a cultural system, in: Banton, M. (Ed.), Anthropolog- ical Approaches to the Study of Religion. Tavistock Publications, pp. 1–46.
Gleditsch, K.S., Ward, M.D., 1997. Double take: A reexamination of democracy and autocracy in modern polities. Journal of Conflict Resolution 41, 361–383.
Gneezy, A., Fessler, D.M., 2011. Conflict, sticks and carrots: war increases prosocial punishments and rewards. Proceedings of the Royal Society B: Biological Sciences 279, 219–223.
Gorodnichenko, Y., Roland, G., 2011. Which dimensions of culture matter for long- run growth? American Economic Review 101, 492–98.
Gorodnichenko, Y., Roland, G., 2015. Culture, institutions and democratization.
Technical Report. National Bureau of Economic Research.
Gorodnichenko, Y., Roland, G., 2017. Culture, institutions, and the wealth of na- tions. Review of Economics and Statistics 99, 402–416.
Heineck, G., S¨ussmuth, B., 2013. A different look at lenin’s legacy: Social capital and risk taking in the two germanies. Journal of Comparative Economics 41, 789–803.
Hoff, K., Kshetramade, M., Fehr, E., 2011. Caste and punishment: The legacy of caste culture in norm enforcement. The Economic Journal 121, F449–F475.
Hofstede, G., 2011. Dimensionalizing cultures: The hofstede model in context. Online readings in psychology and culture 2, 8.
Inglehart, R., Welzel, C., 2010. The wvs cultural map of the world. World Values Survey .
Kekic, L., 2007. The economist intelligence unit’s index of democracy. The Economist 21, 1–11.
Khayouti, S., Kiss, h.J., Horn, D., 2020. Does trust associate with political regime?
Technical Report. mimeo.
Kohn, M.L., Naoi, A., Schoenbach, C., Schooler, C., Slomczynski, K.M., 1990. Po- sition in the class structure and psychological functioning in the united states, japan, and poland. American Journal of Sociology 95, 964–1008.
Kotschy, R., Sunde, U., forthcoming. Income shocks, inequality, and democracy. The Scandinavian Journal of Economics .
Krugman, P.R., 1997. Development, geography, and economic theory. volume 6. MIT press.
Lankina, T.V., Getachew, L., 2006. A geographic incremental theory of democra- tization: territory, aid, and democracy in postcommunist regions. World Politics 58, 536–582.
Lichtenstein, S., Slovic, P., 2006. The construction of preference. Cambridge Uni- versity Press.
Marshall, M.G., Gurr, T.R., Jaggers, K., 2016. Polity IV Project:Political Regime Characteristics and Transitions, 1800– 2000. Dataset Users Manual. Technical Report. Center for Systemic Peace.
Mart´ın, J., Bra˜nas-Garza, P., Esp´ın, A.M., Gamella, J.F., Herrmann, B., 2019. The appropriate response of spanish gitanos: Short-run orientation beyond current socio-economic status. Evolution and Human Behavior 40, 12–22.
Nunn, N., Wantchekon, L., 2011. The slave trade and the origins of mistrust in africa. American Economic Review 101, 3221–52.
Pemstein, D., Meserve, S.A., Melton, J., 2010. Democratic compromise: A latent variable analysis of ten measures of regime type. Political Analysis 18, 426–449.
Rainer, H., Siedler, T., 2009. Does democracy foster trust? Journal of Comparative Economics 37, 251–269.
Ramos, D., Victor, T., Seidl-de Moura, M.L., Daly, M., 2013. Future discounting by slum-dwelling youth versus university students in rio de janeiro. Journal of Research on Adolescence 23, 95–102.
R˚ange, M., Wilson, M.C., Sandberg, M., 2015. Introducing the maxrange dataset:
Monthly data on political institutions and regimes since 1789 and yearly since 1600, in: Second WINIR Conference (World Interdisciplinary Network for Institutional Research), Rio de Janeiro, Brazil, 10-13 September, 2015, pp. 1–35.
Shleifer, A., 2004. Does competition destroy ethical behavior? American Economic Review 94, 414–418.
Stigler, G.J., Becker, G.S., 1977. De gustibus non est disputandum. The American Economic Review 67, 76–90.
Treier, S., Jackman, S., 2008. Democracy as a latent variable. American Journal of Political Science 52, 201–217.
Voors, M.J., Nillesen, E.E., Verwimp, P., Bulte, E.H., Lensink, R., Van Soest, D.P., 2012. Violent conflict and behavior: a field experiment in burundi. American Economic Review 102, 941–64.
Weber, M., 1978. Economy and society: An outline of interpretive sociology. Uni- versity of California Press.
Weber, M., 2013. The Protestant ethic and the spirit of capitalism. Routledge.
Appendix A. Regressions - political regime indices and patience
Table A.2: Polity2 Score
Dependent variable:
Patience
(1) (2) (3) (4) (5)
Polity2 Score 0.474∗∗∗ 0.392∗∗ 0.289∗∗ 0.192 0.310∗
(0.146) (0.175) (0.141) (0.143) (0.164)
Regional controls no yes yes yes yes
Economic controls no no yes yes yes
Geographical controls no no no yes yes
Cultural controls no no no no yes
Observations 74 74 74 73 73
R2 0.128 0.335 0.619 0.673 0.761
Adjusted R2 0.116 0.265 0.566 0.608 0.669
Residual Std. Error 0.351 (df = 72) 0.320 (df = 66) 0.246 (df = 64) 0.235 (df = 60) 0.216 (df = 52) F Statistic 10.548∗∗∗(df = 1; 72) 4.753∗∗∗(df = 7; 66) 11.578∗∗∗(df = 9; 64) 10.295∗∗∗(df = 12; 60) 8.277∗∗∗(df = 20; 52)
∗p<0.1;∗∗p<0.05;∗∗∗p<0.01
Table A.3: EIU Democracy Index
Dependent variable:
Patience
(1) (2) (3) (4) (5)
EIU Democracy Index 1.076∗∗∗ 1.047∗∗∗ 0.638∗∗∗ 0.541∗∗∗ 0.584∗∗
(0.177) (0.203) (0.195) (0.203) (0.243)
Regional controls no yes yes yes yes
Economic controls no no yes yes yes
Geographical controls no no no yes yes
Cultural controls no no no no yes
Observations 76 76 76 75 75
R2 0.334 0.479 0.654 0.699 0.769
Adjusted R2 0.325 0.425 0.607 0.641 0.684
Residual Std. Error 0.304 (df = 74) 0.280 (df = 68) 0.232 (df = 66) 0.223 (df = 62) 0.209 (df = 54) F Statistic 37.126∗∗∗(df = 1; 74) 8.928∗∗∗(df = 7; 68) 13.885∗∗∗(df = 9; 66) 12.007∗∗∗(df = 12; 62) 9.010∗∗∗(df = 20; 54)
∗p<0.1;∗∗p<0.05;∗∗∗p<0.01
Table A.4: Freedom House Index
Dependent variable:
Patience
(1) (2) (3) (4) (5)
FH index 0.720∗∗∗ 0.726∗∗∗ 0.426∗∗∗ 0.316∗ 0.303∗
(0.136) (0.162) (0.152) (0.159) (0.179)
Regional controls no yes yes yes yes
Economic controls no no yes yes yes
Geographical controls no no no yes yes
Cultural controls no no no no yes
Observations 76 76 76 75 75
R2 0.276 0.442 0.641 0.685 0.758
Adjusted R2 0.266 0.384 0.592 0.624 0.668
Residual Std. Error 0.317 (df = 74) 0.290 (df = 68) 0.236 (df = 66) 0.228 (df = 62) 0.214 (df = 54) F Statistic 28.202∗∗∗(df = 1; 74) 7.680∗∗∗(df = 7; 68) 13.087∗∗∗(df = 9; 66) 11.223∗∗∗(df = 12; 62) 8.439∗∗∗(df = 20; 54)
∗p<0.1;∗∗p<0.05;∗∗∗p<0.01
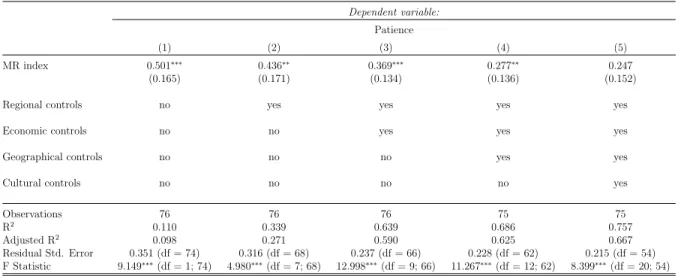
Table A.5: MaxRange Index
Dependent variable:
Patience
(1) (2) (3) (4) (5)
MR index 0.501∗∗∗ 0.436∗∗ 0.369∗∗∗ 0.277∗∗ 0.247
(0.165) (0.171) (0.134) (0.136) (0.152)
Regional controls no yes yes yes yes
Economic controls no no yes yes yes
Geographical controls no no no yes yes
Cultural controls no no no no yes
Observations 76 76 76 75 75
R2 0.110 0.339 0.639 0.686 0.757
Adjusted R2 0.098 0.271 0.590 0.625 0.667
Residual Std. Error 0.351 (df = 74) 0.316 (df = 68) 0.237 (df = 66) 0.228 (df = 62) 0.215 (df = 54) F Statistic 9.149∗∗∗(df = 1; 74) 4.980∗∗∗(df = 7; 68) 12.998∗∗∗(df = 9; 66) 11.267∗∗∗(df = 12; 62) 8.399∗∗∗(df = 20; 54)
∗p<0.1;∗∗p<0.05;∗∗∗p<0.01
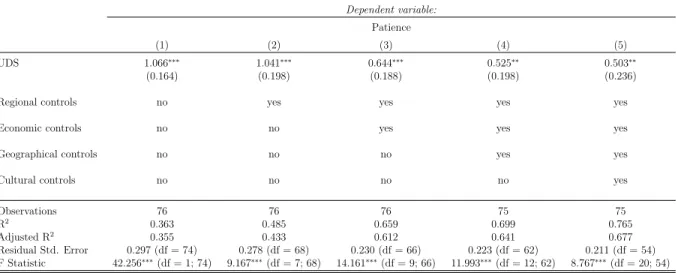
Table A.6: Unified Democracy Score
Dependent variable:
Patience
(1) (2) (3) (4) (5)
UDS 1.066∗∗∗ 1.041∗∗∗ 0.644∗∗∗ 0.525∗∗ 0.503∗∗
(0.164) (0.198) (0.188) (0.198) (0.236)
Regional controls no yes yes yes yes
Economic controls no no yes yes yes
Geographical controls no no no yes yes
Cultural controls no no no no yes
Observations 76 76 76 75 75
R2 0.363 0.485 0.659 0.699 0.765
Adjusted R2 0.355 0.433 0.612 0.641 0.677
Residual Std. Error 0.297 (df = 74) 0.278 (df = 68) 0.230 (df = 66) 0.223 (df = 62) 0.211 (df = 54) F Statistic 42.256∗∗∗(df = 1; 74) 9.167∗∗∗(df = 7; 68) 14.161∗∗∗(df = 9; 66) 11.993∗∗∗(df = 12; 62) 8.767∗∗∗(df = 20; 54)
∗p<0.1;∗∗p<0.05;∗∗∗p<0.01
Appendix B. Regressions - categories of the EIU index and patience
Table B.7: Electoral process and pluralism
Dependent variable:
Patience
(1) (2) (3) (4) (5)
EIU I Electoral process and pluralism 0.437∗∗∗ 0.406∗∗∗ 0.262∗∗ 0.198 0.272∗
(0.126) (0.147) (0.119) (0.123) (0.147)
Regional controls no yes yes yes yes
Economic controls no no yes yes yes
Geographical controls no no no yes yes
Cultural controls no no no no yes
Observations 76 76 76 75 75
R2 0.140 0.349 0.625 0.678 0.760
Adjusted R2 0.128 0.282 0.574 0.616 0.671
Residual Std. Error 0.345 (df = 74) 0.313 (df = 68) 0.241 (df = 66) 0.230 (df = 62) 0.213 (df = 54)
F Statistic 12.029∗∗∗(df = 1; 74) 5.200∗∗∗(df = 7; 68) 12.238∗∗∗(df = 9; 66) 10.889∗∗∗(df = 12; 62) 8.548∗∗∗(df = 20; 54)
∗p<0.1;∗∗p<0.05;∗∗∗p<0.01
Table B.8: Functioning of government
Dependent variable:
Patience
(1) (2) (3) (4) (5)
EIU II Functioning of government 1.050∗∗∗ 0.968∗∗∗ 0.532∗∗∗ 0.450∗∗ 0.353∗
(0.158) (0.167) (0.174) (0.179) (0.194)
Regional controls no yes yes yes yes
Economic controls no no yes yes yes
Geographical controls no no no yes yes
Cultural controls no no no no yes
Observations 76 76 76 75 75
R2 0.374 0.516 0.648 0.696 0.760
Adjusted R2 0.366 0.466 0.600 0.637 0.671
Residual Std. Error 0.294 (df = 74) 0.270 (df = 68) 0.234 (df = 66) 0.224 (df = 62) 0.213 (df = 54) F Statistic 44.220∗∗∗(df = 1; 74) 10.356∗∗∗(df = 7; 68) 13.499∗∗∗(df = 9; 66) 11.823∗∗∗(df = 12; 62) 8.530∗∗∗(df = 20; 54)
∗p<0.1;∗∗p<0.05;∗∗∗p<0.01