CERS-IE WORKING PAPERS | KRTK-KTI MŰHELYTANULMÁNYOK
INSTITUTE OF ECONOMICS, CENTRE FOR ECONOMIC AND REGIONAL STUDIES, BUDAPEST, 2020
Does trust associate with political regime?
SÁRA KHAYOUTI – HUBERT JÁNOS KISS – DÁNIEL HORN
CERS-IE WP – 2020/13
February 2020
https://www.mtakti.hu/wp-content/uploads/2020/02/CERSIEWP202013.pdf
CERS-IE Working Papers are circulated to promote discussion and provoque comments, they have not been peer-reviewed.
Any references to discussion papers should clearly state that the paper is preliminary.
Materials published in this series may be subject to further publication.
ABSTRACT
Since trust correlates with economic development and in turn economic development associates with political regime, we conjecture that there may be a relationship between trust and political regime. We investigate if trust aggregated on the country level correlates with the political regime. We do not find any significant association, with or without taking into account other factors (e.g. regional location, economic development, geographic conditions, culture) as well.
JEL codes: political regime, trust Keywords: D02, D12
Sára Khayouti
University of Amsterdam, Roetersstraat 11, 1018 WB Amsterdam, The Netherlands e-mail: sara.khayouti@student.uva.nl
and
Hubert János Kiss
KRTK KTI and Corvinus University of Budapest, 1097 Budapest, Tóth Kálmán u. 4.
and 1093 Budapest, Fővám tér 8, Hungary.
e-mail: kiss.hubert@krtk.mta.hu and
Dániel Horn
KRTK KTI and Corvinus University of Budapest, 1097 Budapest, Tóth Kálmán u. 4.
and 1093 Budapest, Fővám tér 8, Hungary.
e-mail: horn.daniel@krtk.mta.hu
Összefügg a bizalom a politikai berendezkedéssel?
KHAYOUTI SÁRA – KISS HUBERT JÁNOS – HORN DÁNIEL
ÖSSZEFOGLALÓ
A bizalom együttmozog a gazdasági fejlettséggel, a gazdasági fejlettség pedig korrelál a politikai berendezkedéssel, így azt várhatjuk, hogy a bizalom összefügg a politikai berendezkedéssel. Ebben a tanulmányban azt vizsgáljuk, hogy országszinten fennáll-e ez az összefüggés. Nem találunk szignifikáns kapcsolatot, sem egyéb tényezők nélkül, sem a régióval, gazdasági fejlettséggel, földrajzi adottságokkal és kultúrával kapcsolatos változók figyelembe vétele mellett.
JEL: D02; D12
Kulcsszavak: Bizalom, Politikai berendezkedés.
Does trust associate with political regime?
S´ara Khayouti
University of Amsterdam, Roetersstraat 11, 1018 WB Amsterdam, The Netherlands
Hubert J´anos Kiss1
KRTK KTI and Corvinus University of Budapest, 1097 Budapest, T´oth K´alm´an u. 4. and 1093 Budapest, F˝ov´am t´er 8, Hungary. Phone: +36304938062
D´aniel Horn2
KRTK KTI and Corvinus University of Budapest, 1097 Budapest, T´oth K´alm´an u. 4. and 1093 Budapest, F˝ov´am t´er 8, Hungary.
Abstract
Since trust correlates with economic development and in turn economic development asso- ciates with political regime, we conjecture that there may be a relationship between trust and political regime. We investigate if trust aggregated on the country level correlates with the political regime. We do not find any significant association, with or without taking into account other factors (e.g. regional location, economic development, geographic conditions, culture) as well.
Keywords: political regime, trust JEL codes: D02, D12
1. Introduction and literature
Simmel (1950) claims that ”trust is one of the most important synthetic forces within society”. A testament to this statement is the empirical finding that trust associates with economic development. Knack and Keefer (1997), Whiteley (2000), Dincer and Uslaner
Email addresses: sara.khayouti@student.uva.nl(S´ara Khayouti),kiss.hubert@krtk.mta.hu (Hubert J´anos Kiss),horn.daniel@krtk.mta.hu (D´aniel Horn)
1Corresponding author. Financial support from the Spanish Ministry of Economy, Industry and Compet- itiveness under the project ECO2017-82449-P, the National Research, Development & Innovation (NKFIH) under project K 119683 is gratefully acknowledged. This research was supported by the Higher Education Institutional Excellence Program of the Ministry for Innovation and Technology in the framework of the
”Financial and Public Services” research project (reference number: NKFIH-1163-10/2019) at Corvinus University of Budapest.
2Financial support from the National Research, Development & Innovation (NKFIH) under project K 124396 is gratefully acknowledged.
Preprint submitted to Elsevier February 18, 2020
(2010) and Beugelsdijk et al. (2004) provide evidence on the correlation between trust and national income (or economic growth), while Algan and Cahuc (2010) show that the rela- tionship is causal. Regarding the mechanisms behind the previous findings, Zak and Knack (2001) offer a theoretical and empirical support that trust affects the rate of investment, while Bjørnskov (2012) documents the effect of trust on schooling and the rule of law.
On the other hand, Acemoglu et al. (2019) claim that democracy has a significant positive effect on income. Weede (1996) suggests that the variance in growth rates is larger among autocracies than among democracies. Leblang (1996) claims that the political regime affects economic development indirectly through its commitment to property right.
If trust associates positively with economic development and at the same time political regime has a relationship with national income, then one may suspect that on average trust is higher in more democratic countries. In fact, many scholars have argued that trust is one of the main elements of social capital that in turn is necessary to have social integration, economic efficiency and democratic stability (Arrow, 1972; Coleman, 1988; Gambetta et al., 1988; Ostrom, 1990; Fukuyama, 1995; Putnam et al., 2000; Newton, 2001). We examine empirically if democracies indeed exhibit higher levels of trust.
Rainer and Siedler (2009) is the study that is closest to ours. They show that shortly after reunification East Germans were significantly less trusting than their Western counterparts, suggesting that political regime and trust are associated. However, interestingly decades of democracy were not able to close the trust gap. They show that economic hardships explain why trust levels in the former East Germany did not converge to those in the West. We have data on trust, political regime and economic development for 76 countries that allow us to see i) if there is an association between political regime and trust, and ii) if economic development is behind the previous association (if there is any).
2. Data
Trust does not have a precise definition. It is often used as an umbrella term that includes a set of positive values as reciprocity, civility, respect, solidarity or empathy. However, in surveys standard questions emerged to measure trust. An example is Falk et al. (2018) who measured several preferences worldwide, among them trust. More concretely, in their Global Preferences Survey respondents were asked if they assume that other people only have the best intentions (Likert scale, 0-10). This trust measure was validated beforehand (Falk et al., 2016), predicting trusting behavior in incentivized trust games. We use this global trust survey and link it to measures of political regime.3
We take five widely used indices of political regime for 2012 (the year that the Global Preference Survey was executed) that are freely available. The Polity2 dataset (Marshall et al., 2016) assigns to each country a score ranging from -10 (hereditary monarchy) to 10 (consolidated democracy). The EIU Democracy Index (Kekic, 2007) considers five dimen- sions of political regime (e.g. civil liberties and political participation) and combines the
3Trust data from the Global Preferences Survey are available at https://www.briq-institute.org/global- preferences/home.
scores in each dimension into a final one that ranges between 0 and 10. The Freedom House’s (FH) Freedom in the World index (FreedomHouse, 2012) assigns 0-4 points to 25 separate indicators (e.g. political rights, civil liberties), yielding an aggregate score per country rang- ing between 0 and 100. The MaxRange (MR) dataset (R˚ange et al., 2015) is based on seven main criteria (e.g. political competition, electoral integrity and quality) resulting in an in- dex that goes from 0 to 100. The Unified Democracy Score (UDS) (Pemstein et al., 2010) combines 10 existing indices using a Bayesian latent variable approach in a way that it is at least as reliable as the most reliable component measure. We use different political regime indices because there is no consensual list with all the desired features that a full-fledged democracy should have. Hence, there is no perfect political regime index and a way to deal with this issue is to consider several such indices.4
3. Findings
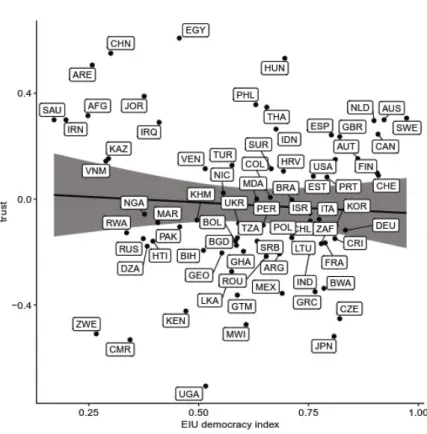
Figure 1: Trust and EIU democracy index, no additional controls
Figure 1 depicts the simple association between the Polity2 index and trust. Using other indices does not change the overall picture. The magnitude of correlation varies between -0.0297 (UDS) and -0.2286 (MR) and is significant only for MR at the 5% significance level.
4Pairwise correlation between the indices that we use ranges from 0.723 (MR vs. EIU) to 0.969 (EIU vs.
UDS), all of them being significant at the 1% significance level.
3
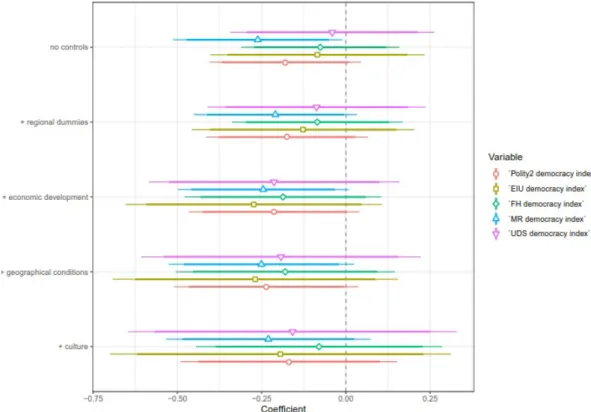
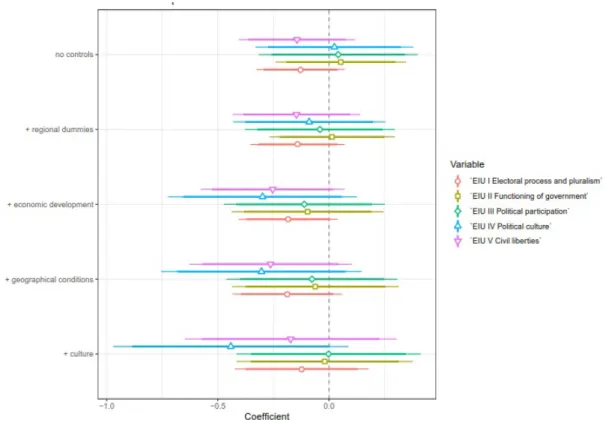
Figure 2: Association between trust and political regime without and with controls, coefficient plots
Hence, most of the correlations fail to be significant, moreover all of them have a negative sign, contrary to our expectation.5
To gain a better insight, we carry out an OLS regression analysis for each political regime index. The same regressions are run always and we use coefficient plots to represent the results in a parsimonious way. Thick / thin lines indicate effects at the 10 / 5% significance levels.
The dependent variable is always trust, aggregated on country level. Our first specifica- tion has only the political regime index (converted to a 0-1 scale, higher values indicating more democracy) as regressor. Next, we add regional dummies as Falk et al. (2018) docu- ment regional disparities in trust. Subsequently, we also control for economic performance using GDP per capita and unemployment rate, as economic development may be correlated both with trust and political regime. The fourth specification adds controls related to geo- graphical conditions (average temperature, average precipitation and distance to Equator) taken from Falk et al. (2018) as that study reports an association between these factors and trust. For the same reason, we also include controls for culture in the last specification, captured by the share of different religions in the population.6
As Figure 2 indicates, contrary to our expectation all coefficients are negative and gener-
5In Appendix A we report the same figure with the other political regime indices.
6Data obtained from the Pew Research Center website (https://www.pewforum.org/2012/12/18/table- religious-composition-by-country-in-percentages/).
ally are insignificant. More concretely, 3 of our 5 indices (EIU, FH and UDS) fail to exhibit even marginal significance in any of the specifications, Polity2 is marginally significant in one specification, while the MaxRange score is at least marginally significant in 4 of our 5 specifications. Importantly, in the most comprehensive specification none of the indices proves to be significant.7 Overall, the data that we study suggest that trust and political regime do not associate.8
4. Conclusion
Even though the extant literature suggests a positive correlation between trust and the level of democracy, we fail to find such association using the worldwide trust survey by Falk et al. (2018) and well-known political regime indices. The result does not change even if we take into account a wide range of controls.
References
Acemoglu, D., Naidu, S., Restrepo, P., Robinson, J. A., 2019. Democracy does cause growth. Journal of Political Economy 127 (1), 47–100.
Algan, Y., Cahuc, P., 2010. Inherited trust and growth. American Economic Review 100 (5), 2060–92.
Arrow, K. J., 1972. Gifts and exchanges. Philosophy & Public Affairs, 343–362.
Beugelsdijk, S., De Groot, H. L., Van Schaik, A. B., 2004. Trust and economic growth: a robustness analysis.
Oxford economic papers 56 (1), 118–134.
Bjørnskov, C., 2012. How does social trust affect economic growth? Southern Economic Journal 78 (4), 1346–1368.
Coleman, J. S., 1988. Social capital in the creation of human capital. American Journal of Sociology 94, S95–S120.
Dincer, O. C., Uslaner, E. M., 2010. Trust and growth. Public Choice 142 (1-2), 59.
Falk, A., Becker, A., Dohmen, T., Enke, B., Huffman, D., Sunde, U., 2018. Global evidence on economic preferences. The Quarterly Journal of Economics 133 (4), 1645–1692.
Falk, A., Becker, A., Dohmen, T. J., Huffman, D., Sunde, U., 2016. The preference survey module: A validated instrument for measuring risk, time, and social preferences.
FreedomHouse, 2012. Freedom in the world. Tech. rep., retrieved from https://freedomhouse.org/report/freedom-world/freedom-world-2012.
Fukuyama, F., 1995. Trust: The social virtues and the creation of prosperity. Vol. 99. Free Press New York, NY.
Gambetta, D., et al., 1988. Trust: Making and breaking cooperative relations. B. Blackwell New York, NY.
Kekic, L., 2007. The economist intelligence unit’s index of democracy. The Economist 21, 1–11.
Khayouti, S., Kiss, H. J., Horn, D., 2020. Patient democracies? Tech. rep., mimeo.
Knack, S., Keefer, P., 1997. Does social capital have an economic payoff? a cross-country investigation. The Quarterly journal of economics 112 (4), 1251–1288.
7Section Appendix B contains the regressions that are represented in Figure 2. We carry out one more analysis. The EIU index has five categories (electoral process and pluralism, functioning of government, political participation, political culture, civil liberties) for which scores are published. We run the same regressions as before to see if any of those categories associates with trust, but we fail to see any consistent pattern. See Figure C.7 in Appendix C.
8In a companion paper (Khayouti et al., 2020), we document significant relationship between political regime and patience.
5
Leblang, D. A., 1996. Property rights, democracy and economic growth. Political Research Quarterly 49 (1), 5–26.
Marshall, M. G., Gurr, T. R., Jaggers, K., 2016. Polity iv project:political regime characteristics and transitions, 1800– 2000. dataset users manual. Tech. rep., Center for Systemic Peace, retrieved from http://www.nber.org/ens/feldstein/ENSASources/CSP/P olity
Newton, K., 2001. Trust, social capital, civil society, and democracy. International Political Science Review 22 (2), 201–214.
Ostrom, E., 1990. Governing the commons: The evolution of institutions for collective action. Cambridge University Press.
Pemstein, D., Meserve, S. A., Melton, J., 2010. Democratic compromise: A latent variable analysis of ten measures of regime type. Political Analysis 18 (4), 426–449.
Putnam, R. D., et al., 2000. Bowling alone: The collapse and revival of American community. Simon and Schuster.
Rainer, H., Siedler, T., 2009. Does democracy foster trust? Journal of Comparative Economics 37 (2), 251–269.
R˚ange, M., Wilson, M. C., Sandberg, M., 2015. Introducing the maxrange dataset: Monthly data on po- litical institutions and regimes since 1789 and yearly since 1600. In: Second WINIR Conference (World Interdisciplinary Network for Institutional Research), Rio de Janeiro, Brazil, 10-13 September, 2015. pp.
1–35.
Simmel, G., 1950. The sociology of Georg Simmel. Vol. 92892. Simon and Schuster.
Weede, E., 1996. Political regime type and variation in economic growth rates. Constitutional political economy 7 (3), 167–176.
Whiteley, P. F., 2000. Economic growth and social capital. Political studies 48 (3), 443–466.
Zak, P. J., Knack, S., 2001. Trust and growth. The economic journal 111 (470), 295–321.
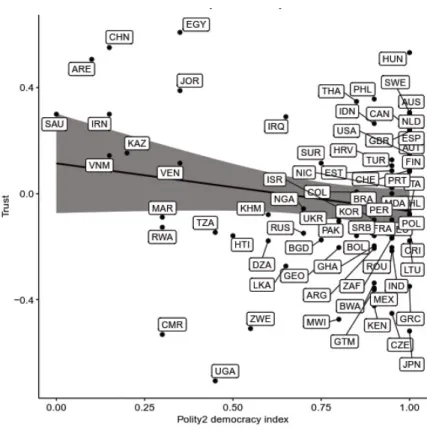
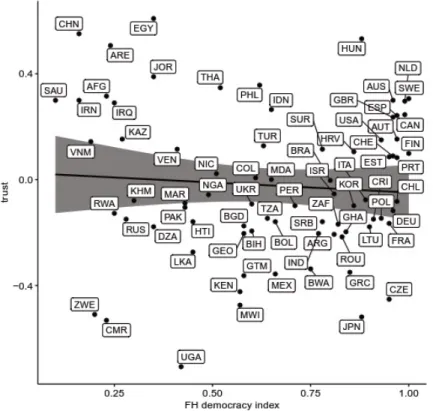
Appendix A. Online appendix - scatterplots
In this Appendix we represent the scatterplots between the political regime indices and trust.
Figure A.3: Trust and the Polity2 score, no additional controls
7
Figure A.4: Trust and the Freedom House index, no additional controls
Figure A.5: Trust and the MaxRange index, no additional controls
Figure A.6: Trust and the Unified Democracy Score, no additional controls
9
Appendix B. Online appendix - regressions
Table B.1: Polity2 Score
Dependent variable:
Trust
(1) (2) (3) (4) (5)
Polity2 Score −0.180 −0.175 −0.213 −0.236∗ −0.169
(0.115) (0.123) (0.129) (0.140) (0.164)
Regional controls no yes yes yes yes
Economic controls no no yes yes yes
Geographical controls no no no yes yes
Cultural controls no no no no yes
Observations 74 74 74 73 73
R2 0.033 0.407 0.422 0.435 0.568
Adjusted R2 0.020 0.344 0.341 0.322 0.401
Residual Std. Error 0.275 (df = 72) 0.225 (df = 66) 0.226 (df = 64) 0.230 (df = 60) 0.216 (df = 52) F Statistic 2.459 (df = 1; 72) 6.477∗∗∗(df = 7; 66) 5.195∗∗∗(df = 9; 64) 3.850∗∗∗(df = 12; 60) 3.412∗∗∗(df = 20; 52)
∗p<0.1;∗∗p<0.05;∗∗∗p<0.01
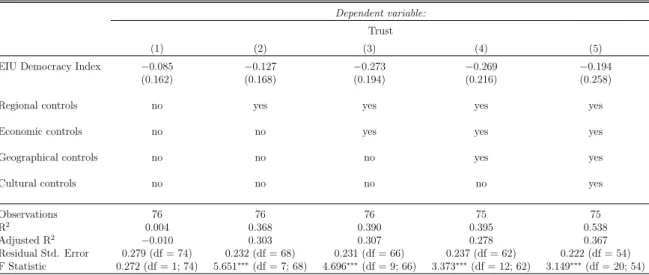
Table B.2: EIU Democracy Index
Dependent variable:
Trust
(1) (2) (3) (4) (5)
EIU Democracy Index −0.085 −0.127 −0.273 −0.269 −0.194
(0.162) (0.168) (0.194) (0.216) (0.258)
Regional controls no yes yes yes yes
Economic controls no no yes yes yes
Geographical controls no no no yes yes
Cultural controls no no no no yes
Observations 76 76 76 75 75
R2 0.004 0.368 0.390 0.395 0.538
Adjusted R2 −0.010 0.303 0.307 0.278 0.367
Residual Std. Error 0.279 (df = 74) 0.232 (df = 68) 0.231 (df = 66) 0.237 (df = 62) 0.222 (df = 54) F Statistic 0.272 (df = 1; 74) 5.651∗∗∗(df = 7; 68) 4.696∗∗∗(df = 9; 66) 3.373∗∗∗(df = 12; 62) 3.149∗∗∗(df = 20; 54)
∗p<0.1;∗∗p<0.05;∗∗∗p<0.01
Table B.3: Freedom House Index
Dependent variable:
Trust
(1) (2) (3) (4) (5)
FH index −0.076 −0.085 −0.187 −0.180 −0.080
(0.119) (0.129) (0.149) (0.166) (0.187)
Regional controls no yes yes yes yes
Economic controls no no yes yes yes
Geographical controls no no no yes yes
Cultural controls no no no no yes
Observations 76 76 76 75 75
R2 0.005 0.366 0.387 0.391 0.535
Adjusted R2 −0.008 0.301 0.303 0.274 0.363
Residual Std. Error 0.279 (df = 74) 0.232 (df = 68) 0.232 (df = 66) 0.238 (df = 62) 0.223 (df = 54) F Statistic 0.403 (df = 1; 74) 5.620∗∗∗(df = 7; 68) 4.623∗∗∗(df = 9; 66) 3.323∗∗∗(df = 12; 62) 3.107∗∗∗(df = 20; 54)
∗p<0.1;∗∗p<0.05;∗∗∗p<0.01
Table B.4: MaxRange Index
Dependent variable:
Trust
(1) (2) (3) (4) (5)
MR index −0.261∗∗ −0.209∗ −0.245∗ −0.251∗ −0.230
(0.128) (0.124) (0.130) (0.140) (0.155)
Regional controls no yes yes yes yes
Economic controls no no yes yes yes
Geographical controls no no no yes yes
Cultural controls no no no no yes
Observations 76 76 76 75 75
R2 0.053 0.388 0.404 0.410 0.552
Adjusted R2 0.040 0.325 0.323 0.296 0.386
Residual Std. Error 0.272 (df = 74) 0.228 (df = 68) 0.229 (df = 66) 0.234 (df = 62) 0.219 (df = 54) F Statistic 4.154∗∗(df = 1; 74) 6.164∗∗∗(df = 7; 68) 4.980∗∗∗(df = 9; 66) 3.594∗∗∗(df = 12; 62) 3.325∗∗∗(df = 20; 54)
∗p<0.1;∗∗p<0.05;∗∗∗p<0.01
11
Table B.5: Unified Democracy Score
Dependent variable:
Trust
(1) (2) (3) (4) (5)
UDS index −0.041 −0.087 −0.213 −0.193 −0.158
(0.154) (0.165) (0.190) (0.212) (0.249)
Regional controls no yes yes yes yes
Economic controls no no yes yes yes
Geographical controls no no no yes yes
Cultural controls no no no no yes
Observations 76 76 76 75 75
R2 0.001 0.365 0.384 0.388 0.537
Adjusted R2 −0.013 0.300 0.300 0.270 0.365
Residual Std. Error 0.280 (df = 74) 0.232 (df = 68) 0.232 (df = 66) 0.239 (df = 62) 0.222 (df = 54) F Statistic 0.069 (df = 1; 74) 5.585∗∗∗(df = 7; 68) 4.569∗∗∗(df = 9; 66) 3.276∗∗∗(df = 12; 62) 3.131∗∗∗(df = 20; 54)
∗p<0.1;∗∗p<0.05;∗∗∗p<0.01
Appendix C. Online appendix - trust and components of EIU Democracy index
In Figure C.7 we run the same regressions as for Figure 2, but not for different political regime indices. Here our aim is to see if building blocks of the EIU Democracy index associates with trust.
Figure C.7: Trust and the components of th EIU index, no additional controls
13