Socioeconomic Factors Predicting Depression Differ in the Acute Stage and at 1 year After Ischemic Stroke or TIA
Agnes Mirolovics,
MD,*
,† Magdolna Bokor,
MD, PhD,† Bal azs Dobi, ‡ Judit Zsuga,
MD, PhD,§ and D aniel Bereczki,
MD, PhD, DSc, FESO{
,k
Introduction:Considerable depressive symptoms follow stroke in about one third of patients. Initial depressive symptoms may wane after the acute phase of stroke, but persisting depressive symptoms adversely affect rehabilitation and quality of life.
We set forth to evaluate predictors of depressive symptoms with a focus on socio- economic factors.Methods:We evaluated clinical features and socioeconomic char- acteristics in 233 consecutive patients with acute ischemic stroke or TIA. Depressive symptoms could be evaluated in 168 subjects in the acute phase with a repeated testing after a mean of 14.7 months via telephone interview in 116 patients. Survival status, scores on the Center for Epidemiologic Studies-Depression Scale (CES-D), Beck Depression Inventory (BDI) and disability (modified Rankin scale, mRS) were recorded.Results:In the acute phase, employment status (p = 0.037) and level of education (p = 0.048) whereas one year later dependency (mRS3, p = 0.002) and income (p = 0.012) were the significant predictors of the severity of depressive symptoms. A change from independent (mRS2) to dependent living predicted worsening depressive symptoms (p = 0.008), whereas improving to functional inde- pendence from an initially dependent condition was associated with diminishing depressive symptoms (p = 0.077 for CES-D and p = 0.044 for BDI) in thefirst year after an acute ischemic cerebrovascular event.Conclusions:Predictors of the severity of depressive symptoms differed in the acute phase and at follow-up. In addition to disability, education and employment status in the acute phase and income in the late phase predict the severity of depressive symptoms after ischemic stroke or TIA.
Key Words: Stroke—Education—Employment Status—Income—Disability—
Depression—Follow-up
© 2020 The Author(s). Published by Elsevier Inc. This is an open access article under the CC BY-NC-ND license. (http://creativecommons.org/licenses/by-nc-nd/4.0/)
Introduction
The most prevalent psychiatric complication after stroke is depression. Clinically relevant depressive symp- toms appear in about one third of cases after stroke.1,2
The frequency of post stroke depression (PSD) is highest in thefirst year after stroke.3In a recent Spanish survey of patients with TIA and minor stroke 43.9 % had post stroke
From the *Janos Szentagothai Doctoral School of Neurosciences, Semmelweis University, Budapest, Hungary;†Departmet of Neurology, National Institute of Psychiatry and Addictions Nyíro Gyula, Budapest, Hungary;‡Department of Probability Theory and Statistics, E€otv€os Lorand University, Budapest, Hungary; §Department of Health Systems Management and Quality Management in Health Care, Faculty of Public Health, University of Debrecen, Debrecen, Hungary;{Department of Neurology, Semmelweis University, Budapest, Hungary; andkMTA-SE Neu- roepidemiological Research Group, Budapest, Hungary.
Received June 8, 2020; revision received August 4, 2020; accepted August 6, 2020.
The work was partly supported by grants from the National Brain Research Program (KTIA-NAP-13-1-2013-0001), and the New National Excel- lence Program (UNKP-17-3) of the Ministry of Human Resources of the Government of Hungary.
Corresponding author. E-mail:bereczki.daniel@med.semmelweis-univ.hu.
1052-3057/$ - see front matter
© 2020 The Author(s). Published by Elsevier Inc. This is an open access article under the CC BY-NC-ND license.
(http://creativecommons.org/licenses/by-nc-nd/4.0/) https://doi.org/10.1016/j.jstrokecerebrovasdis.2020.105241
Journal of Stroke and Cerebrovascular Diseases, Vol. 29, No. 11 (November), 2020: 105241 1
depression (PSD) at 10 days after the cerebrovascular event and 8.6 % of patients had PSD 12 months later.4 Severity of depressive symptoms often changes in thefirst year after stroke. Berg et al reported that 46% of those who were depressive during thefirst 2 months were also depressive at 12 and/or 18 months after stroke. Only 12%
of patients were depressive for thefirst time at 12 or 18 months.5
Depression in thefirst 3 months after stroke is a risk for early case fatality.6Yuan et al reported poor outcome in those who had higher depression scores in the acute phase after stroke,7and post stroke depressive symptoms were associated with worse functional outcome even in those treated with antidepressant medication.8 The Bergen Stroke Study confirmed that depression both before and after stroke are predictors of mortality among stroke patients,9and results from the South London Stroke Reg- istry also proved that depression is an independent pre- dictor of poor health outcomes.10 On the other hand, a lower rate of depression was associated with return to work at 1 year in the South London Stroke Registry.11 Although the adverse effect of depression on stroke out- come has long been acknowledged, attention to recognize depressive symptoms after stroke is insufficient, and depression is undertreated in this patient population.12
Depression following stroke is predicted by several factors, of which physical disability, stroke severity and cognitive impairment were the most consistent ones.13In our previous study we found that depressive symptoms may persist long after stroke, and scores on the depression scales at 4 years after stroke correlated with both stroke severity and depres- sive scores in the acute phase.14 Pre-stroke socioeconomic factors may also contribute to PSD.15Living alone and hav- ing few social contacts have been found to predict depres- sion.16,17 We previously found that disadvantaged socioeconomic environment is associated with worse out- come after stroke,18and we assume that socioeconomic dep- rivation after stroke is also related to persistent depressive symptoms, thus exaggerating the adverse effect of disadvan- taged socioeconomic environment on stroke outcome.
In our single center prospective study with one-year follow-up we evaluated predictors of depressive symp- toms in the acute phase and at 1 year after ischemic stroke or transient ischemic attack (TIA). The primary endpoint of our study was the presence of depressive symptoms at 1 year after the index cerebrovascular event. Secondary endpoints were depressive symptoms immediately after ischemic stroke/TIA, and the change (i.e. improvement or worsening) of depressive symp- toms by comparing CES-D scores at discharge from hospital and at follow-up one year later. We hypothe- sized that in addition to functional disability, some socioeconomic factors like education level, employment status, income, and living conditions, may also affect depressive symptoms both in the acute stage and at one year after the acute event.
Methods Patients
Data of consecutive patients admitted for acute cerebro- vascular disease between February 2013 and April 2014 to the Department of Neurology of the Nyíro Gyula National Institute of Psychiatry and Addictions, Buda- pest, Hungary were prospectively collected. The depart- ment is responsible for the neurological care of the 13th district of Budapest, as well as the citizens of two other Hungarian towns: Pilisv€or€osvar and Csobanka. These areas cover approximately 133,000 people. We enrolled consecutive 250 inpatient cases with acute cerebrovascu- lar disorder who were admitted to our department during the 13-month period of our study except for those who were admitted after intravenous thrombolysis (IVT) or mechanical thrombectomy (MT) at a primary stroke cen- ter. Of the 250 patients 89 (35.3%) were originally admit- ted to a primary stroke center, but being ineligible for IVT or MT, were transferred further to the department of the study, according to the regional patient admission rules.
Data collection
We collected information using healthcare data and astruc- tured questionnairewithin thefirst week of hospitalization. The same neurologist performed both the patient examination and data collection. We recorded stroke severity on admis- sion by the National Institutes of Health Stroke Scale (NIHSS),19as well as the affected brain hemisphere, presence of speech disturbance and routine laboratory values. We also recorded the presence of hypertension, diabetes mellitus, atrialfibrillation (AF), heart disease, other arrhythmia, periph- eral vascular disease, psychiatric disease, liver and lung dis- ease. We recorded data on alcohol consumption, smoking, regular medications, type of the earlier stroke, treatment of AF if present, the pre-stroke modified Rankin scale score (mRS), the CHA2DS2VASc score,20 the HAS-BLED score,21 admission brain CT scan results (no change, ischemic or hem- orrhagic lesion or subarachnoid hemorrhage), blood pressure and heart rate. Comorbidity was measured by summing the observed comorbid conditions and medications, effectively creating a comorbidity-polypharmacy score (CPS,22). It needs to be noted that data assessment focused on stroke-relevant conditions, therefore information on comorbidity was incom- plete, and we also had limited information on depression in the patients’medical history.
Regarding sociodemographic data we recorded the type of residence (stand-alone house, apartment in build- ing made of brick, panel apartment houses built of con- cretei.e. the main urban housing built in the soviet era, also called Larsen-Nielsen-type building , and other type: retirement home, homeless shelter), marital state, level of education, profession, employment status, prop- erty ownership, monthly income per capita, and number of children.
2 A. MIROLOVICS ET AL.
Additional information relating to hospital stay and dis- charge were also recorded, such as the TOAST classifica- tion23of the stroke, thefindings of carotid duplex scan and of echocardiography; medication use on the ward (anticoa- gulants, antihypertensives, antidiabetics, statins); and condi- tion at discharge (survival status and mRS score). To evaluate the severity of depressive symptoms we used the Center for Epidemiologic Studies Depression Scale (CES-D scale)24and the Beck Depression Inventory (BDI) 13 item short form.25In our primary analyses we used results of the CES-D as it has been shown to be a reliable tool after stroke in a systematic review of PSD studies.26
A one-year follow-up assessment with a mean of 13.9 months from the stroke event was performed via tele- phone interview. Survival status, new stroke event, scores on the depression scales and mRS were recorded. Depres- sion scale scores in the acute phase were available for 168 patients, of those repeated scoring was possible in 116 patients with a mean follow-up of 14.7 months. In patients with lack of communication (aphasia or severe general condition), we gained information from family members or from medical documentation.
All procedures performed in this study involving human participants were in accordance with the ethical standards of the Ethics Committee of Semmelweis Uni- versity, Budapest, Hungary, and with the 1964 Helsinki declaration and its later amendments. The study was approved by the Ethics Committee of Semmelweis Uni- versity, Budapest, Hungary (No: TUKEB 8/2013), and written consent was obtained from the patients.
Statistical analysis
We analyzed the relationship between discharge and follow-up depression using correlation analyses (Pearson, Kendall and Spearman). Linear regression was used for the analysis of the continuous depression scales. This included models for the discharge scores, follow-up scores and their differences. First, all potential covariates were included into univariate regression models to check their effects on the response variable. The multiple regres- sion models then were built the following way: we defined a set of important control variables which were included in all models of a given dependent variable.
These were sex, age, admission NIHSS and discharge mRS. We then assessed the effect of all other possible covariates one-by-one, controlled by the previously set variables. Covariate selection was based on the relevance and validity of the variables, and significance at least at the 0.1 level was secondary support information. In this last step we also considered the viability of the overall model, the effect of similar variables and interaction terms. We also aimed to synchronize models with similar dependent variables. Automatized tools such as stepwise regression were considered but discarded due to small sample size and missing data.
The overall effect of categorical variables with more than two levels in multivariate models was tested with likeli- hood-ratio test. (The individual effect of the levels is also dis- played, see the“p-value (overall)”column in the relevant tables.) The goodness offit of the linear regression models was tested using statistical and visual tools, namely the Sha- piro-Wilks test and the quantile-quantile plot.
R version 3.6.2 was used for data analysis with pack- ages ggplot2, gridExtra, survival, survminer, MASS, gen- eralhoslem, psych, rms, stringr and questionr.
Results
Of the 250 consecutively included patients, there were 187 cases of ischemic stroke, 46 cases of transient ischemic attack, 16 cases of intracerebral hemorrhage, and 1 case of subarachnoid hemorrhage. In our analyses we include those 233 patients who had acute ischemic cerebrovascu- lar disease (i.e. ischemic stroke or TIA). Depressive symp- toms could be evaluated in 168 subjects in the acute phase with a repeated testing after one year (mean of 14.7 months from the stroke event) via telephone interview in 116 patients. The patientflow chart is presented inFig. 1.
We found evidence of pre-stroke depression in 27 patients. Pre-stroke depression had significant effect on dis- charge depression. However, due to incomplete information in many patients, pre-stroke depression was not included in thefinal models as this uncertainty would have introduced serious bias in the models. We found no significant effect of CPS in any of our models, thus the comorbidity-polyphar- macy score was excluded from the analysis.
Baseline features
Basic features of the study population at baseline are presented inTable 1. Patients whose depression could be assessed using the CES-D scale were significantly younger on average than patients with missing CES-D data. This is true for both baseline and follow-up values (67.9§13.5 (n = 168) vs. 76.4 § 11.7 (n = 65) years, p<0.001 and 67.0 § 13.6 (n=116) vs. 73.6 § 12.7 (n = 117) years, p<0.001 respectively using Welch's t-test). The 8.5 years difference in mean ages in the acute phase and the 6.6 years difference at one year suggests that older age is associated with either more reluctance or less physical or mental capacity due to the acute stroke or other comor- bidities to cooperate in the evaluation of the severity of depressive symptoms.
Findings at discharge
At discharge 67% of the initial study population were independent, whereas 86% of those with initial depression screening and 87% of those with repeated CES-D scoring were independent at discharge. 119 of the 213 patients with follow-up mRS data were independent.
Multiple linear regression was used for the analysis of predictors of discharge CES-D (Table 2). According to the Shapiro-Wilk test (p = 0.104) and the normal Q-Q plot of the residuals, the model has an acceptablefit. Using the algo- rithm described in the Statistical analysis section, we found that employment, education and income should be included in the model on top of the control variables. Other socio-eco- nomic variables were also considered and tested but were
eventually discarded. The variables in this model also proved to be important in other models of this study.
We found that those who had not been employed before their stroke scored 5.5 higher on average on the CES-D scale than those who had been employed at the time of their stroke (Table 2). Also, compared to those with 8 years or less education, patients in the higher education group scored 1.85.6 less on average on the CES-D scale. Only the effect Fig. 1.Patientflowchart.
4 A. MIROLOVICS ET AL.
of secondary school education and the overall effect of the education variable (p = 0.048) were statistically significant.
Patients with higher-than-the-lowest income also showed milder depression on average but none of these effects were significant at the p<0.05 level.
Only disability at discharge (mRS3) showed some sta- tistically detectable (p<0.1) effect of the non-socio-eco- nomic variables. Patients with disability showed higher
CES-D scores on average. None of the other variables in this model showed a significant effect on discharge depression measured by CES-D.
In summary, at discharge after the acute event, the level of education and prior employment status are the major predictors of the severity of depressive symptoms, whereas current disability has only a marginal effect and income has no significant effect at all on the CES-D scale.
Table 1. Baseline features of the study population
Feature All patients at
baseline (n=233)
Patients with baseline depression evaluation (168/233)
Baseline values of those with follow-up depression evaluation (116/233)
Age(mean±SD) 70.3±13.6 67.9±13.5 67.0±13.6
Male 109/233 85/168 55/116
Female 124/233 83/168 61/116
N available for monthly net income 190/233 168/168 116/116
0-50 thousand HUF 27/190 24/168 16/116
50-100 thousand HUF 74/190 62/168 41/116
100-150 thousand HUF 52/190 46/168 34/116
150-200 thousand HUF 27/190 26/168 17/116
more than 200 thousand HUF 10/190 10/168 8/116
N available for level of education 191/233 168/168 116/116
Elementary school or less 38/191 34/168 21/116
Vocational training 60/191 49/168 33/116
Secondary school graduation 59/191 52/168 37/116
College/university degree 34/191 33/168 25/116
Discharge mRS(median and IQR) 2 (1-5) 1 (1-2) 1 (1-2)
Independent at discharge(mRS2) 157/233 145/168 101/116
Baseline CES-D score(mean±SD) - 16.5±9.8 14.9±9.5
At the time of the study the exchange rate was around 300 HUF for 1 EUR.
mRS: modified Rankin scale score, CES-D: Center for Epidemiologic Studies Depression Scale.
Table 2. Predictors of discharge CES-D
Reference category Variable Coefficient 95% C.I. p-value Overall p-value N
(Intercept) 16.5 8.3 – 24.8 <000.1 168
Male Sex - female 2.4 -0.6 – 5.4 0.117 83
Age 0.010 -0.133 – 0.154 0.888 168
Admission NIHSS -0.34 -0.96 – 0.28 0.281 168
mRS: 0-2 Discharge mRS 3-6 4.6 -0.5 – 9.6 0.078 23
Active Employment - Inactive 5.5 0.4 – 10.6 0.037 140
Elementary school or less Vocational training -1.8 -6.0 – 2.4 0.403 0.048 49
Secondary school grad. -5.6 -9.9 – -1.4 0.011 52
College/university degree -4.9 -10.2 – 0.3 0.066 33
Monthly net income per person 0-50 thousand HUF
50-100 thousand HUF -3.8 -8.4 – 0.9 0.112 0.556 62
100-150 thousand HUF -3.3 -8.2 – 1.7 0.200 46
150-200 thousand HUF -2.3 -8.0 – 3.4 0.427 26
over 200 thousand HUF -4.6 -12.2 – 2.9 0.231 10
Active work status: full or part-time occupation. Inactive work status: unemployed, retired, supported by others. Overall p-values for mul- tilevel factors are displayed on the right side of the “p-value” column.
At the time of the study the exchange rate was around 300 HUF for 1 EUR.
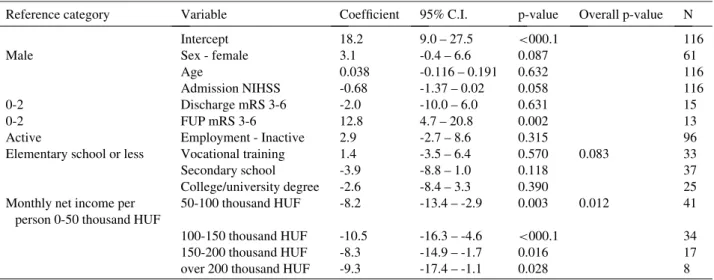
Findings at follow-up
For the follow-up CES-D score we created a linear regression model similar to the one we used at discharge (Table 3). According to the Shapiro-Wilk test (p = 0.452) and the normal Q-Q plot of the residuals, the model has an acceptablefit.
Patients from all income categories had significantly milder follow-up depression on average that those in the lowest category: those who were in any of the higher income categories had between 8.2 and 10.5 lower aver- age scores on the CES-D scale than thefinancially most disadvantaged group (Table 3).
Work status and education lost the significance of the effects that were seen at discharge. It can be noted though, that the overall effect of education was close to signifi- cance with a p = 0.083.
Women tended to have higher CES-D scores on average than men, but this effect failed to reach the level of statisti- cal significance (p = 0.087). Using the p<0.05 critical value only current disability (p = 0.002) and income (overall p = 0.012) showed a significant effect on follow-up depres- sion measured by CES-D. In other words, loss of indepen- dence and poverty are the major predictors of the severity of depressive symptoms at one year after the index acute event.
The effect of change in dependent status between discharge and follow-up
Of those with follow-up CES-D, 15 patients were dependent (mRS3) at discharge, and 4 of them improved to achieve independence by one year. On the other hand, by one year 2 patients who had been independent at
discharge deteriorated to a dependent condition. Dis- charge mRS was not a predictor of depressive symptoms one year later (p = 0.631). However, follow up disability had a significant effect on the follow-up CES-D score (p = 0.002). Those who were dependent at follow-up scored on average 12.8 points higher on the CES-D scale than those who were independent at the 1-year follow-up.
We created new variables which measure the difference between the follow-up and the discharge depression scores. We analyzed these new variables with the previ- ous set of covariates in linear regression models. Results for CES-D difference can be seen inTable 4.
We found that CES-D difference is only influenced sig- nificantly in this model by follow-up disability status (p = 0.008). Compared to patients who were independent (i.e. mRS2) both at discharge and follow-up, those who became dependent (i.e. mRS3) at follow-up had on aver- age a 10.2 higher increase in the CES-D score.
Sensitivity analyses using the results by the BDI to evaluate severity of depressive symptoms
In addition to CES-D, we also evaluated depressive symptoms of the patients by the BDI. The results of these models should be interpreted with caution as all of these showed mild to moderate problems with the model fit according to the Shapiro-Wilk tests (p<0.05) and the nor- mal Q-Q plots.
We found that the level of education (p = 0.014), current disability (p = 0.033) and the second-to-lowest income cat- egory (p = 0.043, compared to the lowest) were predictors of the severity of acute depressive symptoms evaluated by the BDI at discharge (Supplementary Table 1).
Table 3. Predictors of follow-up CES-D
Reference category Variable Coefficient 95% C.I. p-value Overall p-value N
Intercept 18.2 9.0 – 27.5 <000.1 116
Male Sex - female 3.1 -0.4 – 6.6 0.087 61
Age 0.038 -0.116 – 0.191 0.632 116
Admission NIHSS -0.68 -1.37 – 0.02 0.058 116
0-2 Discharge mRS 3-6 -2.0 -10.0 – 6.0 0.631 15
0-2 FUP mRS 3-6 12.8 4.7 – 20.8 0.002 13
Active Employment - Inactive 2.9 -2.7 – 8.6 0.315 96
Elementary school or less Vocational training 1.4 -3.5 – 6.4 0.570 0.083 33
Secondary school -3.9 -8.8 – 1.0 0.118 37
College/university degree -2.6 -8.4 – 3.3 0.390 25
Monthly net income per person 0-50 thousand HUF
50-100 thousand HUF -8.2 -13.4 – -2.9 0.003 0.012 41
100-150 thousand HUF -10.5 -16.3 – -4.6 <000.1 34
150-200 thousand HUF -8.3 -14.9 – -1.7 0.016 17
over 200 thousand HUF -9.3 -17.4 – -1.1 0.028 8
Active work status: full or part-time occupation, Inactive work status: unemployed, retired, supported by others. Overall p-values for mul- tilevel factors are displayed on the right side of the “p-value” column.
At the time of the study the exchange rate was around 300 HUF for 1 EUR.
6 A. MIROLOVICS ET AL.
At follow-up the only significant effect on depression measured by BDI was the loss of independence from dis- charge to follow-up (p = 0.001, Supplementary Table 2).
When analyzing the BDI score difference, we found that compared to patients who were independent (i.e. mRS2) both at discharge and follow-up, those who were inde- pendent at discharge but became dependent (i.e. mRS3) at follow-up had on average a higher increase in the BDI score (p = 0.003, Supplementary Table 3). However, dependency at dischargeper sealso had a significant nega- tive effect on follow-up BDI score (p = 0.044).
Those patients who were dependent at discharge (i.e.
mRS3), but were independent at follow-up (i.e. mRS2) had a greater decrease in their BDI score compared to patients who were independent at both discharge and at follow-up. In other words, decreasing mRS scores between discharge and follow-up entail decreasing BDI scores on average. It is important to note that this analysis focuses on the difference between scores and not the value of the score itself as in previous analyses.
Discussion
Summary of the results
In a prospective study of 233 consecutively admitted patients with acute ischemic cerebrovascular disorders we could evaluate depressive symptoms in 168 patients in the acute phase, whereas repeated examination at 1 year was possible in 116 subjects. In univariate analysis severity of depressive symptoms (as measured by CES-D) was associ- ated with age, level of education, employment status, income, housing condition and disability both at discharge and at fol- low-up. We found similar results when depressive symptoms were evaluated by the Beck Depression Inventory.
In multivariable analysis in the acute phase level of educa- tion and prior employment status are the major predictors of the severity of depressive symptoms. Whereas at one year after the index event the actual level of disability andfinan- cial competence were the significant predictors of the sever- ity of depressive symptoms. One year after the index event, depressive symptoms worsened in those who became dependent after the initial independent condition at dis- charge, whereas those who were initially dependent but improved to be able to care for themselves at 1 year after the index event had decreasing severity of depression.
Predictors of depressive symptom severity in the acute stage/at discharge from hospital
Regarding employment status in our study those who had not been employed before their acute cerebrovascular event scored higher on the CES-D scale compared to those who had been employed. Further, compared to those with no more than 8 years of education, higher education level was associated with less severe depressive symptoms. In a systematic review those with post-stroke depression were found to have fewer years of education than those without post-stroke depression.27Patients with long-term education in general, may develop better self adjustment abilities.28In addition to employment status and level of education, only discharge mRS had a tendency for associ- ation with the severity of depressive symptoms: those with more severe disability at discharge scored higher on the CES-D scale (p = 0.07) in the acute phase.
In the acute phase of stroke, severity of depressive symp- toms were found to relate mostly to age, stroke severity, pre-stroke depression and female gender.2931 In a Hong Kong Chinese study employment status before stroke was associated with depression in acute stroke.32 Broomfield Table 4. Predictors of changes in CES-D
Reference category Variable Coefficient 95% C.I. p-value Overall p-value N
(Intercept) 0.80 -7.61 – 9.21 0.852 116
Male Sex - female -2.1 -5.2 – 1.1 0.209 61
Age 0.057 -0.083 – 0.197 0.425 116
Admission NIHSS -0.15 -0.78 – 0.48 0.641 116
0-2 Discharge mRS 3-6 -6.6 -13.9 – 0.6 0.077 15
0-2 FUP mRS 3-6 10.2 2.9 – 17.5 0.008 13
Active Employment - Inactive -2.0 -7.1 – 3.2 0.458 96
Elementary school or less Vocational training 1.4 -3.1 – 5.9 0.550 0.939 33
Secondary school 0.5 -3.9 – 5.0 0.816 37
College/university degree 1.0 -4.3 – 6.3 0.721 25
Monthly net income
per person 0-50 thousand HUF
50-100 thousand HUF -1.7 -6.4 – 3.1 0.500 0.496 41
100-150 thousand HUF -3.5 -8.8 – 1.8 0.198 34
150-200 thousand HUF -4.9 -10.9 – 1.1 0.110 17
over 200 thousand HUF -4.4 -11.8 – 3.0 0.247 8
Active work status: full or part-time occupation, Inactive work status: unemployed, retired, supported by others. Overall p-values for mul- tilevel factors are displayed on the right side of the “p-value” column.
et al examined those with a diagnosis of stroke and TIA.
They found that those with TIA had similar rates and pre- dictors of mood disorder as those with stroke.33
Predictors of the severity of depression after one year after stroke
When evaluating predictors of severity of depressive symptoms at 1 year after the acute event, we found that those in the lowest income category had significantly higher depression score than those in higher income cate- gories. Compared to the results at discharge, employment status and education lost their effect on CES-D by one year after the index event.
In the year after an acute cerebrovascular event, the level of disability was generally found to be a strong predictor of the severity of depressive symptoms with corresponding results in Asian, European and American populations.3438 Similarly to the conclusions of a review by Robinson and Spaletta39we also found that functional impairment was a consistent predictor of the severity of post stroke depressive symptoms at one-year after the index event.
A metaanalysis in stroke patients reported that educa- tion level, income, and age showed significant effects on depressive symptoms.40Assessing depressive symptoms after stroke should consider the interaction of gender, eco- nomic status, education level, history of depression and the presence/absence of a spouse.41
In a Polish study42predictors for the presence of symp- toms suggestive of depression at 3 months after stroke were low level of socioeconomic situation, education, low income, greater severity of stroke, and worse functional status. Socio- economic deprivation was found to be a predictor of post stroke depression in a study in Ghana,43and a systematic review had similar conclusion in the sub-Saharan region:
PSD was significantly associated with low education, cogni- tive impairment, physical disability, poor quality of life, and divorced marital status.44The Rotterdam study found that symptomatic cerebrovascular disease increases the vulnera- bility to late-life depression and the risk of depression after TIA is similar to that after stroke.45
Predictors of improving or worsening of depression in the first year after stroke
We found that CES-D difference between discharge and follow-up at 1 year was only influenced significantly in our model by the level of dependency tested in a binary manner:
patients with mRS2 were considered to be able to live independently, whereas those with mRS3 needed help from others in everyday activities. We found that those who turned dependent from an independent condition at dis- charge presented more severe depressive symptoms at one year, and vice versa, those who improved from the depen- dent condition at discharge to be able to live an independent life one year later, had less severe depressive symptoms at follow-up compared to discharge.
The effect of functional improvement on the change of depressive symptoms remains controversial: whereas better functional recovery was associated with improved mood in a study by Torrisi et al,46 results were inconclusive as to whether improvement of depression was independently associated with functional recovery at 12 weeks.47
When assessing the factors influencing the difference between the follow-up and discharge CES-D score with multiple linear regression, we found that only the depen- dent state of the patient (measured by mRS) had a signifi- cant effect. Namely, patients who transitioned from independent to dependent state (i.e. from discharge mRS2 to follow-up mRS3) showed significantly more increase in their depressive symptoms (i.e. CES-D score) between dis- charge and follow-up than those patients who were inde- pendent in the whole study period. We also found that improvement from discharge mRS3 to follow-up mRS2 significantly lowered the CES-D score between discharge and follow up compared to those patients who were inde- pendent in the whole study period (i.e. both discharge and follow-up mRS2). It is important to note that as both the discharge and follow-up depression data were required for this analysis, only survivors (i.e. both discharge and follow- up mRS<6) were included in this model.
The strengths of our study are the repeated evaluation of patients in the acute stage and one year later, the use of two tools (the CES-D and the BDI) to evaluate severity of depres- sive symptoms, and the detailed evaluation of socioeco- nomic features of individual patients. Our study has several limitations. As a single center study the number of patients is relatively small. Admitting patients ineligible for reperfu- sion therapy in acute stroke may result in some selection bias, as in another study we found that those who had reperfusion therapy were more satisfied after stroke than those without thrombolysis [Szocs et al, Budapest, unpub- lished data, August 2020]. We had limited data on comor- bidity, therefore the Charlson comorbidity index could not be calculated. Although some studies indicated that depres- sion in the acute phase of stroke is related to pre-stroke depression, the history of pre-stroke depression was not obtained systematically in all patients in our study. As no accurate information was available on lifetime prevalence of depression in our patients, the effect of pre-stroke depres- sion could not be evaluated. Further, the evaluation of socio- economic factors was based on the report of the patients and caregivers, and was not confirmed by independent sources. Finally, restricting the analysis of outcome to those with follow-up CES-D evaluation may have resulted in some selection bias.
Based on multivariate testing we conclude that different socioeconomic factors predict severity of depressive symptoms in the acute phase and at one year after the event. Immediately after the acute cerebrovascular event level of education and employment status, whereas one year later income and the level of disability predict the severity of depressive symptoms. Finally, the change in
8 A. MIROLOVICS ET AL.
dependence status between the acute stage and the fol- low-up predicted changes in the severity of depressive symptoms in both directions: patients independent at dis- charge but dependent 1 year later had increasing severity of depressive symptoms, whereas an improvement in depressive symptoms could be observed in those who became independent at one year after a dependent condi- tion in the acute phase.
Data availability
The datasets generated for this study are available on request to the corresponding author.
Author contributions
DB designed and supervised the study. AM performed patient examination and data collection. BD performed statistical analysis of the data. AM and BD drafted the manuscript. JZ and MB edited the manuscript for impor- tant intellectual and clinical content. All authors read and approved thefinal version of the manuscript.
Declaration of Competing Interest None declared.
Supplementary materials
Supplementary material associated with this article can be found in the online version at doi:10.1016/j.jstrokecerebro vasdis.2020.105241.
References
1. Hackett ML, Yapa C, Parag V, et al. Frequency of depres- sion after stroke: a systematic review of observational studies. Stroke 2005;36(6):1330-1340.
2. Ayerbe L, Ayis S, Wolfe CD, et al. Natural history, pre- dictors and outcomes of depression after stroke: system- atic review and meta-analysis. Br J Psychiatry 2013;202 (1):14-21.
3. Towfighi A, Ovbiagele B, El Husseini N, et al. Poststroke depression: a scientific statement for healthcare professio- nals from the American Heart Association/American Stroke Association. Stroke 2017;48(2):e30-e43.
4. Carnes-Vendrell A, Deus J, Molina-Seguin J, et al. Depres- sion and apathy after transient ischemic attack or minor stroke: prevalence, evolution and predictors. Sci Rep 2019;9(1):16248.
5. Berg A, Palomaki H, Lehtihalmes M, et al. Poststroke depression: an 18-month follow-up. Stroke 2003;34:138- 143.
6. Bartoli F, Di Brita C, Crocamo C, et al. Early post-stroke depression and mortality: meta-analysis and meta-regres- sion. Front Psychiatry 2018;9:530.
7. Yuan H, Zhang N, Wang C, et al. Factors of Hamilton Depression Rating Scale (17 items) at 2 weeks correlated with poor outcome at 1 year in patients with ischemic stroke. Neurol Sci 2014;35(2):171-177.
8. Paolucci S, Iosa M, Coiro P, et al. Post-stroke depression increases disability more than 15% in ischemic stroke sur-
vivors: a case-control study. Front Neurol 2019;10:926.
9.Naess H, Lunde L, Brogger J, et al. Depression predicts unfavourable functional outcome and higher mortality in stroke patients: the Bergen Stroke Study. Acta Neurol Scand Suppl 2010;190:34-38.
10. Ayerbe L, Ayis S, Crichton S, et al. The long-term out- comes of depression up to 10 years after stroke; the South London stroke register. J Neurol Neurosurg Psychiatry 2014;85(5):514-521.
11. Sen A, Bisquera A, Wang Y, et al. Factors, trends, and long-term outcomes for stroke patients returning to work: the South London stroke register. Int J Stroke 2019;14(7):696-705.
12. Ladwig S, Zhou Z, Xu Y, et al. Comparison of treatment rates of depression after stroke versus myocardial infarc- tion: a systematic review and meta-analysis of observa- tional data. Psychosom Med 2018;80(8):754-763.
13. Hackett ML, Anderson CS. Predictors of depression after stroke: a systematic review of observational studies.
Stroke 2005;36(10):2296-2301.
14. Kellermann M, Berecz R, Bereczki D. Does the severity of depressive symptoms after stroke affect long-term sur- vival? An 18-year follow-up. PLoS One 2018;13(12):
e0209157.
15. Naess H, Nyland HI, Thomassen L, et al. Mild depression in young adults with cerebral infarction at long-term fol- low-up: a population-based study. Eur J Neurol 2005;12:194-198.
16. Astr€om M, Adolfsson R, Asplund K. Major depression in stroke patients: a 3-year longitudinal study. Stroke 1993;24:976-982.
17. Andersen G, Vestergaard K, Ingemann-Nielsen M, et al.
Risk factors for post-stroke depression. Acta Psychiatr Scand 1995;92:193-198.
18. Szocs I, Bereczki D, Ajtay A, et al. Socioeconomic gap between neighborhoods of Budapest: striking impact on stroke and possible explanations. PLoS One 2019;14(2):
e0212519.
19. Brott T, Jr Adams HP, Olinger CP, et al. Measurements of acute cerebral infarction: a clinical examination scale.
Stroke 1989;20:864-870.
20. Lip GY, Nieuwlaat R, Pisters R, et al. Refining clinical risk stratification for predicting stroke and thromboembolism in atrial fibrillation using a novel risk factor-based approach: the Euro Heart Survey on atrial fibrillation.
Chest 2010;137:263-272.
21. Pisters R, Lane DA, Nieuwlaat R, et al. A novel user- friendly score (HAS-BLED) to assess 1-year risk of major bleeding in patients with atrialfibrillation: the Euro Heart Survey. Chest 2010;138:1093-1100.
22. Evans DC, Gerlach AT, Christy JM, et al. Pre-injury poly- pharmacy as a predictor of outcomes in trauma patients.
Int J Crit Illn Inj Sci 2011;1:104-109.
23. Jr Adams HP, BH Bendixen, Kappelle LJ, et al. 3rd.
classification of subtype of acute ischemic stroke. Defi- nitions for use in a multicentre clinical trial. TOAST.
Trial of Org 10172 in acute stroke treatment. Stroke 1993;24:35-41.
24. Radloff. A self report depression scale for research in the gen- eral population. Appl Psychol Measure 1 1977;1:385-401.
25. Beck AT, Beck RW. Shortened version of BDI. Postgradu- ate Med 1972;52:81-85.
26. Meader N, Moe-Byrne T, Llewellyn A, et al. Screening for poststroke major depression: a meta-analysis of diagnos- tic validity studies. J Neurol Neurosurg Psychiatry 2014;85(2):198-206.
27. Backhouse EV, McHutchison CA, Cvoro V, et al. Cogni- tive ability, education and socioeconomic status in child- hood and risk of post-stroke depression in later life: a systematic review and meta-analysis. PLoS One 2018;13 (7):e0200525.
28. Ellen W, Stephan V-L. Educational research and innova- tion art for art’s sake? The impact of arts education. The Impact of Arts Education. Paris: OECD Publishing; 2013.
29. Kellermann M, Fekete I, Gesztelyi R, et al. Screening for depressive symptoms in the acute phase of stroke. Gen Hosp Psychiatry 1999;21(2):116-121.
30. Berg A, Palom€aki H, Lehtihalmes M, et al. Poststroke depression in acute phase after stroke. Cerebrovasc Dis 2001;12(1):14-20.
31. Paolucci S, Gandolfo C, Provinciali L, et al. The Italian multicenter observational study on post-stroke depres- sion (DESTRO). J Neurol 2006;253(5):556-562.
32. Sit JW, Wong TK, Clinton M, et al. Associated factors of post-stroke depression among Hong Kong Chinese: a longi- tudinal study. Psychol Health Med 2007;12(2):117-125.
33. Broomfield NM, Quinn TJ, Abdul-Rahim AH, et al.
Depression and anxiety symptoms post-stroke/TIA:
prevalence and associations in cross-sectional data from a regional stroke registry. BMC Neurol 2014;14:198.
34. Burvill P, Johnson G, Jamrozik K, et al. Risk factors for post- stroke depression. Int J Geriatr Psychiatry 1997;12:219-226.
35. Carota A, Berney A, Aybek S, et al. A prospective study of predictors of poststroke depression. Neurology 2005;64(3):428-433.
36. De Ryck A, Fransen E, Brouns R, et al. Psychosocial prob- lems associated with depression at 18 months poststroke.
Int J Geriatr Psychiatry 2014;29:144-152.
37. Tsai CS, Wu CL, Hung TH, et al. Incidence and risk fac- tors of poststroke depression in patients with acute
ischemic stroke: a 1-year prospective study in Taiwan.
Biomed J 2016;39(3):195-200.
38. Fournier LE, Beauchamp JES, Zhang X, et al. Assessment of the progression of poststroke depression in ischemic stroke patients using the patient health questionnaire-9. J Stroke Cerebrovasc Dis 2020;29(4):104561.
39. Robinson RG, Spaletta G. Poststroke depression: a review. Can J Psychiatry 2010;55:341-349.
40. Park EY, Shin IS, Kim JH. A meta-analysis of the varia- bles related to depression in Korean patients with a stroke. J Korean Acad Nurs 2012;42(4):537-548.
41. Park EY, Kim JH. An analysis of depressive symptoms in stroke survivors: verification of a moderating effect of demographic characteristics. BMC Psychiatry 2017;17 (1):132.
42. Sienkiewicz-Jarosz H, Milewska D, Bochynska A, et al.
Predictors of depressive symptoms in patients with stroke - a three-month follow-up. Neurol Neurochir Pol 2010;44(1):13-20.
43. Sarfo FS, Jenkins C, Singh A, et al. Post-stroke depression in Ghana: characteristics and correlates. J Neurol Sci 2017;379:261-265.
44. Ojagbemi A, Akpa O, Elugbadebo F, et al. Depression after stroke in Sub-Saharan Africa: A systematic review and meta-analysis. Behav Neurol 2017:4160259.
45. Luijendijk HJ, Stricker BH, Wieberdink RG, et al. Tran- sient ischemic attack and incident depression. Stroke 2011;42(7):1857-1861.
46. Torrisi M, De Cola MC, Buda A, et al. Self-efficacy, post- stroke depression, and rehabilitation outcomes: is there a correlation? J Stroke Cerebrovasc Dis 2018;27:3208-3211.
47. Schmid AA, Kroenke K, Hendrie HC, et al. Poststroke depression and treatment effects on functional outcomes.
Neurology 2011;76:1000-1005.
10 A. MIROLOVICS ET AL.