The Jour nal of P hysiology
Dynamics of sleep oscillations is coupled to brain temperature on multiple scales
M´arton Csernai1, S´andor Borb´ely1,2, Kinga Kocsis1,3,4 , D´avid Burka1,9, Zolt´an Fekete5,6 , Veronika Balogh1, Szabolcs K´ali7, Zsuzsa Emri8and P´eter Barth ´o1
1Institute of Cognitive Neuroscience and Psychology, Research Centre for Natural Sciences, Hungarian Academy of Sciences, Budapest, Hungary
2Department of Physiology and Neurobiology, E¨otv¨os Lor´and University, Budapest, Hungary
3Roska Tam´as Doctoral School of Sciences and Technology, Faculty of Information Technology and Bionics, P´azm´any P´eter Catholic University, Budapest, Hungary
4Neuronal Network and Behavior Research Group, RCNS, Hungarian Academy of Sciences, Budapest, Hungary
5Research Group for Implantable Microsystems, Faculty of Information Technology and Bionics, P´azm´any P´eter Catholic University, Budapest, Hungary
6Institute of Technical Physics and Material Science, Centre for Energy Research, Hungarian Academy of Sciences, Budapest, Hungary
7Institute of Experimental Medicine, Hungarian Academy of Sciences, Budapest, Hungary
8Eszterh´azy K´aroly University, Eger, Hungary
9Corvinus University of Budapest, Budapest, Hungary,
Edited by: Ole Paulsen & Diego Contreras
Key points
r
Sleep spindle frequency positively, duration negatively correlates with brain temperature.r
Local heating of the thalamus produces similar effects in the heated area.r
Thalamic network model corroborates temperature dependence of sleep spindle frequency.r
Brain temperature shows spontaneous microfluctuations during both anesthesia and natural sleep.r
Larger fluctuations are associated with epochs of REM sleep.r
Smaller fluctuations correspond to the alteration of spindling and delta epochs of infra-slow oscillation.Abstract Every form of neural activity depends on temperature, yet its relationship to brain rhythms is poorly understood. In this work we examined how sleep spindles are influenced by changing brain temperatures and how brain temperature is influenced by sleep oscillations.
We employed a novel thermoelectrode designed for measuring temperature while recording neural activity. We found that spindle frequency is positively correlated and duration negatively correlated with brain temperature. Local heating of the thalamus replicated the temperature dependence of spindle parameters in the heated area only, suggesting biophysical rather than global modulatory mechanisms, a finding also supported by a thalamic network model. Finally,
Marton Csernaiis a postdoctoral researcher with a background in electrical engineering and computer science. His primary research focuses on the network effects of sleep processes, especially how cell ensembles behave during sleep spindles.
M. Csernai, S. Borb´ely and K. Kocsis contributed equally to this work.
C2019 The Authors.The Journal of Physiologypublished by John Wiley & Sons Ltd on behalf of The Physiological Society DOI: 10.1113/JP277664
we show that switches between oscillatory states also influence brain temperature on a shorter and smaller scale. Epochs of paradoxical sleep as well as the infra-slow oscillation were associated with brain temperature fluctuations below 0.2°C. Our results highlight that brain temperature is massively intertwined with sleep oscillations on various time scales.
(Received 11 January 2019; accepted after revision 11 June 2019; first published online 13 June 2019)
Corresponding authorP. Barth ´o: Institute of Cognitive Neuroscience and Psychology, Research Centre for Natural Sciences, Hungarian Academy of Sciences, Budapest, Hungary, 1117 Magyar Tud ´osok Krt. 2.
Email bartho.peter@ttk.mta.hu
Introduction
Sleep is essential for our everyday functioning, as well as for memory consolidation. Several factors influence sleep, temperature being amongst the most important.
Sleep quality and propensity are highly dependent on thermal conditions; sleep regulation is tightly coupled to thermoregulation. On the other hand, there are multiple sleep-related changes in body and brain temperature independent of the circadian rhythm.
Studies in mammalian species have shown that there are multiple changes in body and brain temperature during a single sleep session. Non-rapid eye movement (non-REM) sleep is associated with decreased brain and body temperature, while during REM sleep, despite the reduced somatic thermal regulation, brain temperature increases (Kawamura & Sawyer, 1965; Baker & Hayward, 1967; Satoh, 1968; Kovalzon, 1973; Alf¨oldi et al. 1990;
Lyaminet al.2018).
Besides these short-term changes, core body temperature can vary across individuals (Sund-Levander et al.2002) with changes in ambient temperature (Alf¨oldi et al.1990), in pathological conditions such as hypo- or hyperthyroidism (Freglyet al.1961), during the oestrus cycle (Driver et al. 1996), or as a result of medical or recreational drug use (Kiyatkin, 2010). Furthermore, though brain temperature is widely recognized as a strictly regulated homeostatic parameter, it can change as much as 3°C across different arousal states and during sensory stimulation as shown across many avian and mammalian species (Delgado & Hanai, 1966; McElligott & Melzack, 1967; Kovalzon, 1973; Kiyatkinet al.2002; Mitchellet al.
2006; Tr¨ubel et al. 2006), as well as in clinical human studies (Mellerg˚ard, 1995; Rossi, 2001).
The tight relationship between core body temperature and sleep stages was also verified by directly manipulating one or other of them. Changes in body temperature have the potential to entrain brain state fluctuations (Whittenet al.2009); also baseline temperature influences particular brain oscillations. A brain temperature change of 1°C is sufficient to shift EEG frequencies above 10 Hz by 1 Hz (Deboer & Tobler, 1995). Lowering body temperature results in a decreasing EEG amplitude (Massopust et al. 1965; Michenfelder & Milde, 1991) and a shift towards lower frequencies (Deboer & Tobler,
1995). Direct cooling of the neocortex can switch slow-wave to desynchronized activity patterns (Sheroziya
& Timofeev, 2015). Temperature-dependent changes in brain oscillations which reflect the activity of synchronized neural populations, point towards deeper consequences in network function.
Amongst thalamocortical oscillations, sleep spindles (7–15 Hz, 1–3 s) have been the subject of many studies on sleep quality, memory encoding and mental health.
These transient oscillations play a critical role in learning (Fogel et al. 2007; Morin et al. 2008) and mark sleep fragility (Lecciet al.2017); at the same time they are very susceptible to thermal changes of the mammalian body.
Thus, it is essential to study how spindle dynamics are affected by body and brain temperature variations. It has been shown that the frequency of sleep spindle oscillations co-varies with physiological body temperature changes recurring across the menstrual cycle. Spindle activity also shows a circadian modulation with a peak density at habitual sleep onset, time locked to the maximal decrease in core temperature (Dijk & Czeisler, 1995).
Given the large natural variability in brain temperature across individuals and conditions, it is extremely important to shed light on its relationship with neural oscillations. Medications and external thermal conditions both alter brain temperature and should therefore be considered as a factor in medical procedures. On the other hand, brain temperature should be taken into consideration when conductingin vivoneurophysiological experiments, as well as for in silico network models, in order to mimic natural state changes.
In this study we seek to elucidate the biophysical and network mechanisms underlying the relationship between sleep oscillations and brain temperature. We investigate the changes in these oscillations, especially sleep spindles, while manipulating core as well as brain temperature, and finally we show how oscillations relate to brain temperature without external manipulation.
Methods
Ethical considerations
Experiments were carried out in accordance with the Hungarian Act of Animal Care and Experimentation
(1998, XXVIII) and with the directive 2010/63/EU of the European Parliament and of the Council of 22 September 2010 on the protection of animals used for scientific purposes. The experimental protocol was approved by the regional ethical committee (licence number PEI/001/
2290-11/2015 for ourin vivoexperiments). Efforts were made to minimize the number of animals used.
Mice were kept under a 12 h:12 h light–dark cycle (lights on at 07:00 h) in a temperature-controlled room at 22± 2°C. Standard food pellets and tap water were availablead libitum.
Electrophysiological and temperature recordings Acute experiments. Our experiments were performed on 13 male C57BL/6 mice (Toxicoop, Budapest, Hungary) weighing between 18 and 30 g at the time of the surgery.
For general surgical procedures see Barth ´oet al.(2004).
Briefly, the animals were anaesthetized with urethane (1.2 g kg−1;I.P.), then placed in a stereotaxic instrument (RWD Life Science, Shenzhen, China). Small (<0.5 mm) craniotomies were made over the target brain areas, and electrodes were lowered into the brain at a speed below 0.2 mm s−1. After electrode insertion, we waited 30 min before recording.
To record local field potential (LFP) activity, Neuro- Nexus (Ann Arbor, MI, USA) silicon probes were inserted into the brain. Linear 16-channel silicon probes were inserted into the left primary somatosensory cortex (Br.
AP 0.0, L +3.5, in 18° at 1600 µm depth), and in the left ventral posteromedial nucleus (VPM) of thalamus (Br. AP−1.6, L +2.3, in 18° at 3700 µm depth). Our custom-designed thermoelectrode, featuring four electro- physiological recording sites and a platinum temperature sensor, was inserted also into the left VPM (Br. AP−1.6, L+1.6, in 0°at 3600 µm depth). In some experiments the linear 16-channel probe was inserted into the right primary somatosensory cortex (Br. AP 0.0, L−3.5, in 18° at 1600µm depth) or to the right VPM (Br. AP −1.6, L−2.3, in 18°at 3700µm depth). In this case there was no recording from the left cortical area. An additional screw electrode implanted over the cerebellum served as a reference. Co-ordinates are based on the stereotaxic atlas of Paxinos & Watson (1986). Using a unipolar V1ECG lead, heart rate and electrocardiogram were simultaneously recorded with LFP. Rectal temperature was measured by a TH-5 Thermalert Monitoring Thermometer (Physitemp, Clifton, NJ, USA).
Recordings were made with Intan RHD2132 16-channel amplifiers, connected to an RHD-2000 Evaluation Board (Intan Technologies, Los Angeles, CA, USA). Brain temperature was measured by calibrating and measuring the resistance of the platinum filament in the thermo- electrode (see details in Feketeet al.2017) by a Keithley 6221 precision current generator and a Keithley 2000MM
multimeter (Keithley Instruments Inc., Solon, OH, USA).
Rectal temperature signals were simultaneously recorded by using the analog inputs of the Intan RHD-2000 system.
All signals were sampled at 20 kHz, except for brain tempe- rature which was sampled at 5 Hz and synchronized to the other signals through the analog input of the Intan system.
Chronic experiments. These experiments were carried out on five male C57BL/6 mice (Toxicoop, Budapest, Hungary) weighing between 27 and 35 g at the time of the surgery. For initial surgery, animals were anaesthetized with ketamine/xylazine (ketamine: 100 mg kg−1; xylazine:
4 mg kg−1;I.P.), then placed in a stereotaxic instrument (RWD Life Science). During surgery, the depth of anaesthesia was regularly assessed by the limb-withdrawal or corneal reflex, and an additional dose of anaesthetic was administered, if necessary.
To record LFP and multiunit activity (MUA), bundles of 25 and 50µm tungsten stereotrodes (California Fine Wire, Grover Beach, CA, USA) were used. Electrodes were placed in the left and right S1 (Br. AP 0.0, L±3.5, at 1000 µm depth), the ventral posteromedial thalamus (VPM) (Br.
AP−1.6, L+2.5, in 18°at 3700µm depth), as well as in the hippocampus (Br. AP−1.6, L−1.5, in 0°at 2200µm depth). To record temperature, a 0.3 mm diameter Semi- tec thermistor (223Fµ3122-07U015; Mouser Electronics, Mansfield, TX, USA) was also inserted to left VPM (Br. AP
−1.6, L+1.5, in 0°at 3600µm depth). An EMG electrode was placed in the neck musculature. Co-ordinates are based on the stereotaxic atlas of Paxinos and Watson (1986). Electrodes were connected to a Neuralynx EIB-16 electrode interface board (Neuralynx, Dublin, Ireland).
Core body temperature was measured intraperitoneally by Semitec thermistors (223Fµ3122-07U015, Mouser Electronics).
During the recovery period (10 days), animals were given analgesic medication in their drinking water (ibuprofen) and monitored daily for signs of pain or inflammation. After recovery, signals were recorded continuously for 6–8 h per day during wakefulness and natural sleep with the same system as acute experiments.
The behaviour of animals was also recorded using a commercially available CCD camera.
Accuracy of brain temperature recording
In the thermoprobe recordings, the accuracy of absolute temperature was below 0.14°C (Fekete et al. 2017).
The sensitivity of the device to relative changes in temperature, which is required to measure micro- fluctuations, however, is magnitudes higher. At 33°C the resistance and temperature coefficient of the integrated platinum temperature filament isR0=335.81±18.22 and α = 1721 ± 99 p.p.m. K−1. This means that an approximately 0.002change in resistance corresponds
to a temperature change of 0.01°C. The resolution of the Keithley 2000MM unit is 0.001in a range of 1 k. Based on these data, it is accurate enough to evalute variations in temperature as small as 0.01°C. In the case of the Semi- tec thermistor, there is a non-linear relationship between resistance and temperature governed by the so-called thermistor equation. The B value of the thermistor is 3454 and its rated zero-power resistance is 14,015 at 37°C. If the temperature changes from e.g. 37 to 38°C, it corresponds to a decrease in resistance by approximately 500. To simplify this case, considering the relationship to be linear in this range, a 0.01 K change induces a 5 decrease, which can be accurately and easily measured by the setup.
Histology
Following the recordings, under deep anaesthesia mice were transcardially perfused with 0.9% saline, followed by fixative containing 4% paraformaldehyde and 0.1 M phosphate buffer (PB). After perfusion brains were sliced to 50µm-thick coronal sections with a vibratome. Before each acute experiment, silicon probes were dipped in DiI solution for verification of recording sites. After further PB washes, sections were mounted temporarily in PB and imaged using epifluorescent microscopy (Leica).
The electrode tracks of the thermo probes were reconstructed from counterstained glial fibrillary acidic protein (GFAP). GFAP staining were used to visualize the lesion made by the thermo probes and to check whether heating caused necrosis in the adjacent tissue.
After imaging silicon probe tracks, the same sections were subjected to immunofluorescence staining according to the following protocol. After further PB washes, sections were freeze-thawed above liquid N2 in 0.1 M PB containing 30% sucrose. Endogenous peroxidase activity was blocked with 1% H2O2, then non-specific staining was suppressed with 2% normal horse serum (Vector Laboratories, Burlingame, CA, USA) in 0.1 M PB.
Monoclonal mouse antibodies were used against GFAP (1:2000, EMD Millipore, Merck, Darmstadt, Germany, clone GA5) for 24 h at 4°C. Immunopositive elements were visualized using biotinylated anti-mouse immuno- globulin G (1:250, Vector Laboratories) as a secondary antiserum followed by avidin-biotinylated horseradish peroxidase complex (ABC; 1:250, Vector Laboratories).
The immunoperoxidase reaction was developed using 3,3-diaminobenzidine tetrahydrochloride (DAB; Sigma, St Louis, MO, USA) dissolved in Tris buffer (pH 7.6) as a chromogen. After washing in Tris buffer and PB, sections were mounted, dehydrated for light microscopy (2×10 min in xylene) and coverslipped with DePex (Serva Electrophoresis GmbH, Heidelberg, Germany). We found no necrosis in any of the animals.
Local heating of brain tissue
The platinum filament in the thermoelectrode can be used to heat up neighbouring brain tissue by increasing the current in the four-wire resistance measurement setup.
The technical and histological details are described in Fekete et al. (2017). Briefly, we employed 2 min of measurement current (1 mA) and 2 min of heating current (4–8 mA) in a cyclic pattern. An exponential was fitted on the measured temperature values from 400 ms after the offset of the heating current in each cycle and temperature during heating was estimated by the intersection of the exponential and the offset time of the heating pulse.
Distance dependence of heating was calculated by locally heating the brain tissue with the thermoprobe at 4, 6 and 8 mA currents for 50 s, while measuring the elicited temperature change with a Semitec thermistor inserted at 0.5, 1 and 3 mm distances, consecutively.
Only the temperature value by the end of the heating was considered.
Data analysis
Electrophysiology. Raw LFP channels were band pass filtered between 0.4 and 7 kHz, and multiunits were detected with an absolute threshold. The units were combined from multiple channels, downsampled to 1 kHz and smoothed with a 10 ms moving average filter.
Sigma power was determined by filtering the preprocessed multiunit activity (MUA) between 6 and 18 Hz. In the case of the analysis of infra-slow oscillations we used sigma power from the best recording sites. Theta power was calculated by first downsampling hippocampal LFP to 1 kHz, and then taking the ratio of the theta (6–10 Hz) and delta (0.5–4 Hz) bands. Heart rate was smoothed with a 10 s moving average window. Sigma band, MUA and EMG activity were normalized to their means.
Temperature. In general, all temperature data were down- sampled to 1 kHz and smoothed with a 100 ms window, except for brain temperature in the acute experiments, in which case we simply used the recorded samples that were synchronized to the other signals. In the case of the analysis of infra-slow oscillations, all respective signals were smoothed with a 10 s window and then down- sampled to 10 Hz, while brain temperatures of the acute experiments were interpolated to 10 Hz. Large fluctuations were marked manually based on visual features of joint brain temperature and theta power increase motifs.
Small fluctuation epochs were selected between the large elevations. Small fluctuation cycle peaks and troughs were detected automatically by the findpeaks MATLAB function (MATLAB software, MathWorks, Natick, MA, USA), and we manually validated these detected peaks in each epoch.
Spindle detection and frequency calculation. Spindles were detected semi-automatically from the multiunit activity. MUA was downsampled to 1 kHz, represented as a vector of 1 s and 0 s, smoothed with an 11 s long rectangular filter, and further filtered between 8 and 20 Hz. Automatic detection threshold was set to 1 SD, with a minimum length of 300 ms. Since simple thresholding sometimes spuriously detects desynchronized activity, these events were manually removed. Also, since our analysis is sensitive to missed cycles, spindles with a break in rhythmicity (gap>150 ms) were omitted. Frequency of the spindle was calculated from the average of the time difference between automatically detected cycle peaks (Fig. 1B). The temperature of the spindle is defined as the temperature at the start of the respective spindle. Spindle prevalences were calculated in 2 min bins.
Sleep scoring. Wake epochs were defined by the normalized EMG activity exceeding a set threshold
for 16 s, while between 0.5 and 16 s duration
they were considered microarousals. Desynchronized multiunit activity was often contaminated by muscle artifacts and therefore was not included as a criterion.
REM epochs were detected by the threshold (2–2.5, depending on the quality of hippocampal LFP) crossing of hippocampal theta/delta ratio, as well as EMG activity below the threshold. We did not observe complete muscle atonia during REM, thus the onsets of REM epochs were marked solely by the theta/delta threshold crossing.
Model
For the purpose of this study we adapted the network model of thalamocortical (TC) and thalamic reticular (nRT) cells, constructed by Destexhe et al. (1994, 1996) in the NEURON modelling environment. Single compartment TC and nRT cell membrane potential was governed by the following equations:
CmV˙TC= −gL(VTC−EL)−IKL−IT−Ih−INa−IK
−IGABAA (1)
CmV˙nRT = −gL(VnRT−EL)−IT2−ICAN−IAHP
−INa−IK−IAMPA (2) whereVTCandVnRTare the membrane potentials of TC and nRT cells respectively, the dots on the left-hand-side denote time derivatives, while Cm= 1 µF cm−2 is the specific capacitance of the membrane. The first term on the right-hand-side of each equation is the leak current, in which gL is the leak conductance and EL is the reversal potential of the leakage. In the case of the TC cells the leak potassium current (IKL) is implemented
separately from the other leakage. IT and IT2 are low threshold calcium currents, where the second is a slower version used in the nRT cells.Ihis the hyperpolarization activated cation current of the TC cells. The nRT cells also include a calcium activated non-selective cation current (ICAN) and a slow calcium dependent potassium current (IAHP) (Destexheet al.1994).INaandIKare sodium and potassium currents that generate action potentials based on the Hodgkin–Huxley model.IGABAA is the current of the GABAA receptors that appear in the synapses from nRT to TC cells, andIAMPA is the current of the AMPA receptors in the TC to nRT synapses.
TC cells activated nRT cells via AMPA receptors while nRT cells inhibited TC cells via GABAA receptors. We disregarded GABAB receptors since their blockade hardly altered spindle oscillations experimentally (Krosigket al.
1993; Balet al.1995).
Temperature dependence of the model
Non-synaptic (voltage-gated and calcium-dependent) currents of the original Destexhe models, which were described by a Hodgkin–Huxley-type formalism, already had built-in temperature dependencies. Specifically, the transition rates for channel gating variables were modified by the following multiplier:
ϕx =Q10
T−Texp
10◦C (3)
where T is the actual temperature and Texp is the experimental temperature at which the transition rates and the temperature coefficients (Q10) were measured.
Synaptic currents were based on the models constructed by Destexheet al.(1996), supplemented with temperature dependency. All synaptic currents in the model can be described by the following equations:
Isyn=g¯synr
V−Esyn
(4)
dr
dt = α[C] (1−r)−βr (5) where ‘syn’ can be either for AMPA or GABAA, andIsynis the synaptic current, ¯gsynis the maximal conductance and Esynis the reversal potential. The fraction of open channels is denoted by r and [C] is the concentration of neuro- transmitters in the synaptic cleft, whileαandβ are the forward and backward binding rates of neurotransmitters for the given receptor type. We also define the following variables:
τr = 1
αCmax+β (6)
r∞ = αCmax
αCmax+β (7)
where τr is the time constant of channel binding, r∞ is the steady-state fraction of open channels and ϕh is the temperature dependent multiplier that was added to the original model.Cmax is the maximum concentration of transmitters. Temperature dependence was added to
this model by modifying all binding rates with the temperature multiplier ϕh, which was also calculated according to eqn (3) above. The temperature coefficients (Q10) of AMPA and GABAA receptors were estimated based on the work of Postlethwaite et al. (Postlethwaite
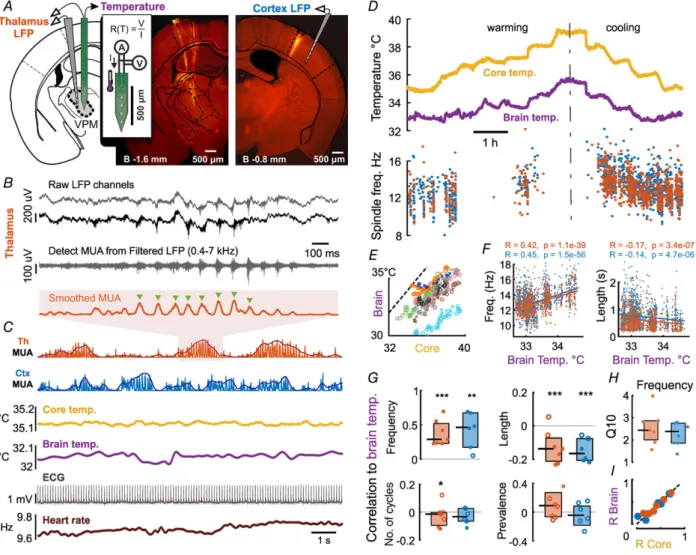
Figure 1. Sleep spindle frequency and length correlates with brain temperature
A, recording of LFP, MUA and temperature from VPM thalamus with linear 16-channel probe (left DiI track) and our custom-designed thermoelectrode. Temperature was measured by four-wire resistance measurement of the platinum filament in the thermoelectrode calibrated to 1 mA current (inset). Right, control LFP recordings with linear 16-channel probe from contralateral primary somatosensory cortex (shown) or VPM.B, raw LFP channels (grey and black traces) were band pass filtered (dark grey trace), then detected units were combined from multiple channels and smoothed with a moving average filter (smoothed MUA). The frequency of the spindle is calculated from the time between peaks (green triangles) and averaged across cycles.C, sample recording chunk showing from top to bottom: thalamic raw and smoothed MUA (shaded area enlarged inB), cortical raw and smoothed MUA, core and brain temperature, electrocardiogram (ECG) and heart rate calculated from ECG.D, example of core body and brain temperature under warming and cooling protocols. Spindle frequency is modulated by both core and brain temperature both in the thalamus and cortex.E, both under warming and cooling protocols the core body temperature correlates with brain temperature across multiple animals (n=8,R=0.91,P<10−10).
F, both thalamic and cortical spindle frequency (left) correlates with brain temperature in the example experiment shown inD. Length of the spindles has an inverse correlation with brain temperature (right).G, pooled correlation coefficients show that temperature dependence of spindle frequency is a significant effect across animals (ttest,
∗∗∗P<0.005,∗∗P<0.01,∗P<0.05). Spindle duration is negatively modulated, while number of spindle cycles and spindle prevalence do not depend on brain temperature.Q10value of spindle frequency perfectly fits the biological range of 2–3 (H).I, modulation of spindle frequency is consistent across core and brain temperature (dotted line is unity). [Colour figure can be viewed at wileyonlinelibrary.com]
et al. 2007) and Otis and Mody (Otis & Mody, 1992), respectively.
An analytical expression exists for the fraction of open receptors based on the phase of the transmitter release, which is approximated with a simple (square) pulse:
r=r∞+(r−r∞) exp
−ϕht τr
if the pulse is on (8)
r=rexp (−ϕhβt) if the pulse is off (9) For further details on the deduction of these equations refer to the original model.
Conductances were adjusted to reproduce spindle oscillation with the characteristics described by Barth ´o et al.(2014). Model cells matched the firing patterns of both TC and nRT cells, and spindles generated by the model reproduced waxing and waning behaviour but were slightly longer than the measured counterparts.
Our computer codes of the model are available online at https://github.com/BarthoLab/SpindleTemperature Model.
Model topography
For the construction of the model we interpret the connections of the network as a bipartite directional graph where the two sets of nodes are the TC and nRT cells. We used a one-dimensional network: both sets of cells are on a one unit long line with equal distances between them, and the two lines of the two sets are parallel to each other.
For the sake of reproducibility we used a deterministic random number generator based on the Mersenne Twister algorithm (MATLAB 2016a) to choose target cells. Our examined networks consisted of 100 TC cells and 20 nRT cells. Each TC cell targets 8 different nRT cells from the closest 20, based on a normal distribution. The nRT cells target 20 different TCs from the closest 50. We did not allow reciprocal connections in our networks. The algorithm creates the network without any consideration of the reciprocal rule, and it trims these pairs after the com- pletion of the structure. In the case of bidirectional TC and nRT connections, one is removed based on a coin flip.
The strength of a given synaptic connection in the network is given by the weight associated with it.
Connection weights are normally distributed with a mean as the default synaptic strength. This approach makes it theoretically possible to create topologically analogous networks that have completely different behaviours because of the different synapses. We created over 10,000 different networks – where the topology was based on different random seeds – and ran them for 2 s on random temperatures between 34.0 and 37.5°C.
Spindle detection methods were similar to the ones used in real life measurements. Low spindle frequency was a
sign of detection failure in most of the manually examined results, thus we automatically excluded cases with a spindle frequency lower than 8 Hz from our analysis.
Statistical analysis
Correlations were calculated using Pearson’s coefficient (MATLAB corrcoef function). Pooled correlation coefficients were transformed to normal distribution by the Fisher z-transform prior to testing, otherwise, parametric statistical tests were used based on the normality of observed distributions tested with the Kolmogorov–Smirnov test at a 0.05 significance level. In all statistical tests with no significant results, the powers of the tests were above 0.75 with the sample sizes used in the study, based on a minimal effect size of 0.2 in the case of correlation comparisons and 1 Hz for spindle frequency difference. Throughout the paper we show mean values ± standard error of mean (SEM), unless specified otherwise. All analysis was done in MATLAB (MathWorks).
Local heating experiments. Spindle parameters during locally heated and control periods were compared with Student’s two-samplettests instead of pairedttests, since the number of spindles in the respective periods were different. In the case of pooled data (Fig. 2F), only those comparisons were included where the number of spindles occurring during any heating/control period was above 10. Since three comparisons were omitted based on this criterion, the Mann–Whitney test was used instead of the corresponding paired tests.
Depth of anaesthesia. When assessing the potential effect of body temperature on the depth of anaesthesia, we considered that the spontaneous decrease of urethane effect over time may induce spurious positive correlations with temperature in sessions where the animal was gradually heated over the time span of hours, and negative correlations during cooling sessions. Therefore, recordings within animals were broken up to heating and cooling sessions, and analysed separately. Partial correlations were calculated for three cortical LFP frequency bands (delta 1–4 Hz, beta 20–30 Hz and gamma 30–100 Hz) with temperature controlled for the effect of time using the MATLAB partialcorr function. Pooled correlations were tested for significance with a t test after the Fisher z-transform as described above.
Results
Core and brain temperature modulate sleep spindle frequency
Our first aim was to investigate the temperature dependence of thalamocortical oscillations with no or
minimal interference from global thermoregulation. To this end we employed urethane anaesthesia, known to impair thermoregulatory processes (Malkinson et al.
1988), yet closely mimic natural sleep (Clement et al.
2008). Thus the core body temperature could be manipulated by external heating within physiological boundaries, enabling the examination of how temperature changes as large as 4–5°C alter these oscillations.
Local field potential (LFP) and multiunit activity (MUA) were recorded from the thalamus and cortex of anaesthetized mice (n = 8) while the animals’ core body temperature was varied between 34 and 39°C.
To simultaneously measure brain temperature and ongoing neural activity, we used a thermoelectrode of our own design (Fekete et al. 2017). This probe has regular recording sites for unit activity, as well as a
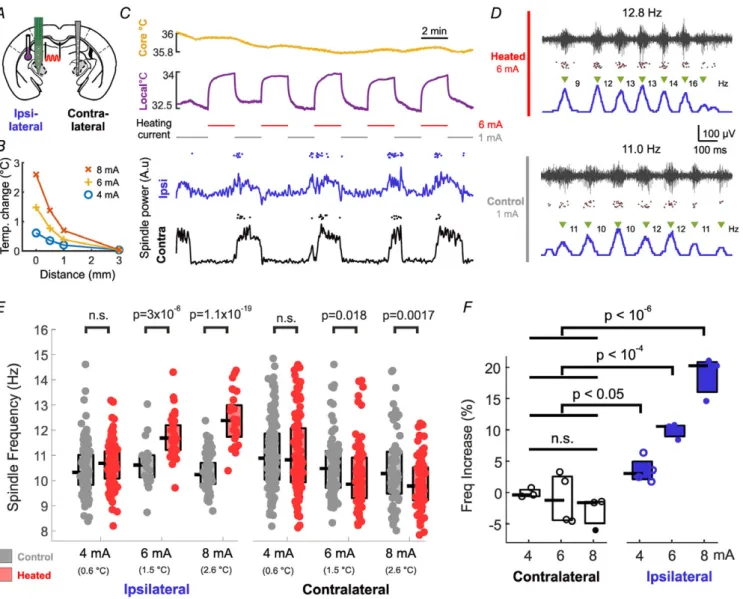
Figure 2. Temperature influences sleep spindles by a local mechanism
A, experimental setup: in one hemisphere, VPM/VPL thalamus was locally heated with the thermoelectrode, while neural activity was recorded both locally and in the contralateral thalamus.B, tissue temperature increases due to heating of the thermoelectrode filament with different currents. Note that tissue temperature shows a sharp decay with distance from the thermoelectrode.C, ipsilateral thalamus was heated in 2 min on/2 min off cycles (top). Spindling epochs occurred irrespective of the heating cycle in both hemispheres (bottom, line: spindle power; dots: individual detected spindles).D, representative examples of thalamically recorded spindles during and without heating (black trace: high-pass filtered recording, dots: detected multiunit spikes, blue line: smoothed MUA). Note that unit activity and spindle structure is undisturbed.E, local heating induces significant increase in spindle frequency in the case of 6 and 8 mA heating current, but no increase on the contralateral side.F, pooled results of 4 animals show a gradual effect in thalamic spindle frequencies with increasing heating current (open circles: non-significant effect, filled circles: significant effect with two-samplettests atP<0.01 as inE; pooled significance: Mann–Whitney test). [Colour figure can be viewed at wileyonlinelibrary.com]
temperature sensitive meander, capable of measuring the temperature of the surrounding tissue with an absolute precision of <0.2°C (relative precision <0.002°C). The thermoelectrode was placed in the primary somatosensory thalamus (ventral posteromedial nucleus (VPM)/ventral posterolateral nucleus (VPL)), while 16-channel linear silicon probes were also placed in the contralateral cortex/thalamus (Fig. 1A).
We detected sleep spindles from both thalamic (VPM/VPL) and cortical MUA and calculated their frequency (Fig. 1BandC). Besides LFP and MUA signals, and brain temperature, we simultaneously recorded core temperature and electrocardiogram (see Methods) and calculated heart rate variation from the detected R-waves of the ECG signal (Fig. 1C). Figure 1Dshows an example recording of core body and brain temperature under the warming and cooling protocols we used. First, after initial surgery and the implantation of sensors, by controlling the heating pad under the mouse, we let the core temperature of the animal cool down to 35°C. Next, in 30 min segments, we increased the temperature of the heating pad such that the core temperature increased by0.5°C in each recording segment, until the core temperature reached 39°C. In half of the animals, the order of heating and cooling was interchanged. This ensured that we collected a large number of spindles in a steady state temperature of different levels, excluding the effect of temperature dynamics and directionality. Brain temperature closely followed changes in core temperature (Fig. 1D) across all animals (Fig. 1E), brain temperature being lower by 2–3°C as expected in small animals under anaesthesia (LaManna et al.1989).
Spindle frequency and duration was consistently modulated by both core and brain temperature in the majority of animals, both in the thalamus and cortex.
We quantified this effect by calculating the correlation between brain temperature and spindle frequency (Fig. 1F for the animal in Fig. 1D). The pooled data of correlation coefficients from all animals (Fig. 1G) where the number of detected spindles exceeded 100 (thalamus: n = 6, cortex:n=7) show that spindle frequency is significantly modulated by brain temperature (mean correlation coefficient (R): 0.37± 0.18 for thalamic, R: 0.34 ±0.3 for cortical spindles, respectively,P= 0.0038 and 0.009, t test after Fisher z-transform). Spindle duration was also significantly modulated on the pooled data (mean R:−0.12±0.1,P=0.0014 in thalamus,R:−0.14±0.06, P=0.0019 in cortex). These values were still statistically significant after Bonferroni correction forn=4. On the other hand, the number of cycles per spindle and spindle prevalence showed no significant dependence on brain temperature.
To assess whether the changing body temperature influenced the depth of anaesthesia, we calculated the partial correlation of three cortical LFP frequency bands
(delta, beta and gamma) and temperature controlled for the effect of time (see Methods). Pooled partial correlation values were 0.034 ± 0.155 (delta), 0.028 ± 0.144 (beta) and 0.11 ± 0.263 (gamma), none of which was significantly different from zero (t test after Fisher z- transform).
The modulation of spindle frequency can be expressed as the Q10 value (the rate of change when increasing the temperature by 10°C) and we measured a median value of 2.44 for the thalamic spindles in our pooled data (Fig. 1H). Since in our protocol brain temperature changes followed body temperature, the examined parameters also correlated with core body temperature (Fig. 1I).
In conclusion, spindle frequency increases with brain temperature, accompanied by a decrease in spindle duration, leaving the average number of spindle cycles unchanged.
Local heating increases spindle frequency locally Temperature dependence of sleep spindles can arise from biophysical mechanisms of the TC–nRT loop, via the direct or indirect temperature sensitivity of global modulatory systems, or a combination of both. This can be tested by locally heating the spindle-generating thalamic circuitry, with the rest of the brain and the contralateral thalamus remaining at their resting temperature. We took advantage of the fact that, besides measuring temperature, the sensor filament of our thermoelectrode is capable of heating the surrounding tissue (Fig. 2A). Passing currents at or above 4 mA, instead of the small measuring current of 1 mA, the thermoelectrode increases the local temperature in a gradual fashion up to 3°C and this heating effect is relatively local (Fig. 2B). Also, the direct current passing the probe does not stimulate the unit activity electrically (Feketeet al.2017).
In these experiments, we placed the thermoelectrode with the platinum filament in the left VPM, from where we recorded both temperature as well as field and multiunit activity. The animals’ core temperature was kept at 36 ± 0.2°C. We applied heating currents of 4–8 mA.
Also, we placed a linear electrode in the contralateral VPM for control recording (Fig. 2A). The heating current was applied in a cyclic protocol (2 min heating/2 min measuring), while maintaining core temperature constant (Fig. 2C). The heating cycles did not disrupt the peri- odic recurrence of spindling epochs, as they appeared simultaneously with those on the contralateral hemisphere (Fig. 2C bottom), and they did not disrupt the internal structure of the spindles (Fig. 2D).
As seen in Fig. 2E, application of three heating currents (4, 6, 8 mA) produced a progressive increase in local spindle frequency as compared to the control periods. The phenomenon persists in the pooled data from four animals (Fig. 2F), from a small, but significant increase of spindle
frequency at 4 mA to 20% increase at 8 mA. There was no significant increase at the contralateral thalamus, though a small spindle frequency decrease was often observable, not reaching significance in the pooled data (for statistical details, see Methods). The duration of the spindles also decreased significantly in the case of 8 mA heating by 25.7 ± 3.8% (P = 0.019). These results imply that the temperature dependence of spindle frequency is largely due to local biophysical mechanisms.
In silicoTC–nRT model reproduces temperature dependence of spindle frequency
To further elucidate the possible mechanisms of the temperature dependence of sleep spindles, we created a thalamic network model consisting of single compartment TC and nRT cells. The model consisted of 100 TC and 20 nRT cells (Fig. 3A) that were randomly connected with a loose topography and were capable of producing trans- ient oscillations at the frequency domain of sleep spindles.
Non-synaptic currents of the original Destexhe models had a built-in temperature dependency: the transition rates of the gating variables in all channel models were multiplied by a factor based on the temperature coefficient of the respective channel. The temperature coefficient had an exponential dependence on the difference between the model temperature and the experimental temperature at which the rates were measured. We used the same method to implement the temperature dependency of synaptic currents.
Figure 3Bshows an example of spindles generated by the same network at 35.5 and 37°C, the latter showing a higher frequency. The pooled analysis of 500 random networks (Fig. 3C) revealed a marked correlation (R = 0.55, P<0.001) between spindle frequency and temperature.
To reveal whether any single current is responsible for this effect we repeated these simulations with the temperature dependence turned on for each individual current only (TC cellIT, nRT cellIT,Ih, AMPA and GABAA, respectively). We found that each current contributed to the effect by a small degree (Fig. 3D), with the exception of GABAA, which, when being temperature dependent alone, produced a small negative correlation. Thus, the model reproduced the effects of temperature change observed in mice with a statistically significant correlation between the temperature and spindle frequency as further evidence for the biophysical nature of this effect.
Infra-slow oscillations co-modulate temperature, heart rate and brain oscillations
So far we have analysed the temperature dependence of thalamocortical oscillations during external manipulation. Here we were interested in the microarchitecture of brain temperature variations under natural conditions, and the effects of these changes on these oscillations.
Detailed inspection of the temperature traces under urethane revealed that besides the gross changes induced by heating and cooling, brain temperature also shows
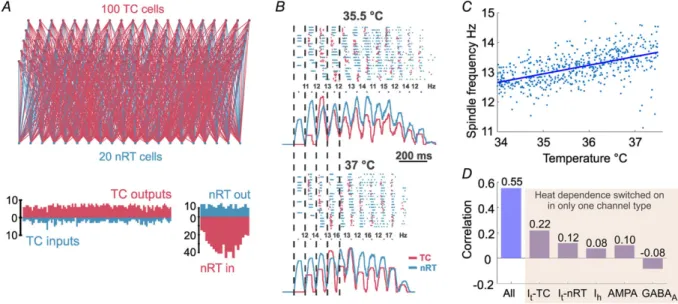
Figure 3. Network model reproduces temperature dependence of sleep spindles
A, schematic diagram of the network topography (above), and the number of connections for each TC and nRT cell (below).B, representative example spindles produced by the same network at two different temperatures.
Top: raster plot of TC and nRT units’ spiking, bottom: smoothed multiunit activity for TC and nRT cells. Note that the spindle at 37°C is faster.C, correlation between temperature and spindle frequency calculated from 500 individual spindles.D, correlations from simulations where temperature dependence was switched on for the labelled currents only. [Colour figure can be viewed at wileyonlinelibrary.com]
periodic fluctuations on a scale smaller by an order of magnitude (Fig. 4A). These fluctuations were super- imposed on, and appeared irrespectively of, the absolute brain temperature. Based on their amplitude and frequency, two types of fluctuations were differentiated.
Type I fluctuations were larger (0.22 ± 0.014°C from baseline to peak) and recurred on a10 min time scale (more details are provided in Table 1). Type II fluctuations were smaller (0.019± 0.0008°C from trough to peak), occurred with a 0.022 Hz frequency, interposed between cycles of Type I fluctuations. Under urethane anaesthesia, both types of fluctuations were associated with individual spindle events, increase in sigma power and elevation of heart rate (Fig. 4B). The periodicity of Type II fluctuations (Fig. 4C) corresponded to the frequency of infra-slow oscillation (Lecciet al.2017) and there is a clear temporal order between them (Fig. 4D).
Next, we were interested in whether these temperature fluctuations also exist during natural sleep. Animals were chronically implanted with miniature negative temperature coefficient (NTC) thermistors in the thalamus (see Methods), as well as tungsten electrodes to monitor cortical and thalamic LFP and multiunit activity, electromyogram and heart rate (Fig. 5A). Both Type I and Type II fluctuations were observed in naturally sleeping animals (Fig. 5BandC).
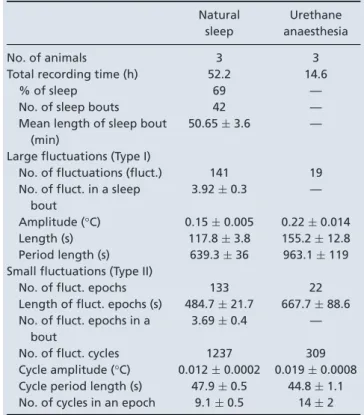
Table 1. Parameters of infra-slow temperature fluctuations in natural sleep and under urethane anaesthesia
Natural sleep
Urethane anaesthesia
No. of animals 3 3
Total recording time (h) 52.2 14.6
% of sleep 69 —
No. of sleep bouts 42 —
Mean length of sleep bout (min)
50.65±3.6 —
Large fluctuations (Type I)
No. of fluctuations (fluct.) 141 19 No. of fluct. in a sleep
bout
3.92±0.3 —
Amplitude (°C) 0.15±0.005 0.22±0.014
Length (s) 117.8±3.8 155.2±12.8
Period length (s) 639.3±36 963.1±119 Small fluctuations (Type II)
No. of fluct. epochs 133 22
Length of fluct. epochs (s) 484.7±21.7 667.7±88.6 No. of fluct. epochs in a
bout
3.69±0.4 —
No. of fluct. cycles 1237 309
Cycle amplitude (°C) 0.012±0.0002 0.019±0.0008 Cycle period length (s) 47.9±0.5 44.8±1.1 No. of cycles in an epoch 9.1±0.5 14±2
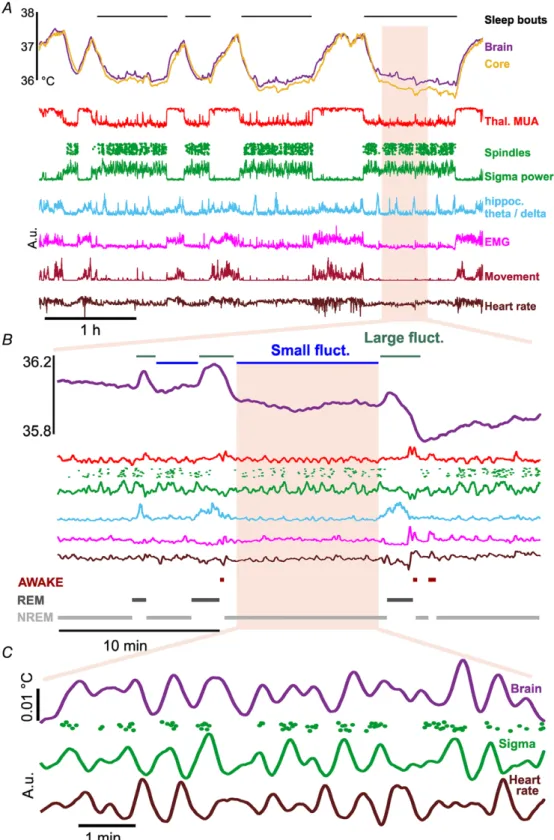
Figure 4. Microfluctuations in brain temperature accompany spindling epochs under urethane anaesthesia
A, example recording where microfluctuations of brain temperature, heart rate and spindle power appear to be in synchrony.B, when zooming in on a finer time scale, sigma power, heart rate and brain temperature oscillate together with an apparent temporal order between them.C, averaged autocorrelograms of pooled urethane data show that these microfluctuations are in the infra-slow frequency range (0.02 Hz).D, pooled cross-correlation (brain tempvs.other) shows that spindling and heart rate foregoes brain temp fluctuation, while general multiunit activity (MUA) lags behind. Values inCandDare normalized. A.u., arbitrary units. [Colour figure can be viewed at wileyonlinelibrary.com]
Figure 5. Spontaneous microfluctuations of physiological signals in natural sleep
A, example recording during wakefulness and sleep showing core and brain temperature, neural activity, locomotion/EMG and heart rate. Besides the brain and core temperature differences between sleep and wakefulness, smaller fluctuations are visible within sleep epochs. B, during a period of sleep two types of fluctuations appear in brain temperature. Large fluctuations are generally associated with increased hippocampal theta/delta ratio, while small fluctuations co-occur with sleep spindles.C, further zoom-in at an epoch of small fluctuations shows that brain temperature, heart rate and sigma power are co-modulated in the range of infra-slow oscillations. Except for temperature, values are in arbitrary units. [Colour figure can be viewed at wileyonlinelibrary.com]
During natural sleep, Type I fluctuations appeared slightly more frequently than under urethane (0.021 ± 0.0002 Hz) and with a smaller amplitude (0.012± 0.0002°C). They coincided with a surge in the theta/delta ratio of hippocampal activity (Fig. 5B), the hallmark of REM sleep. We analysed how changes in brain oscillations, muscle activity and heart rate correlated in time relative to the peak of these large temperature fluctuations (Fig. 6A and B shows pooled results). In general, broadband multiunit activity closely followed these elevations (16.5 ± 6.6 s median peak delay). As expected, hippocampal LFP theta/delta ratio activity was closely correlated, preluding these large temperature
fluctuations by 8.8 ± 5.4 s. In contrast to urethane anaesthesia, sigma power and spindling preceded Type I elevations by a relatively large median time of 49.4±9.6 s.
We also calculated the time lags of these parameters at half-amplitude, and these metrics confirm the temporal order described above. Averaging temperature to the onset of REM epochs confirmed that Type I fluctuations indeed accompany REM sleep (Fig. 6B). We may also see a slight increase in the averaged heart rate during these events, but this seems to be a negligible effect due to the large dispersion of the heart rate peaks relative to the respective temperature peaks. Neck muscle activity increases as both temperature as well as theta power
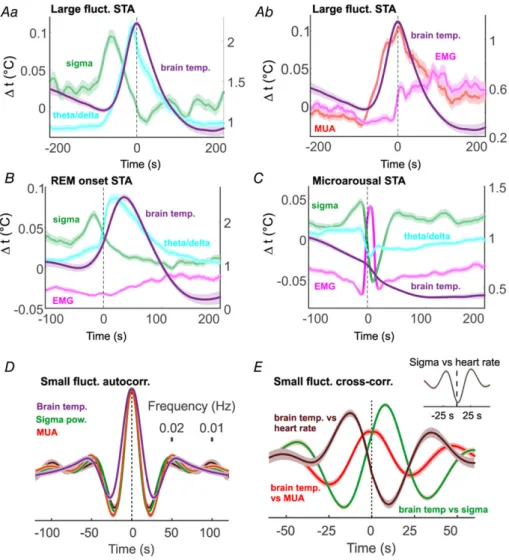
Figure 6. Large temperature fluctuations accompany REM epochs; small fluctuations are associated with infra-slow oscillation
Aaandb, spike triggered averages of physiological parameters relative to the peak of large fluctuations. Theta/delta ratio and thalamic multiunit activity align with temperature increase, while a sigma power and EMG decrease precedes temperature increase.B, spike triggered averages (STA) of the above parameters to REM onset. Parameters exhibit a similar pattern to that inA.C, STA triggered by microarousals.D, autocorrelogram of temperature, sigma power and MUA during small fluctuation epochs. The 0.02 Hz peak in the autocorrelogram corresponds to the frequency of the infra-slow oscillation.E, cross-correlations show that spindling foregoes temperature spikes, heart rate variation follows them, while broadband multiunit activity is in sync with the temperature. Except for temperature, values are in arbitrary units. [Colour figure can be viewed at wileyonlinelibrary.com]
declines, which is probably due to microarousals often following REM epochs. Surprisingly, microarousals by themselves were not associated by increases in brain temperature (Fig. 6C).
Type II fluctuations under natural sleep occurred interspersed between Type I elevations, with similar parameters to those in urethane anaesthetized animals (0.012 ± 0.0002°C from trough to peak, mean period length 47.9 ± 0.5 s). Their amplitude was smaller than under urethane, though this is likely to be a measurement effect, the NTC thermistor integrating signal from a larger area and therefore being less sensitive to local changes in temperature than the thermoelectrode.
Type II fluctuations appeared in synchrony with thalamic multiunit activity, sigma power and individual spindles, as well as heart rate variation. Figure 6Dshows the auto- correlograms of the average of all epochs, with a marked first peak in the 0.02 Hz range, corresponding to the period of infra-slow oscillation. Moreover, we found that the temporal order between these signals during these small fluctuation epochs is constrained. Broadband multiunit activity closely follows the temperature fluctuations (−0.65 ± 0.8 s delay), sigma power lags behind (7.5 ± 0.8 s delay), while heart rate variation preludes it (−11.92 ± 0.9 s delay), as the cross-correlations in Fig. 6Eshow. This differs from urethane data, where MUA is elevated in the opposite phase (Fig. 4D). In natural sleep, activity in VPM alternates spindling and delta epochs. Under low-dose urethane anaesthesia, however, VPM units often fire tonically between spindling epochs, with consequent higher MUA activity and temperature, despite the ongoing cortical delta activity. Note that the cross-correlation of sigma power and heart rate shows an inverse relation (Fig. 6Einset), which is in concordance with earlier results (Lecciet al.2017). In summary, both REM epochs and infra-slow oscillation are accompanied by changes in brain temperature, irrespective of the base- line temperature.
Discussion
To study the relationship of brain oscillations and temperature we recorded thalamic and cortical neural activity with simultaneous measurement of core body and brain temperature. We found that the frequency of sleep spindles correlates with brain temperature, most likely originating from the biophysical properties of local circuits, instead of the temperature sensitivity of global modulatory mechanisms. We also show that during natural sleep brain temperature is modulated by the infra-slow oscillation, as spindling and REM epochs are associated with microfluctuations in brain temperature.
Our results suggest that thalamocortical oscillations and brain temperature influence each other during physio- logical as well as pathological states.
Previous studies
Though temperature dependence of EEG rhythms have been described before, to our knowledge this is the first study to systematically combine LFP and multiunit recordings with brain temperature measurements, as well as use local heating and computational modelling to explain the underlying mechanism. Hoagland (1936) described higher frequency alpha-rhythms in patients undergoing hyperpyretic treatment, decreases in barbiturate-spindle frequency was found during cooling in cats (Andersen et al. 1967), and similar results were found in infants during surgical hypothermia (Schmitt et al. 2002). Also, De Vera et al. (1994) examined EEG activity in Gallotia galloti lizards and found that the frequency of spindle-like activity increases with body temperature, though these oscillations produce a continuum from 2 to 30 Hz, marking them as a different rhythm from mammalian spindles. A robust decrease in all EEG frequencies, especially theta, has been found in hibernating Djungarian hamsters (Deboer & Tobler, 1995;
Deboer, 1998). Our results are generally in line with these results, as the frequency of spindle oscillations showed a positive correlation with temperature.
Technical considerations
In the first part of this study, we used urethane anaesthesia to abolish thermoregulatory processes, so that we could manipulate the experimental animal’s temperature freely. The question is, can we apply these results to unanaesthetized subjects? Urethane anaesthesia is considered a good model of natural sleep (Clement et al. 2008; Pagliardiniet al. 2013), as it produces most sleep EEG rhythms with minor differences. Sleep spindles under urethane are very similar to those in natural sleep, except for their more limited spatial synchrony (Barth ´o et al. 2014). Also, as we show here, the 0.02 Hz peri- odic alternation between epochs of high sigma and high delta power, the so called infra-slow oscillation (Lecci et al.2017), occurs both under urethane and natural sleep, with the same frequency. Finally, urethane anaesthetized animals produce REM-like epochs with characteristic hippocampal theta oscillations, though these have a lower frequency (3–5 Hz) than during real REM (6–8 Hz), and are sensitive to atropine administration (Kramis et al.
1975).
A seemingly surprising phenomenon in our data is that the brain temperature is consistently below the core body temperature in all anaesthetized recordings. In fact, this is a well-known phenomenon. Awake animals, and large animals under anaesthesia, have a positive brain–body temperature gradient (Hamilton, 1963; Hayward & Baker, 1969; Mitchell et al. 2006; Hebert et al. 2008). Small animals under anaesthesia, on the other hand, have
a negative brain–body temperature gradient (Serota &
Gerard, 1938; McElligott & Melzack, 1967; LaMannaet al.
1989) most likely due to the higher brain-body surface ratio, the cooling from evaporation at the craniotomy site, and the impaired thermoregulation due to the anaesthetic.
Nevertheless, we show that the brain can produce spindle, theta and slow oscillations at 2–3°C below physiological brain temperature, therefore we can accept urethane anaesthesia as a suitable tool for our experiments.
Temperature dependence of biological processes It is well-known that temperature has an effect on the rate of biological processes (van’t Hoff, 1884; Arrhenius, 1889), with a temperature coefficient (Q10) between 2 and 3, so that the speed of the process doubles or triples as temperature increases by 10°C (Demirhan et al. 2010).
Despite a constantly redistributed cerebral heat, neuro- nal activity is a function of temperature; physiological and pathological temperature changes of the brain can be derived from the changes of local metabolism, cerebral blood perfusion and blood temperature (Hayward &
Baker, 1969). Brain cells show aQ10of 2.3 (Michenfelder
& Milde, 1991) or even higher in the physio- logical temperature range. Temperature dependence of electrophysiological properties in the neuron is well defined. Passive membrane properties, resting potential, action potential generation, ionic transport, conduction velocity, synaptic transmission and neurotransmitter reuptake are all dependent on thermal conditions (Katz
& Miledi, 1965; Brooks, 1983; Thompson et al. 1985;
Volgushevet al.2000; Tryba & Ramirez, 2004; Leeet al.
2005). Cerebral metabolic rate and oxygen affinity of haemoglobin are also affected by temperature change (Guyton & Hall, 2005). The sum of these effects may dramatically change neuronal network activity.
Temperature dependence of neural oscillations is usually also described by theQ10value, which is 2.3–2.7 for neural oscillations (Deboer & Tobler, 1995). Our results show a Q10of2.5 in the case of sleep spindles, suggesting that this value may be a general phenomenon in the nervous system. It is worthy of note that several poikilothermic animals, such as certain crustaceans and molluscs, employ compensatory mechanisms to make their neural oscillators robust to temperature changes (Partridge &
Connor, 1978; Tang et al. 2012). Whether a similar mechanism exists in the mammalian thalamocortical system remains to be elucidated.
Globalvs.local regulation
The main thermoregulatory centre in the brain is the preoptic area (POA) of the hypothalamus. POA receives input from peripheral thermoreceptors, but also contains intrinsically heat-sensitive neurons that are hypothesized
to monitor changes in brain temperature. The same region contains neurons that project to several modulatory centres (Peterfiet al.2009) involved in sleep maintenance.
POA contains warm-sensing neurons known to be activated during sleep (Alam et al. 1996). Therefore, it would not be surprising if body temperature influenced sleep rhythms via the posterior hypothalamus. Though it is unclear whether POA can directly influence brain thermoregulation, if it does it may influence the level of neuromodulators in the process, therefore influencing neural oscillations. Our results suggest that this is not the case, as local heating of the thalamus alters spindles ipsi- but not contralaterally. There is a possibility that locally heating the thalamus also warms the hypothalamic POA to a certain degree. Indeed, Fig. 2 shows that while local heating increases spindle frequency on the ipsilateral side, there is a smaller, non-significant adverse effect on the contralateral side that might arise from increased hypo- thalamic temperature perception, but this effect is smaller by a magnitude than that of local thalamic heating.
Brain temperature changes accompany state changes Besides brain temperature influencing neural oscillations, spontaneous changes of brain states may alter brain temperature in one way or another. We found that both REM, and on a smaller scale spindling epochs, are associated with elevated brain temperature.
Although the body’s temperature regulation switches off during REM (Parmeggiani, 1977), paradoxically brain temperature increases, as has been described in rabbit (Kawamura & Sawyer, 1965), cat (Satoh, 1968), rat (Kovalzon, 1973; Ob´al et al. 1985) and even fur seal (Lyamin et al. 2018) (though some monkey studies reported just the opposite (Reite & Pegram, 1968; Hayward
& Baker, 1969)). It is debated whether this effect is aimed to protect brain function from REM-associated hypo- thermia, or simply reflects the increased metabolic activity due to increased unit firing.
Spindling epochs in the rodent are periods resembling human stage II sleep, recurring with a periodicity of 0.02 Hz. This infra-slow oscillation has been observed in both rodents and humans (Steriade et al.1993; Lecci et al.2017), modulating LFP sigma band as well as heart rate (Lecci et al. 2017), pupil size (Blasiak et al. 2013) and fMRI BOLD signal (Mantiniet al.2007). We found that brain temperature fluctuates in synchrony with the infra-slow oscillation, including sigma power, individual spindle events, as well as heart rate. What can be the cause of these fluctuations? Physiological and pathological temperature changes of the brain can be directly derived from the changes of local metabolism, cerebral blood perfusion and blood temperature (Hayward & Baker, 1969;
Wanget al.2014). In our case, the temperature elevations were correlated with increased multiunit activity, which
may increase temperature directly, or via enhancing the local blood flow.
Significance of brain rhythm alterations
What is the significance of temperature induced changes in brain rhythms? Though their exact function is still debated, the general consensus is that neural oscillations during sleep play a major role in learning and memory consolidation. Several studies reported increases in slow wave and spindle activity during sleep after learning tasks (Feld & Born, 2017). Also, transcranial DC stimulation (Marshall, 2004), or phase-locked auditory stimulation (Ngo et al. 2013) of slow waves during sleep can enhance consolidation of declarative memories. Aside from learning, spindle duration and frequency is affected in a variety of pathological states, including schizophrenia (Manoachet al. 2016). Spindle duration and frequency also correlates with intelligence (B ´odizset al.2014).
As learning involves both long-term potentiation (LTP) and long-term depression (LTD) of synapses, packets of synchronized neural activity such as up-states or cycles of sleep spindles make these oscillations an ideal candidate for ‘burning in’ new memories. The frequency range of sleep spindles is especially suited for inducing LTP in cortical circuits (Rosanova & Ulrich, 2005). A change in the frequency of this oscillation is likely to affect synaptic potentiation in one way or another. Indeed, a 2°C drop in body temperature markedly reduces information recall (Coleshawet al.1983). Another aspect of thalamocortical oscillations is the binding hypothesis (Nikoli´cet al.2013) stating that oscillations create a temporal window for selected groups of neurons to fire together to form a representation. Though originally proposed for gamma oscillations in awake subjects, it is probable that spindles operate along the same logic in a different scenario, in which case, frequency matters.
An alternative scenario would be that information in spindles is determined by the different groups of neurons involved in each cycle, in a synfire-chain fashion. In our data, the increase in spindle frequency was accompanied by a decrease in spindle duration, leaving the number of cycles per spindle unchanged with temperature. This would mean that the observed changes actually reflect the robustness of information encoding in spindles with regards to brain temperature.
Our data show that body along with brain temperature changes have an important but underrated role in sleep quality. Since pharmaceutics and other medical or experimental interventions can alter brain temperature, leading to spindle frequency changes as high as 2–3 Hz, they need to be taken into consideration for the planning and analysis of both animal research and medical procedures.
References
Alam MN, McGinty D & Szymusiak R (1996). Preoptic/anterior hypothalamic neurons: Thermosensitivity in wakefulness and non rapid eye movement sleep.Brain Res718, 76–82.
Alf¨oldi P, Rubicsek G, Cserni G & Ob´al F (1990). Brain and core temperatures and peripheral vasomotion during sleep and wakefulness at various ambient temperatures in the rat.
Pflugers Arch417, 336–341.
Andersen P, Andersson SA & Lomo T (1967). Some factors involved in the thalamic control of spontaneous barbiturate spindles.J Physiol192, 257–281.
Arrhenius S (1889). On the reaction velocity of the inversion of cane sugar by acids.Zeitschrift f¨ur Physikalische Chemie4, 226–248.
Baker MA & Hayward JN (1967). Autonomic basis for the rise in brain temperature during paradoxical sleep.Science157, 1586–1588.
Bal T, von Krosigk M & McCormick DA (1995). Role of the ferret perigeniculate nucleus in the generation of synchronized oscillationsin vitro.J Physiol483, 665–685.
Barth ´o P, Hirase H, Monconduit L, Zugaro M, Harris KD &
Buzs´aki G (2004). Characterization of neocortical principal cells and interneurons by network interactions and extracellular features.J Neurophysiol92, 600–608.
Barth ´o P, Sl´ezia A, M´aty´as F, Faradzs-Zade L, Ulbert I, Harris KD & Acs´ady L (2014). Ongoing network state controls the length of sleep spindles via inhibitory activity.Neuron82, 1367–1379.
Blasiak T, Zawadzki A & Lewandowski MH (2013). Infra-slow oscillation (ISO) of the pupil size of urethane-anaesthetised rats.PLoS One8, e62430.
B ´odizs R, Gombos F, Ujma PP & Kov´acs I (2014). Sleep spindling and fluid intelligence across adolescent development: sex matters.Front Hum Neurosci 8, 952.
Brooks VB (1983). Study of brain function by local, reversible cooling.Rev Physiol Biochem Pharmacol95, 1–109.
Clement EA, Richard A, Thwaites M, Ailon J, Peters S &
Dickson CT (2008). Cyclic and sleep-like spontaneous alternations of brain state under urethane anaesthesia.PLoS One3, e2004.
Coleshaw SR, Van Someren RN, Wolff AH, Davis HM &
Keatinge WR (1983). Impaired memory registration and speed of reasoning caused by low body temperature.J Appl Physiol Respir Environ Exerc Physiol55, 27–31.
Deboer T (1998). Brain temperature dependent changes in the electroencephalogram power spectrum of humans and animals.J Sleep Res7, 254–262.
Deboer T & Tobler I (1995). Temperature dependence of EEG frequencies during natural hypothermia.Brain Res670, 153–156.
Delgado JM & Hanai T (1966). Intracerebral temperatures in free-moving cats.Am J Physiol211, 755–769.
Demirhan A, Kaymaz M, Ahıska R & G¨uler I (2010). A survey on application of quantitative methods on analysis of brain parameters changing with temperature.J Med Syst34, 1059–1071.