University of Pannonia
Doctoral School of Chemistry and Environmental Sciences
and
Center for Natural Science Research Group of Limnology
Ecophysiological plasticity of different algal taxa
“Measure what is measurable, and make measurable what is not so.”
Galileo Galilei Supervisor
Prof Dr Judit Padisák Corresponding Member of the Hungarian Academy of Science, Professor, University of Pannonia, Center for Natural Science, Research Group of Limnology
Ph.D. Dissertation Tamás Pálmai
2020
Photo by Tamás Pálmai
DOI:10.18136/PE.2020.766
ECOPHYSIOLOGICAL PLASTICITY OF DIFFERENT ALGAL TAXA Thesis for obtaining a PhD degree in the Doctoral School of Chemistry and Environmental
Sciences of the University of Pannonia in the branch of Environmental Sciences
Written by Pálmai Tamás Supervisor(s): Prof. Dr. Padisák Judit
propose acceptance (yes / no) ……….
(supervisor/s) The PhD-candidate has achieved ... % in the comprehensive exam,
Veszprém, ……….
(Chairman of the Examination Committee) As reviewer, I propose acceptance of the thesis:
Name of Reviewer: …... …... yes / no
……….
(reviewer) Name of Reviewer: …... …... yes / no
……….
(reviewer) The PhD-candidate has achieved …...% at the public discussion.
Veszprém, ……….
(Chairman of the Committee) The grade of the PhD Diploma …... (…….. %)
Veszprém,
……….
(Chairman of UDHC)
3
Abbreviations
P – I curve – Photosynthesis-light intensity curve PAR – Photosynthetically active radiation (400-800 nm) PBmax – Biomass specific maximal photosynthetic activity
Ps – Biomass specific maximal photosynthetic activity in a lack of photoinhibition RB – Biomass specific respiration
Ik – Photoadaptation parameter Ic – Compensation light intensity α – Light utilization parameter β – Photoinhibition
µ – Specific growth rate DO – Dissolved oxygen
4
Content
Abbreviations ... 3
Content ... 4
Abstract ... 7
Zusammenfassung ... 9
Kivonat ... 11
1 General introduction... 13
1.1 Photosynthetic pigments of cyanobacteria and algae ... 13
1.2 Photopigment-binding protein complexes ... 14
1.3 Light Absorption and photosynthetic electron transport ... 15
1.4 Carbon assimilation ... 17
1.5 Primary affecting environmental factors ... 17
1.5.1 Light intensity ... 17
1.5.2 Temperature ... 18
1.5.3 Conductivity ... 18
2 Main objectives ... 19
3 Temperature and light intensity dependent photosynthetic characteristics of some algae and cyanobacteria ... 20
3.1 Introduction ... 20
3.2 Materials and methods ... 23
3.2.1 Isolation and cultivation ... 23
3.2.2 Determination of photosynthetic activities ... 23
3.2.3 Statistical analysis ... 27
3.3 Results ... 28
3.3.1 Bacillariophyta ... 28
3.3.2 Cyanobacteria ... 28
3.3.3 Chlorophyta ... 29
3.3.4 Charophyta ... 29
3.3.5 Rhodophyta ... 30
3.3.6 Statistical analysis ... 30
3.4 Discussion ... 32
5
4 Quantitative estimation of photosynthetic plasticity: effect of
temperature on various algal species ... 36
4.1 Introduction ... 36
4.2 Materials and methods ... 40
4.2.1 Examined strains and photosynthetic variables ... 40
4.2.2 Statistical and other data analysis ... 41
4.2.3 Estimating the plasticity of different species in a wide range of temperature ... 41
4.3 Results ... 43
4.3.1 Statistical analysis ... 43
4.3.2 Quantitative estimation of the species’ plasticity ... 43
4.4 Discussion ... 47
5 Growth and photosynthetic response to changing environmental conditions of Picocystis salinarum and Limnospira (Arthrospira) fusiformis strains from saline-alkaline Flamingo lakes of East Africa with special focus on the poorly studied picoalga... 51
5.1 Introduction ... 51
5.2 Materials and methods ... 55
5.2.1 Strains and cultivation ... 55
5.2.2 Photosynthesis measurements ... 55
5.2.3 Chemostat measurements: Growth and competition experiments ... 55
5.2.4 Statistical analysis ... 58
5.3 Results ... 59
5.3.1 Photosynthesis-light characteristics ... 59
5.3.2 Photosynthesis-temperature characteristics ... 59
5.3.3 Chemostat measurements: Growth and competition experiments ... 60
5.4 Discussion ... 64
6 Acknowledgement ... 70
7 Contribution to the research ... 71
8 References ... 72
Results in thesis points ... 90
1 Temperature and light intensity dependent photosynthetic characteristics of
some algal and Cyanobacteria species ... 90
6
2 Quantitative estimation of photosynthetic plasticity: effect of temperature
on various algal species ... 90
3 Growth and photosynthetic response to changing environmental conditions of Picocystis salinarum and Limnospira (Arthrospira) fusiformis strains from saline-alkaline Flamingo lakes of East Africa with a special focus on the little known picoalga ... 91
9 List of publications ... 92
9.1 Papers related to the dissertation ... 92
9.2 Other papers and book chapter ... 92
9.3 Congress attendances related to the dissertation ... 93
9.4 Other congress attendances ... 94
Appendix ... 95
7
Abstract
Inland waters provide diverse habitats. Most of the species of inland waters are sensitive to the changes of environmental factors and also to the most important environmental problem of the 21th century: the global climate change. Previous experiences have shown that the changes of one (or more) environmental factor(s) like temperature, pH or conductivity could result in the changes of entire ecosystems. The present dissertation was aimed at examining ecophysiological effects of three environmental factors under laboratory conditions, namely:
temperature, light intensity and conductivity. Specifically:
i. to examine the effect of temperature and light intensity on the photosynthetic activity of different algal and cyanobacterial species to reveal the species specific differences between the photosynthetic response with a special focus on a rapidly spreading group of cyanobacteria;
ii. using the determined photosynthetic parameters to estimate the plasticity of the species along environmental scales with applying literary methods or develop a new one;
iii. to examine the ecophysiology of two East African strains of Limnospira fusiformis and Picocystis salinarum under wide ranges of temperature, light intensity and conductivity and also to reveal the effect of fast conductivity changes on the coexistence of the species.
For these purposes, monocultures were set up using own isolations (one cell isolation), species from other collections and also natural samples if the sample were highly dominated by one single species. The major conclusions of the examinations are the following:
i. The photosynthetic activity of the selected 16 species showed strong temperature and light intensity dependence, confirming the literary models. However, the reaction norms were species specific with respect to both temperature and light intensity. Though high variability was detected in all examined phyla, cyanobacteria had the highest photosynthetic activity both as a group and also the highest photosynthetic activity was presented by a cyanobacterium: Limnospira fusiformis. Also, the highest temperature optima were related to cyanobacterial species.
ii. Plasticity estimating methods in the scientific literature calculate with the ratios of the examined variables, consequently they overestimate the significance of relative changes.
Species with low photosynthetic activity (like Monoraphidium griffithii in this research) are presented by these methods as highly plastic species due the high relative change in their PBmax. Comparison of the length of reaction norms of species along wide range of
8
temperature to a reference (CLP - zero plasticity) calculate with both the ratio of change and the absolute values along the temperature scale. However the limitation of this method is that it does not allow the comparison of different units (for which an example is included: comparing data of planktonic and attached algal species).
iii. The photosynthetic characteristics of the two examined African species differed greatly:
high level of photosynthetic activity coupled with high temperature and light intensity optima of Limnospira fusiformis were determined. In contrast, Picocystis salinarum had lower photosynthetic activity by an order of magnitude, with also lower temperature and light intensity optima. Tolerance or even preference of high conductivity of Picocystis salinarum was observed, especially if the high conductivity was provided by carbonate forms. Rapid changes of conductivity favoured the picoalga against Limnospira fusiformis.
9
Zusammenfassung
Binnengewässer bieten für die Lebewesen diverse Habitate. Sie reagieren auf Änderungen von Umweltfaktoren und ebenso auf das größte Umweltproblem des 21 Jahrhunderts, dem globalen Klimawandel. Die Erfahrungen zeigen, dass Änderungen eines oder mehrerer Faktoren, z.B.
Temperatur, pH-Wert oder Leitfähigkeit zu Änderungen des gesamten Ökosystems und ihrer biotischen Struktur und Funktion führen können. Die vorliegende Dissertation hat zum Ziel, den ökophysiologischen Effekt der Umweltfaktoren Temperatur, Lichtintensität und Leitfähigkeit unter Laboratoriumsbedingungen auf verschiedene Primärproduzenten zu untersuchen. Dabei stehen folgende Aspekte im Mittelpunkt:
I. Analyse des Effektes von Temperatur und Lichtintensität auf die photosynthetische Aktivität verschiedener Cyanobakterien- und Algenarten, um artspezifische Unterschiede im photosynthetischen Verhalten aufzudecken, wobei der Fokus auf die weitverbreiteten Cyanobakterien liegt;
II. Anwendung der ermittelten photosynthetischen Paramenter zur Bewertung der Plastizität der Arten entlang von Umweltindizes aus der Literatur und Entwicklung eines neuen Index‘;
III. Untersuchung der Ökophysiologie von zwei Phytoplanktern aus Ostafrika, Limnospira fusiformis und Picocystis salinarum, unter verschiedenen Temperaturen, Lichtintensitäten und Leitfähigkeiten, um die Koexistenz der beiden Organismen unter sich schnell und dramatisch ändernden Bedingungen zu ergründen.
In die Experimente wurden eigene unialgale Isolate und Stämme aus Kultursammlungen sowie Freilandproben, die von Einzelarten dominiert wurden, einbezogen. Folgende Hauptresultate wurden ermittelt:
I. Die photosynthetische Aktivität von 16 ausgewählten Arten zeigte eine starke Abhängigkeit von Temperatur und Lichtintensität. Die Modelle aus der Literatur konnten bestätigt werden. Starke art- und stammspezifische Reaktionen auf Temperatur und Lichtintensiät wurden beobachtet. Die höchste photosynthetische Aktivität und das höchste Temperaturoptimum wurden bei Cyanobakterien, speziell bei Limnospira fusiformis ermittelt.
II. Plastizitätsbewertungsmethoden in der wissenschaftlichen Literatur rechnen mit den Verhältnissen der untersuchten Variablen, folglich überschätzen sie die Bedeutung der relativen Veränderungen. Arten mit geringer photosynthetischer Aktivität (wie
10
Monoraphidium griffithii in dieser Untersuchung) werden durch diese Methoden aufgrund der hohen relativen Änderung ihrer PBmax als hochplastische Arten dargestellt.
Der Vergleich der Länge der Reaktionsnormen der Arten entlang eines breiten Temperaturbereichs mit einer Referenz (CLP - Null-Plastizität), berücksichtigt sowohl das Verhältnis der Änderung als auch die absoluten Werte entlang der Temperaturskala.
Die Einschränkung dieser Methode besteht jedoch darin, dass sie den Vergleich verschiedener Einheiten nicht zulässt (hierfür ein Beispiel für den Vergleich von Daten planktonischer und sessiler Algenarten).
III. Die photosynthetische Charakteristik der beiden untersuchten Arten aus einem ostafrikanischen Sodasee unterschied sich stark: Bei Limnospira fusiformis wurde eine hohe photosynthetische Aktivität bei gleichzeitig hohen Temperatur- und Lichtintensitätsoptima festgestellt, bei Picocystis salinarum dagegen eine um eine Größenordnung niedrigere photosynthetische Aktivität bei niedrigen Temperatur- und Lichtintensitätsoptima. Es wurde eine Toleranz oder sogar Präferenz für eine hohe Leitfähigkeit von Picocystis salinarum beobachtet, insbesondere wenn die hohe Leitfähigkeit durch Karbonatformen bereitgestellt wurde. Schnelle Änderungen der Leitfähigkeit begünstigen die Picoalge gegenüber Limnospira fusiformis.
11
Kivonat
A felszíni vizek változatos élővilágnak adnak otthont. Legtöbbjük igen érzékenyek az abiotikus környezeti tényezők változására, így a XXI. század legnagyobb környezeti problémájára, a globális klímaváltozásra is. A tapasztalatok alapján bármely fizikai illetve kémiai paraméterben (pl. hőmérséklet, pH, vezetőképesség) bekövetkező változás biotikus változások sorát indíthatja el, mely gyakran az ökoszisztéma egész rendszerére kihat, azt alapvetően változtatja meg. Jelen kutatás alapvető célja három környezeti változó, a hőmérséklet, a fényintenzitás és a vezetőképesség ökofiziológiai hatásának vizsgálata labororatóriumi körülmények között, az alábbi fő szempontok szerint:
i. a hőmérséklet és fényintenzitás fotoszintézisre gyakorolt hatásának vizsgálata több, különböző törzshöz tartozó faj esetében, a fajspecifikus különbségek feltárása, különös tekintettel a cianobaktériumokra, melyek világszerte tapasztalt terjedésének egyik fő okaként a magasabb hőmérséklet preferenciát jelölték meg;
ii. a meghatározott fotoszintetikus paramétereket felhasználva egy olyan index keresése az irodalomban, vagy egy olyan új index létrehozása mellyel a fajok fotoszintézisének plaszticitása becsülhető környezeti változók széles skálája mentén;
iii. Két Kelet-Afrikából származó törzs (Limnospira fusiformis és Picocystis salinarum) ökofiziológiai vizsgálata a fény, a hőmérséklet és a vezetőképesség széles tartományában, valamint a gyors vezetőképesség változás hatásának vizsgálata a két faj koegzisztenciájára.
A fenti kérdések megválaszolásának céljából egysejt izolálással létrehozott tiszta tenyészetek mellett más gyűjteményekből kapott fajok illetve természetből vett, egy faj által dominált minták vizsgálatára is sor került. A kísérletek segítségével az alábbi főbb megállapítások tehetők:
i. A vizsgált 16 faj esetében erős összefüggés állapítható meg a hőmérséklet és a fotoszintetikus aktivitás, illetve a fényintenzitás és a fotoszintetikus aktivitás között. A kapott eredmények megfelelnek a korábban leírt modelleknek, de a fajok válaszgörbéinek lefutása között jelentős különbségek vannak, mind hőmérséklet, mind fényintenzitás tekintetében. Bár minden vizsgált törzsön belül nagy változatosság (szórás) tapasztalható, mégis megállapítható, hogy a fotoszintetikus aktivitás tekintetében mind az átlag mind pedig a legnagyobb érték a cianobaktérium fajok esetében volt a legnagyobb, emellett magasabb hőmérséklet optimum is megfigyelhető volt ennél a törzsnél.
12
ii. A vizsgált irodalmi módszerek mindegyike (PP, CV, heatmap) a környezeti változók arányával dolgozik, így a relatív változások rendkívül hangsúlyosan jelennek meg az eredményekben. Ez okozhatta, hogy az egyik legalacsonyabb fotoszintetikus aktivitást mutató faj (Monoraphidium griffithii) esetében mutatták ki az indexek a legnagyobb plaszticitást. Ezzel szemben a válasz görbék vizsgálata, illetve egy referencia állapothoz (amikor nincs plaszticitás) történő hasonlítása a relatív változások mellett a fajok fotoszintézisének abszolút értékeivel is számol. Ez az index a vizsgált fajok közül az első három helyre cianobaktériumot rangsorolt, valamint a nyolc legplasztikusabb fajból öt szintén ebbe a törzsbe tartozott.
iii. A vizsgált két faj fotoszintetikus karakterisztikája nagyban eltért: míg a Limnospira fusiformis esetében nagy fotoszintetikus aktivitást, magas hőmérséklet és fényintenzitás optimum került meghatározásra, addig a Picocystis salinarum esetében a fotoszintetikus aktivitás jóval alacsonyabb volt csakúgy, mint a hőmérséklet és fényintenzitás optimumok. A Picocystis salinarum esetében magas vezetőképesség tűrést, sőt preferencia volt tapasztalható, kiváltképp, ha a magas vezetőképességet karbonátok okozták. A gyors vezetőképesség változás két faj koegzisztenciájára gyakorolt hatásának vizsgálata során bizonyítást nyert, hogy a gyors változások az ezeknek a változásoknak jobban ellenálló pikoalgát részesítik előnyben.
13
1 General introduction
Living organisms need energy for maintaining their life processes and they can satisfy their need from two sources: chemical energy and/or light. Using light as energy source is the most important process on Earth since photosynthesis has been providing the oxygen to the atmosphere. Photosynthesis is the biological conversion of light energy to chemical energy (Falkowski and Raven 2007). The first step of photosynthesis is the absorption of light, then transfer the energy to reaction centers, where it is used in electrical charge separation (Falkowski and Raven 2007).
Exploring photosynthesis started in the 17th century with the work of J. B. van Helmont, Ingenhousz and Joseph Priestley. In the late 18th century, Jean Senebier identified carbon dioxide as the main nutrients for plants. In the early19th century N.T. de Saussure found that the carbon dioxide reduction could be described analogously with the known process of animals’ respiration but in the opposite direction. This is lead to the well-known equation of photosynthesis:
6𝐶𝑂2+ 6𝐻2𝑂𝑙𝑖𝑔ℎ𝑡→ 6𝑂2+ 6𝐶6𝐻12𝑂6.
Later Pelletier and Caventou isolated and named chlorophyll (1817). In the middle 19th century Robert Meyer interpreted photosynthesis as the capture of light energy. In 1905 F.F.
Blackman observed light-saturation curve and distinguished light and dark reactions. The conservation of light energy was separated from carbon dioxide fixation when R. Hill showed that isolated chloroplasts could produce oxygen. S. Ruben and M. Kamen proved that the emitted oxygen came from water during photosynthesis. Later on Melvin Calvin, Andrew Benson and James Bassham described the process of carbon assimilation in plants, which called Calvin-cycle (Gregory 1990).
As the groups of oxygenic photosynthetic microorganisms are in the focus of present dissertation, the following chapter is presents briefly some main steps of oxygenic photosynthesis.
1.1 Photosynthetic pigments of cyanobacteria and algae
The major photopigments in oxygenic photosynthetic organisms are chlorophylls (Chl).
Chlorophylls are cyclic tetrapyrroles containing a distinctive five-membered ring (Larkum 2016, Wang 2020). There are five described chlorophylls in oxygenic photosynthetic species:
14
Chl a, Chl b, Chl c, Chl d and Chl f. The most important is chlorophyll a. Chl a exists in algae and cyanobacteria and Chl a content is responsible for a substantial part of the light harvesting, however there is a huge difference in the accessory pigments of different phyla. Green algae have Chl b besides Chl a and a structurally similar light-harvesting system as higher plants.
(Larkum 2016, Wang 2020).
Carotenoids absorb light mainly in the 400-530 nm spectral range (Hashimoto et al. 2016, Wang 2020). Besides light harvesting, they also have the important role in protection against oxidative stress. In cyanobacteria usually β-carotene and different xanthophylls occur, however there some species with α-carotenes (Takaichi et al. 2012, Wang 2020). The composition and contents of carotenoids may change in response to light intensity: e.g. zeaxanthin concentration increase under high-light. In green algae and plants concentration of carotenoids changes in the so called xanthophyll cycle: rapid epoxidation and de-epoxidation cycle among zeaxanthin, antheraxanthin, and violaxanthin which is driven by the changed light conditions (Demmig- Adams 1990, Goss and Jakob 2010, Wang 2020), although in cyanobacteria this cycle has not been reported, and zeaxanthin may accumulate in high-light conditions through oxidation of β- carotene (Masamoto and Furukawa 1997, Wang 2020).
Cyanobacteria and Rhodophyta (and also some other phyla which have not been studied in present dissertation) species have phycobiliproteins, which play an important role in their light capture. Phycobiliproteins are able to harvest light in the 490–650 nm range, where chlorophylls and carotenoids not, or not efficiently. The evolution of these proteins is pretty unclear, it is said to be possible that these proteins evolved before chlorophylls. However, according to Larkum (2006), it is more likely that some chlorophylls evolved before phycobiliproteins, and phycobiliproteins evolved later to avoid the negative effect of shading (Larkum 2006, 2016).
1.2 Photopigment-binding protein complexes
Chlorophylls, carotenoids and bilins, are carefully arranged inside the pigment-binding protein complexes. The major protein complexes in oxygenic photosynthetic organisms are PSI and PSII (Figure 1). These complexes are associated with thylakoid membrane-embedded light- harvesting protein complexes (LHC) and/or extrinsic phycobilisomes (Wang 2020).
Photosystems are made up of a reaction centre core which is surrounding by the inner antenna and there is an associated intrinsic membrane-bound antenna or extrinsic phycobilisomes. In plants and algae, with rare exceptions the intrinsic chlorophyll-binding
15
antenna is three-helical transmembrane Chl a-/b-binding light-harvesting complexes (LHCs) (there are some algal species Chl a-/c-binding LHC). There are two main classes of LHCs: LHC I and LHC II. LHC I is associated with PS I, while LHC II is associated with PS II mainly (Wang 2020).
Red algae also have the extrinsic phycobilisomes as the major antenna system. There are three main components in assembled phycobilisomes: phycoerythrin, phycocyanin and allophycocyanin (Wang 2020).
Most cyanobacteria have two antenna systems, phycobilisomes and Chl-binding antenna systems. The Chl-binding light-harvesting systems is structurally different from the LHCs in eukaryotic photosynthetic organisms(Wang 2020). Cyanobacteria’s PS I is a trimer and has extrinsic Chlorophyll a-/b-binding protein complexes. The core complex of PS I consists of 12 subunits, includes the reaction center core, small transmembrane proteins and 3 stromal subunits. The direct interaction between antenna and PS I is determined after isolation of antenna-PS I supracomplexes. Some cyanobacteria show interaction between phycobilisomes and PS I.
Photosystem II is a multiple protein subunit complex containing RC and intrinsic core antenna and typically arranges as a dimer. PsbA (D1) and PsbD (D2) are the core subunits in RC II and bind six Chls including the special pair of Chl a (P680). CP43 and CP47 are core antenna subunits and bind 13–16 chlorophylls individually. The extra loop of CP43 protein with D1 subunit together forms a binding dock for oxygen evolution center including Mn4CaO5
complexes(Wang 2020).
Central features of oxygenic photosynthesis are the sequentially coupled two photosytsems, photosystem II and photosystem I located in the thylakoid membrane and connected by the intersystem electron transport chain. This downhill electron transport chain chain consists of two mobile electron carriers, plastoquinone (PQ) in cyanobacteria and algae the integral membrane cytochrome b6f (Cyt b6 f) complex.
Beyond being an oxidoreductase, the Cyt b6 f complex operates as a proton pump and couples the downhill, vectorial electron transport with an effective proton translocation.
1.3 Light Absorption and photosynthetic electron transport
The absorption of light causes a change in the energy state of the pigment molecules. A π electron from ground state according to a photon get into excited state (π*) if the energy of the photon matches the energy gap between the ground and excited state of the π electron. There
16
are three de-excitation pathways. The first is re-radiation by fluorescence or luminescence, second is to transfer the energy to the environment in a form of heat, the third is the coupling of the excited-state energy dissipation to a chemical reaction (e.g. in the oxidation of a molecule). The energy can be transferred by two basic radiationless methods: the Förster mechanism and the Dexter mechanism. In the Förster mechanism energy transfer is the result of the resonance overlap between the wavefunctions of the singlet excited states of two molecules. In this process a photon is never physically transferred from the donor molecule to the acceptor to give fluorescence, but the excitation energy migrates as anexciton. The excitation migrates from molecule to molecule within the pigment matrix, randomly following overlapping wavefunctions of pigment molecules that alternate between the excited and ground state. This energy transfer is usually from a higher to a lower energy level (Falkowski and Raven 2007).
Figure 1 Overall scheme of photosynthetic electron and proton transport (after Falkowski and Raven 2007)
The excited states of the pigment molecules lead to a redistribution of electrons between the pigment molecules. Finally the energy of absorbed photons is used to be physically transferred from a donor via changing the electronic structure of pigment molecules. The lost electron is restored by the Mn containing centrum of PSII. The electrons gained from H2O are used to reduce molecules in the electron transport chain. The main role of this process is to provide chemical reductants. These reductants used to assimilate inorganic carbon and chemical energy for further metabolic activity. It has a highly organized structure coordinate the electron and proton transfer (Falkowski and Raven 2007).
17
PSII, cytochrome b6f and PSI are in a linear electron flow with the aim of generate ATP and NADPH, the ratio of the two product is about 2.7:2. The CO2 assimilation requires 3:2 ratio, and also there are other processes and environmental factors which increase the ATP demand.
Cyclic electron flow of PSI and cytochrome b6f generate a proton gradient and ATP without reductants as a major ATP supply.
According to the Z-scheme, there are three segments of the electron transport chain: the donor side of PSII, which includes the reactions responsible for the injection of electrons into PSII from water; the intersystem electron transport chain, which includes all the carriers between PSII and PSI; and the acceptor side of PSI, in which the primary reducing agent, NADPH, is formed and exported for carbon fixation (Falkowski and Raven 2007).
1.4 Carbon assimilation
The NADPH and ATP created in the light reactions couple the light reactions to carbon fixation.
About 95% of the NADPH and ~60% of the ATP from the light reaction used to assimilate and reduce inorganic carbon. The most important component of the carbon assimilation is an enzyme: ribulose-1,5-bisphosphate carboxylase/oxygenase (Rubisco) (Falkowski and Raven 2007). Rubisco catalyses the assimilation of CO2 into two molecules of 3-phosphoglycerate.
The 3-phosphoglycerate in the presence of ATP and NADPD is reduced to glyceraldehyde 3- phosphate. Most of the glyceraldehyde 3-phosphate molecules are used to regenerate Rubisco.
The organisms use the three carbon product (3-phosphoglycerate) that has not been regenerated in their life processes.
1.5 Primary affecting environmental factors 1.5.1 Light intensity
Another important environmental factor affecting photosynthesis is light intensity. There are several equations to describe the connection between the photosynthetic activity and light intensity (P-I) (Webb et al. 1974, Jassby and Platt 1976, Platt and Jassby 1976, Platt et al. 1980).
According to the equations of these studies, the effect of light intensity on the photosynthetic activity could be divided into three phases. The first is the light limited phase, where the increasing light intensity increases the photosynthetic activity. Higher increasing of photosynthetic activity in this phase is suggest better light utilization, which could be estimated with the light utilization parameter, which is the initial slope of the P-I curve (α). The second is the light saturated phase where the photosynthetic activity reaches its highest value (PBmax) at a well-defined light intensity (Ik). The third is the photoinhibited phase, where further increase of
18
light intensity results in decrease of photosynthetic activity, the estimator parameter of this negative is effect is the photoinhibition parameter (β), however this phenomenon not necessary occurs in each case and is species specific.
1.5.2 Temperature
Temperature is one of the most important environmental factor that can substantially affect both the community (Adrian et al., 2009, Winder & Sommer, 2012, Winder et al., 2012) and the individuals (Davison 1991). Temperature has major effect on all life processes of a plankton species, including photosynthesis. The temperature dependence or more precisely the positive connection between temperature and the photosynthetic activity is described in several studies (e.g. Collins and Boylen 1982, Padisák 2004, Falkowski and Raven 2007, Lengyel et al. 2015, 2020). Also the warming of aquatic habitats can select species: in general Cyanobacteria species prefer higher temperatures (Robarts and Zohary 1987, Coles and Jones 2000, Vona et al. 2004, Butterwick et al. 2005, Watkinson et al. 2005, Kosten et al. 2012, Üveges et al. 2012, Singh and Singh 2015, Yan et al. 2020) than others. The effect of temperature can usually be described with some kind of a Gaussian-curve, since typically there is a positive connection between temperature and photosynthetic activity, until reaches a maximum, than further increase of temperature has a negative effect, resulting in decreasing photosynthesis.
1.5.3 Conductivity
Conductivity or salinity could play essential role in determining plankton assemblages of saline habitats. Different sensitivity of competing species can be the key factor in often suddenly changing saline waterbodies. Conductivity can control and selectively favour species via ionic stress or by affecting biochemical processes like photosynthesis and also the growth of a species (Kebede 1997, Hasegawa et al. 2000, Munns 2002, Sudhir and Murthy 2004, Lázár et al. 2015, Lengyel et al. 2015, 2020). There are some well-known saline species, e.g. Dunaliella salina which can dominate the phytoplankton if the salinity exceed ~70 g L-1 (Gómez and González 2005, Liu et al. 2012, Padisák and Naselli-Flores 2021), and diatoms can be prominent in saline- alkaline ponds (Lázár et al. 2015, Lengyel et al. 2015, 2020).
The effect of conductivity, moreover the tolerance for its changes could be a key to understand unexpected changes in phytoplankton assemblages. As the empirical study by Krienitz (2018) suggested and confirmed by experimental studies (Kebede 1997), conductivity seems to be the key factor in determining the phytoplankton in East African alkaline saline lakes, and trough the phytoplankton also the overall ecosystem functions in these lakes.
19
2 Main objectives
The basic process of photosynthesis is similar in higher plats, algae and cyanobacteria. A further similarity is its very strong dependence on the various environmental factors. General trends of the different factors’ effects can be described. Positive correlation between the temperature, light intensity and the photosynthetic activity is well studied, however this effect can be very species specific. Another important environmental factor, especially in saline habitats is conductivity. Also numerous studies has been discussed the effect of salinity and the changes of this factor on the different life processes of algae and cyanobacteria species.
The aim of this dissertation was to study the effect of some selected environmental factors (temperature, light intensity, conductivity) on the growth and photosynthesis of fresh- and saline alkaline water species under laboratory conditions using cross environmental scales.
Accordingly, the main objectives were the following:
i. to examine the effect of temperature and light intensity on the photosynthetic activity of different algal and cyanobacterial species to reveal the species specific differences with a special focus on a rapidly spreading group: the cyanobacteria;
ii. using the previously determined photosynthetic parameter to estimate the plasticity of the species along environmental scales with applying literary methods or develop a new one;
iii. to examine the ecophysiology of two East African strains (Limnospira fusiformis and Picocystis salinarum) under wide ranges of both temperature, light intensity and conductivity and also to reveal the effect of fast conductivity changes on the coexistence of the species.
20
3 Temperature and light intensity dependent photosynthetic characteristics of some algae and cyanobacteria
13.1 Introduction
Algae, including cyanobacteria, are a very diverse group of photosynthetic microorganisms concerning both their size and morphology. As primary producers, phytoplankton species play an essential role in the aquatic food webs, and are responsible for a great part, about a half, of the primary production of the Earth (Falkowski 1994, Field et al. 1998, Naselli-Flores et al.
2021). Phytoplankton communities are controlled by numerous environmental factors. Glibert (2016) listed twelve of them as most important ones: relative preference for differently oxidized nitrogen forms, availability of inorganic nitrogen and phosphorus, adaptation to different light intensity or being autotrophic/mixotrophic, cell motility, environmental turbulence, pigmentation quality, temperature, cell size, growth rate, production of toxins or reactive oxygen species, and the ecological strategy of the species. Some of these, besides their direct effect, can also affect indirectly the abundance and composition of the phytoplankton through e.g. the modification of the stratification pattern of e.g. dissolved oxygen in lakes (Winder and Sommer 2012, Selmeczy et al. 2018).
Temperature is one of the most important environmental factors that can affect phytoplankton as well benthic algal communities (Adrian et al., 2009, Winder & Sommer, 2012, Winder et al., 2012). Changes in temperature, especially the warming strongly affects the biological processes both in terrestrial and aquatic ecosystems either directly or via changing the physical and chemical environment (IPCC 2007, Paerl and Paul 2012, Winder and Sommer 2012). Moreover, temperature can selectively favour species: warming of the aquatic ecosystem could be more advantageous for some cyanobacteria species, rather than for members of any other phyla (Robarts and Zohary 1987, Coles and Jones 2000, Vona et al. 2004, Butterwick et al. 2005, Watkinson et al. 2005, Kosten et al. 2012, Üveges et al. 2012, Singh and Singh 2015, 2020, Yan et al. 2020).
1 Parts of this chapter were published in the following papers:
Pálmai, T., Selmeczy, G.B., Szabó, B., G.-Tóth, L. & Padisák, J. 2016. A Microcystis flos-aquae fotoszintetikus aktivitása a Balaton keleti medencéjében 2015 nyarán Photosynthetic activity of Microcystis flos-aquae in the eastern basin of Lake Balaton in the summer of 2015. Hidrológiai Közlöny, 96:75–8.
Pálmai, T., Szabó, B., Hubai, K., Padisák, J. (2018). Photosynthetic performance of two freshwater red algal species. Acta Botanica Croatica, 77: 135-140. DOI:10.2478/botcro-2018-0010
Pálmai, T., Szabó, B., Kotut, K., Krienitz, L. & Padisák, J. 2020. Ecophysiology of a successful phytoplankton competitor in the African flamingo lakes: the green alga Picocystis salinarum (Picocystophyceae). Journal of Applied Phycology, 32:1813–1825. DOI: 10.1007/s10811-020-02092-6.
21
Temperature have huge effect on the ecosystem via affecting life processes of the microorganisms. It is already valid in case of short-lived organisms such as phytoplankton.
Species with short generation time are able to respond rapidly to the environmental changes.
Consequently, any change in the physical and chemical environment (e.g. pollution, drier or wetter seasons) can substantially change not only the flora but also the fauna (Naselli-Flores and Barone 2009). Drastic shifts in phytoplankton composition can crash a food web (especially if it is an extremely short and special “web” e.g. Krienitz et al., 2016). The short lifetime of phytoplankton species makes it easier to examine the effect of the environmental factors on their life processes (Padisák 1998).
Temperature has major impact on photosynthesis. Typically, the rate of photosynthesis increase progressively along a range of temperature (Collins and Boylen 1982, Davison 1991, Padisák 2004, Falkowski and Raven 2007, Lengyel et al. 2015, 2020). Despite general trends of the effect could be described, the response of the species could differ (Coles and Jones 2000, Vona et al. 2004, Butterwick et al. 2005, Staehr and Birkeland 2006, Kosten et al. 2012, Paerl and Paul 2012, Sommer et al. 2012, Üveges et al. 2012, Lengyel et al. 2015, Singh and Singh 2015).
An also very important environmental factor that affects photosynthesis is light intensity.
The process of photosynthesis is well studied, and there are several equations to model its light intensity dependence (Jassby and Platt 1976, Platt and Jassby 1976, Platt et al. 1980, Wetzel and Likens 2000). The optimal light intensity for different planktic groups could differ:
Bacillariophycae and cyanobacteria usually are able to tolerate low light levels (10-240 µmol m-2 s-1) and some of them can grow at 5-10 µmol m-2 s-1, in contrast the green algae are able to utilize higher range of light (100-500 µmol m-2 s-1), but there are counterexamples too (e.g.
Microcystis species) (Padisák 2004).
Cyanobacteria are the oldest known oxygen producers, with an age about 2.4 billion years (Shih and Matzke 2013). Nowadays, they have a broad geographical distribution, and can be found from the tropical to the polar regions. Cyanobacterial species not only occur in a wide range of geographical sites, but also dominate various benthic and planktic communities. They can form dense and sometimes also toxic blooms in both marine and freshwater environments (Whitton 2012). The global expansion of toxic (and also non-toxic) cyanobacteria has been a real threat nowadays. Several studies were aimed at describing this threat and also suggested the possible reason of this expansion (Paerl and Paul 2012, Sukenik et al. 2015, Huisman et al.
2018). Though there are several cyanobacteria which have high temperature optima,
22
unexpected occurrences of highly adaptive representatives of this phylum (Padisák 1997, Üveges et al. 2012) were also described. The so called “Blue-Green Algal Paradox” of Paerl (1988) describes it well: most of the cyanobacteria are sensitive to environmental changes, but cyanobacteria, as a group is adapted to wide range of environmental conditions including of environmental extremes (Paerl 1988, Padisák and Reynolds 1998).
Phytoplankton of inland fresh and saline alkaline waters usually dominated by species of various phyla, but the global expansion of cyanobacteria can affect these ecosystems, trophic cascades and geochemical cycles (Sukenik et al. 2015).
Photosynthetic measurements along wide ranges of both temperature and light intensity were carried out to reveal the differences between the temperature and also the light intensity dependence of the photosynthetic activity of planktic species with a special focus on cyanobacterial species.
23 3.2 Materials and methods
3.2.1 Isolation and cultivation
For photosynthetic measurements different types of strains were used. Beside own isolates, strains from culture collections were also used as well as natural samples dominated with certain target species. If a bloom was dominated by a single species (more than 90% of the biomass was provided by a single species) the sample was handled as monoculture. Other species were isolated from different habitats with single cell isolation method. Successfully isolated strains were kept in Erlenmeyer-flasks (0.5-5 L) at 19±1°C and 40 µmol photons m-2 s-1 in the Alga Culturing Laboratory of the Department of Limnology (University of Pannonia, Veszprém).
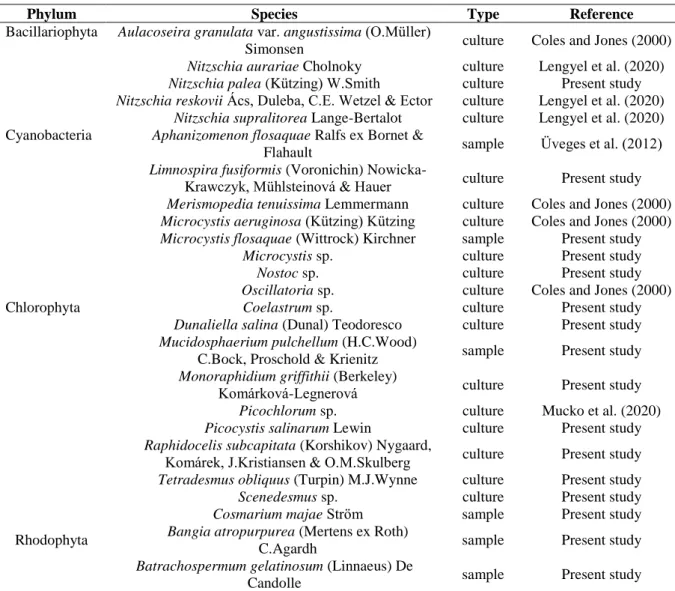
Growth was followed by OD measurements at 750 nm with a Metertech SP-8001 UV-VIS spectrophotometer from a subsample of the homogenised culture for the species which forms homogeneous suspension and/or by microscopic investigation in the case of the filamentous species. Photosynthetic activities of sixteen species with different origin were measured. Their origin, type and the culturing medium is given in Appendix 1. The names of the species correspond to those available in the database of algaebase.com on 03.05.2020.
3.2.2 Determination of photosynthetic activities
The photosynthetic characteristics of the species were examined over a wide range of temperature and light intensities in order to determine the optima of the species and also of their temperature and light intensity tolerance ranges.
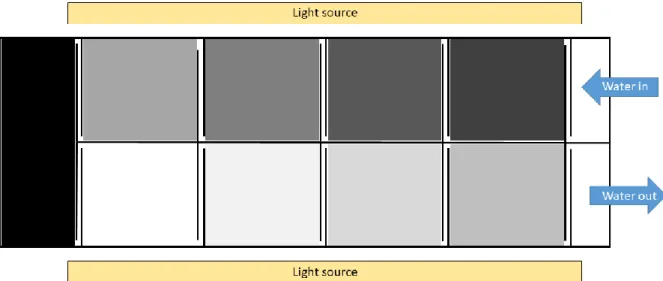
Figure 2 Graphical representation of the photosynthetron (top view): solid lines represent the glass walls and dotted lines represent the mirror walls of the cells of the aquarium system. A circulating water bath (Neslab RTE-211) is responsible for the specific temperature of the instrument via circulating distilled water in the photosynthetron. PAR is provided by daylight tubes (Tungsram F74), different light intensity is set with the number of the used light tubes and the number of used shielding foil.
24
Measurements were carried out in a special incubation system, the photosynthetron (Üveges et al. 2011). The photosynthetron (Figure 2) is an aquarium system with nine measuring cells filled up with distilled water. Specific measuring temperatures were provided by circulating the distilled water in the instrument with a circulating water bath (Neslab RTE- 211) in the temperature range of 5 - 45°C. The nine measuring cells (Figure 2) provide different light intensities; the available light intensity sets range between 0 and 2200 µmol photons m-2 s-1. Light intensity depends on three factors: number of used light tubes, number of used covering foils and the age of the light tubes. Due to the ageing of the tubes, light intensities varied between the measurements, but fitting exponential curves with the measuring data eliminates the effect of these differences. PAR was provided by daylight tubes (Tungsram F74) and light intensities were measured with a LI 1400 DataLogger (LI-COR) equipped with a spherical (4π) quantum sensor (US-SQS/L, Heinz Walz GmbH).
Measurements were performed with mass cultures in their exponential growth phases.
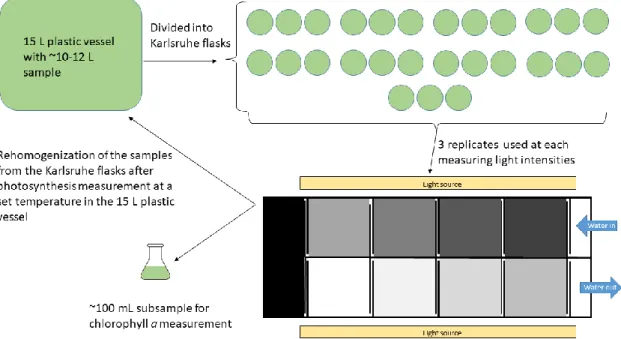
Prior to carrying out the photosynthesis measurements, cultures from the culturing Erlenmeyer- flasks and fresh medium were placed in a plastic chamber with an approximate volume of 15 L (Figure 3). The sample requirement of the measurement depends on the number of applied light intensities and on the number of replicates. If nine light intensities were applied with three replicate of 250 mL Karlsruhe-flasks in each measuring cells, the net sample requirement of the measurement is 6750 mL. Calculating with the loss during the filling of the flasks and during rehomogenization the real sample need of a measurement is about 10 L.
After the homogenization of the sample in the 15 L plastic chamber, the culture was divided into Karlsruhe-flasks, with an approximate volume of 250 mL, (this type of flasks were used for the measurements in order to avoid gas exchange with the environment) in three replicates at each light intensity (in each measuring cells of the photosynthetron).
Photosynthetic measurements were started at the lowest measuring temperature, it was usually 5°C, with a 1-h pre-incubation in dark. Photosynthetic activity of the samples was determined by measuring dissolved oxygen (DO) concentration with an IntelliCAL™ LDO101 sensor (Hach Lange). DO was measured at the beginning of the experiment (t= 0 h), as well as after 1 hour (t=1 h) and if necessary after 2 hours (t= 2 h) (depending on the density of the culture).
After the measurement at 5°C, the samples were poured back, mixed and homogenized in the 15 L plastic chamber, then divided into the Karlsruhe-flasks again. The temperature of the photosynthetron was raised up to 10°C and after the 1-h pre-incubation at 10°C, the DO concentration was measured again at t= 0 h and t= 1 h (and if it was necessary at t= 2 h). This
25
process was repeated at different measuring temperatures (15–20–25–30–35–40–45 °C).
Followed the photosynthesis measurement at each temperature, chlorophyll a concentration was measured in ethanol extracts according to MSZ ISO 10260:1993 from a subsample (~100 mL) of the homogenized culture. Measuring temperature range could differ between species:
photosynthetic activity of the species was measured until remarkable decrease was observed, usually measurements were carried out in the temperature range of 5-40°C.
Figure 3 Graphical illustration of the experimental design of the photosynthesis measurements
A different method was used for red algae since they cannot form a homogeneous suspension. Red algal samples were filtered onto 1.2 µm pore size GFC filters, and then their fresh weight was gravimetrically measured with an 0.1 mg accuracy. Samples with known fresh weights were placed into Karlsruhe-flasks, which were then filled with freshly filtered (0.4 µm pore size mixed cellulose-ester membrane filter) stream or lake water before each measurement.
Then the same photosynthetic activity measuring procedure was performed as for the other species, except refilling between temperature changes. In case of red algae, the known fresh weight pieces were randomly exchanged between cells with the different light intensity.
Carbon uptake, respiration, gross and net photosynthesis were determined according to Wetzel and Likens (2000) with the following equations:
𝑅𝑒𝑠𝑝𝑖𝑟𝑎𝑡𝑜𝑟𝑦 𝑎𝑐𝑡𝑖𝑣𝑖𝑡𝑦 = 𝐼𝐵 − 𝐷𝐵
𝑁𝑒𝑡 𝑝ℎ𝑜𝑡𝑜𝑠𝑦𝑛𝑡ℎ𝑒𝑡𝑖𝑐 𝑎𝑐𝑡𝑖𝑣𝑖𝑡𝑦 = 𝐿𝐵 − 𝐼𝐵
26
𝐺𝑟𝑜𝑠𝑠 𝑝ℎ𝑜𝑡𝑜𝑠𝑦𝑛𝑡ℎ𝑒𝑡𝑖𝑐 𝑎𝑐𝑡𝑖𝑣𝑖𝑡𝑦 = (𝐿𝐵 − 𝐼𝐵) + (𝐼𝐵 − 𝐷𝐵),
where IB is the initial DO concentration at t= 0 h, DB is the DO concentration in the dark bottles at t= 1 h and LB is the DO concentration in the lighted bottles at t= 1 h.
To convert DO to carbon uptake, the DO must be multiplied by the carbon: oxygen mole ratio (12mg C/32mg O2= 0.375) (Wetzel and Likens 2000), then the following equations were used:
𝑅𝑒𝑠𝑝𝑖𝑟𝑎𝑡𝑖𝑜𝑛 ( 𝑚𝑔 𝐶 𝑚−3 ℎ−1) =(𝐼𝐵 − 𝐷𝐵) × 𝑅𝑄 × 1000 × 0.375 𝑡
where t is the time of incubation, RQ is the respiratory quotient (RQ = 1.0 according to Wetzel and Likens (2000)),
𝑁𝑒𝑡 𝑝ℎ𝑜𝑡𝑜𝑠𝑦𝑛𝑡ℎ𝑒𝑡𝑖𝑐 𝑎𝑐𝑡𝑖𝑣𝑖𝑡𝑦 ( 𝑚𝑔 𝐶 𝑚−3 ℎ−1) =(𝐿𝐵 − 𝐼𝐵) × 1000 × 0.375 𝑃𝑄 × 𝑡
where, t is the time of incubation, PQ is the photosynthetic quotient (PQ = 1.2 according to Wetzel and Likens (2000))
𝐺𝑟𝑜𝑠𝑠 𝑝ℎ𝑜𝑡𝑜𝑠𝑦𝑛𝑡ℎ𝑒𝑡𝑖𝑐 𝑎𝑐𝑡𝑖𝑣𝑖𝑡𝑦 ( 𝑚𝑔 𝐶 𝑚−3 ℎ−1) =(𝐿𝐵 − 𝐷𝐵) × 1000 × 0.375 𝑃𝑄 × 𝑡
where, t is the time of incubation, PQ is the photosynthetic quotient (PQ = 1.2 according to Wetzel and Likens (2000)).
To make the results of different species comparable the gross photosynthetic activities were divided by the chlorophyll a concentration of the culture, which resulted in the final unit of µgC µgChla-1 h-1.
Two equations were used to determine the photosynthetic parameters of the species: in the absence of photoinhibition, photosynthetic parameters were calculated according to Webb et al. (1974):
𝑃 = 𝑃𝑚𝑎𝑥𝐵 (1 − 𝑒
−𝐼 𝐼𝑘)
𝛼 =𝑃𝑚𝑎𝑥𝐵
𝐼𝑘 ,
Where P is the measured photosynthetic activity, PBmax is the biomass specific maximal photosynthetic activity, I is the used light intensity and Ik is the saturation onset parameter and α is the initial slope of the P-I curve which represents the light utilization.
27
When photoinhibition was observed, β (photoinhibition parameter) and the other parameters were calculated according to Platt et al. (1980):
𝑃 = 𝑃𝑚𝑎𝑥𝐵 (1 − 𝑒
−𝐼
𝐼𝑘) (1 − 𝑒
−𝛽𝐼 𝑃𝑚𝑎𝑥𝐵 )
Compensation light intensities were calculated according to:
𝐼𝑐 =
𝑃𝑠∗ 𝑙𝑛 (1 −𝑅𝐵 𝑃𝑠)
−𝛼
where Ic is the light intensity at which photosynthetic production becomes equal to respiration, Ps is the maximal photosynthetic activity obtained in the absence of photoinhibition; without photoinhibition it is equal to PBmax.
To calculate the optimum temperature for the different photosynthetic parameters of the species, Gaussian and exponential curves were fitted. All curves were fitted using GraFit software (Leatherbarrow, 2009).
3.2.3 Statistical analysis
To determine whether the temperature and light intensity treatments had a statistically significant effect on the photosynthetic activity of the selected species, and also to reveal if there are any differences between the photosynthetic activity of the different species and phyla, multiway analysis of variance (ANOVA) was carried out. Tukey’s post hoc multiple comparison tests were conducted between each pair of variable. Statistical analyses were carried out using R statistical computing environment (R Core Team 2018).
28 3.3 Results
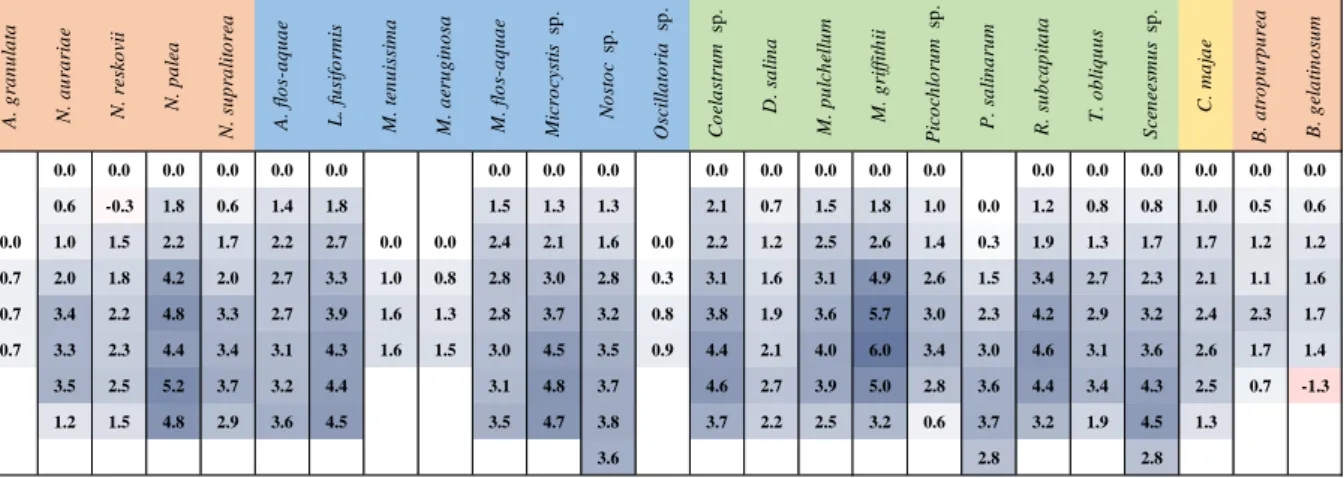
As the effect of temperature and light intensity is in the focus of this chapter, the presentation of the results of the photosynthetic measurements also focuses on the parameters which are closely related to these factors: PBmax and Ik values are presented in this chapter but all the calculated variables can be found in Appendix 3. The results of the photosynthetic measurements of Limnospira fusiformis and Picocystis salinarum are presented in Chapter 5.
3.3.1 Bacillariophyta
Nitzschia palea (Kützing) W. Smith was the only examined Bacillariophyta. Photosynthetic activity of N. palea was examined between 5 and 40°C. In this temperature range the PBmax of the species increased with the increase of temperature (all of the photosynthetic parameters are given in Appendix 3 for all sixteen species) with a maximum at 35°C and then slight decrease was observed in the PBmax of N. palea. PBmax values of the species varied between 0.033 and 1.046 µg C µg Chl a-1 h-1. The Ps values of the species followed similar trend than that of PBmax. Ik values of N. palea varied between 9.6 and 172.2 µmol photons m-2 s-1 and reached maximum value at 25°C. Biomass specific respiration of N. palea increased with increasing temperature and following a maximum at 35°C, the rate of respiration began to decrease. RB values ranged between 0.020 and 0.807 µg C µg Chl a-1 h-1.
3.3.2 Cyanobacteria
Photosynthetic activities of three cyanobacterial species were examined, these species are namely Microcystis flosaquae (Wittrock) Kirchner, Microcystis sp. and Nostoc sp. The applied temperature range for the two Microcystis species was 5-40°C and for Nostoc sp. was 5-45°C.
The PBmax values of the species showed high degree of diversity: lowest PBmax values were calculated for Nostoc sp., the maximum value was 2.015 µg C µg Chl a-1 h-1 at 40°C. Also huge differences were found between the two Microcystis species: PBmax values M. flosaquae ranged between 0.769 µg C µg Chl a-1 h-1 and 9.513 µg C µg Chl a-1 h-1 in contrast those of Microcystis sp. which had PBmax values between 0.117 µg C µg Chl a-1 h-1 and 3.218 µg C µg Chl a-1 h-1. Also huge differences were found between the temperature optima of the species: Microcystis sp. and Nostoc sp. had temperature optimum about 37-38°C in contrast, the theoretical temperature optimum of the PBmax values of M. flosaquae is over 50°C.
The differences between the photoadaptation parameters of the examined species were similar to that was observed in the case of PBmax. Microcystis sp. and Nostoc sp. had similar Ik
29
values, their highest values were 127.2 µmol photons m-2 s-1 and 121.7 µmol photons m-2 s-1 in contrast the highest Ik value of M. flosaquae was 619.6 µmol photons m-2 s-1.
3.3.3 Chlorophyta
The photosynthetic activity of seven Chlorophyta were examined usually in the 5-40°C temperature range. There were two exceptions: the applied method was unable to detect photosynthetic activity of Monoraphidium griffithii (Berkeley) Komárková-Legnerová at 5°C, therefore the applied temperature range was 10-40°C. The other species with different temperature treatment is Scenedesmus sp., the used temperature range was 5-45°C.
The examined species can be divided into three groups depending on their PBmax: there species with low PBmax, namely Monoraphidium griffithii and Raphidocelis subcapitata (Korshikov) Nygaard, Komárek, J. Kristiansen & O.M. Skulberg. The highest PBmax of these species is 0.565 µg C µg Chl a-1 h-1 and 0.566 µg C µg Chl a-1 h-1. The second group contains species with medium level of PBmax, these are Mucidosphaerium pulchellum (H.C. Wood) C.
Bock, Proschold & Krienitz, Tetradesmus obliquus (Turpin) M.J. Wynne and Scenedesmus sp.
The PBmax of these species can be found in the 2-4 µg C µg Chl a-1 h-1 range. The third group contains Coelastrum sp. and Dunaliella salina (Dunal) Teodoresco which have the highest PBmax among the examined Chlorophyta species (5.353 µg C µg Chl a-1 h-1 and 5.404 µg C µg Chl a-1 h-1). The temperature optima of the species’ PBmax was in the 30±2°C temperature range with two exceptions, the temperature optimum of D. salina was 37.2±5.4 and of Scenedesmus sp. was 36.0±1.3.
The photoadaptation parameters of the Chlorophyta species increased with increasing temperature until reaching a maximum in the 30-40°C range, then decrease was observed in all cases. Remarkable differences were found in the Ik values of the chlorophyta species: lowest values were calculated for R. subcapitata and M. griffithii (159.0 µmol photons m-2 s-1 and 100.8 µmol photons m-2 s-1). Examined Chlorophyta species with highest Ik values in the 200- 300 µmol photons m-2 s-1 range are Coelastrum sp., D. salina and T. obliquus. Highest Ik
maxima were calculated for M. pulchellum (434.8 µmol photons m-2 s-1) and Scenedesmus sp.
(327.2 µmol photons m-2 s-1).
3.3.4 Charophyta
The photosynthetic activity of the only examined Charophyta species, Cosmarium majae Ström, was examined at 8 different temperatures between 5 and 40°C. Highest PBmax was observed at 30°C and the calculated temperature optimum is 27.8°C. According to the observed high level of photoinhibition, remarkable differences were found between the Ps and PBmax
30
values of the species. The biggest difference was higher than 20% at 35°C. High and increasing Ik values were found according to the increasing temperature, remarkable decrease in the photoadaptation parameter was observed only at the highest (40°C) measuring temperature.
Biomass specific dark respiration of the species increased with increasing temperature and reached a plateau above 30°C.
3.3.5 Rhodophyta
Photosynthetic activities of two red algae were examined. The biomass specific maximal production (PBmax) of the species increased parallel with the temperature. The increase of the PBmax was about 75-80% of both species and both had highest values at 25 °C. A remarkable difference was found between the levels of the species’ PBmax. The highest PBmax of Batrachospermum was 0.683 µg C µg FW-1 h-1 in contrast to Bangia, that exhibited a photosynthetic production higher by an order of magnitude (PBmax = 8.171 µg C µg FW-1 h-1).
At 35 °C, the highest experimental temperature, both species’ photosynthetic activity dropped remarkably.
Photoadaptation parameters (Ik) of Bangia varied between 61.6 and 275.1 µmol m-2 s-1. It increased with the increasing temperature till 25 °C. At higher temperatures a slow decrease was observed in the Ik values. Ik values of Batrachospermum were lower and ranged from 32 to 165.8 µmol m-2 s-1. The highest value was found at 30 °C.
Table 1 Effect of temperature, light intensity treatments phyla and species on the photosynthetic activity of the examined 16 species based on the results of multiway ANOVA (Df = degrees of freedom, F = F-value, P = P- value)
Df F P
Temperature 8 174.56 <0.001
Light intensity 8 148.01 <0.001
Phylum 3 391.53 <0.001
Species 10 185.17 <0.001
Residuals 880
3.3.6 Statistical analysis
Multiway ANOVA revealed that both temperature and light intensity have significant effect on the photosynthetic activity of the species. The statistical analysis showed that there are significant differences between the photosynthetic activity of the species, and also between the four examined phyla (Table 1). Tukey’s post hoc multiple comparison tests revealed significant differences between almost all phyla. No significant differences were found among phyla
31
except between the photosynthetic activity of the Cyanobacteria and the Chlorophyta species.
Results of the comparison are summarized in Appendix 2.
32 3.4 Discussion
The photosynthetic activity of algae and cyanobacterial species is affected by several environmental factors. Temperature and light intensity are two of the major factors (Padisák 2004, Winder and Sommer 2012, Glibert 2016); these were examined in this research.
There is a positive relationship between temperature and the life process of algae and cyanobacterial species, and more specifically between temperature and photosynthesis. Several experimental studies confirmed this relationship, both theoretically and experimentally, however, there are less physiological studies that were carried out on a wide range of an environmental factor, like temperature or light intensity or on a number of species (cf. Dauta 1982, Coles and Jones 2000).
The previously described positive relationship between temperature, light intensity and the examined species’ photosynthetic activity is confirmed (Collins and Boylen 1982, Dauta 1982, Coles and Jones 2000, Padisák 2004, Vona et al. 2004, Üveges et al. 2012, Lázár et al.
2015, Lengyel et al. 2015, 2020). However, the extension of the measuring range provides additional information about tolerance ranges of the species as well as about the run of the reaction norms along a wide range of the environmental variable. Unfortunately, studies carried out on a wide range of a variable are rare (Collins and Boylen 1982, Üveges et al. 2012, Lengyel et al. 2015, 2019), because often there is a reason for a special focus which reduces this range.
From biotechnological point of view finding of optima are the main target of such measurements that narrows the variable ranges. In the contrary, geographic or environmental distribution ranges of a species are determined by the tolerance of sub- or supraoptimal values and therefore extension of the variable ranges are essential from ecological point of view.
Significant differences were found between the different phyla’s photosynthetic activity, however the strength of statistical comparison is reduced by the different number of the examined species and also by the different units used. Comparison fully acceptable only in the case of the Cyanobacteria and Chlorophyta species, the Rhodophyta species been excluded from the analysis because of the different unit, and since there is only one diatom and also one Charophyta species, the comparison of their phyla is inappropriate.
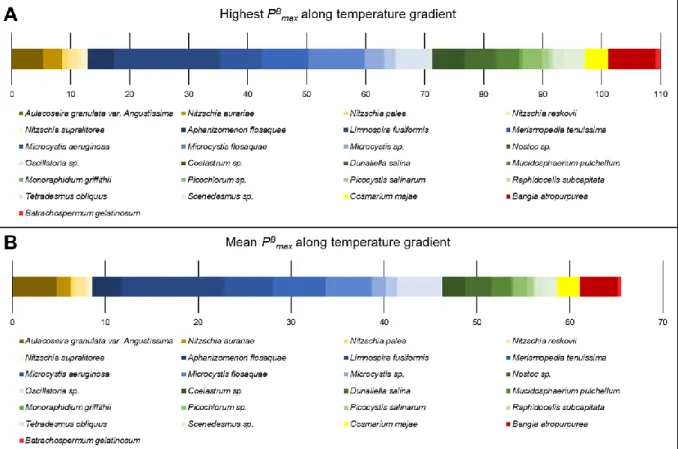
The statistical analysis did not reveal significant differences between Cyanobacteria and Chlorophyta species, but less number of examined cyanobacterial species exhibited higher mean and maximum PBmax values cumulatively than the examined Chlorophyta species (Figure 4). Statistical analysis also weakened by the overlapping of the different species’ data according