Applied Catalysis A, General 621 (2021) 118174
Available online 29 April 2021
0926-860X/© 2021 The Author(s). Published by Elsevier B.V. This is an open access article under the CC BY-NC-ND license
(http://creativecommons.org/licenses/by-nc-nd/4.0/).
Strong impact of indium promoter on Ni/Al 2 O 3 and Ni/CeO 2 -Al 2 O 3 catalysts used in dry reforming of methane
Anita Horv ´ ath
a,*, Mikl ´ os N ´ emeth
a, Andrea Beck
a, Bogl ´ arka Mar ´ oti
b, Gy orgy S ¨ ´ afr ´ an
c, Giuseppe Pantaleo
d, Leonarda Francesca Liotta
d, Anna Maria Venezia
d, Valeria La Parola
daCentre for Energy Research, Institute for Energy Security and Environmental Safety, Department of Surface Chemistry and Catalysis, Konkoly-Thege M. Street 29-33, H- 1121, Budapest, Hungary
bCentre for Energy Research, Institute for Energy Security and Environmental Safety, Nuclear Analysis and Radiography Department, Konkoly-Thege M. Street 29-33, H- 1121, Budapest, Hungary
cCentre for Energy Research, Institute of Technical Physics and Materials Science, Thin Film Physics Department, Konkoly-Thege M. Street 29-33, H-1121, Budapest, Hungary
dInstitute for the Study of Nanostructured Materials, National Research Council (ISMN -CNR), Via Ugo La Malfa 153, 90146, Palermo, Italy
A R T I C L E I N F O Keywords:
Methane dry reforming Ni/Al2O3
Indium Ceria Coke formation
A B S T R A C T
Herein, the promotion effect of only 0.3 wt% indium on 3% Ni/Al2O3 and 3% Ni/CeO2-Al2O3 catalysts prepared by deposition-precipitation over a commercial alumina and on the CeO2-modified support was studied. Catalyst characterization by XRD, TPR, XPS, TEM, CO-DRIFTS was performed. The catalytic properties were investigated and coke formation was analyzed under temperature ramped CH4-decomposition and in Dry Reforming of Methane (DRM). The unique impact of indium was compared to the well-known effects of ceria additive. The carbon deposition on Ni/Al2O3 blocking the reactor could be only delayed due to ceria on Ni/CeO2-Al2O3, while NiIn/Al2O3 was able to maintain the activity in DRM. Indium modifier acting in parallel with ceria over NiIn/
CeO2-Al2O3 determined the least coking, but the least catalytic activity. The results were discussed in terms of double role of In, acting as a ceria modifier, upgrading its oxidative properties and as a metal modifier, getting alloyed with Ni.
1. Introduction
The growing energy needs of mankind stimulate the utilization of unconventional methane resources such as shale gas, methane hydrates and renewable biogas. Furthermore, environmental regulations world- wide focus on the effective decrease of greenhouse gases in the atmo- sphere such as methane and CO2. Combining these two important issues, methane conversion using CO2 oxidant seems to be a sustainable way of getting value-added products from these abundant and relatively cheap starting materials. The so-called dry reforming reaction converts methane/biogas with CO2 content and yields synthesis gas (DRM: CO2 + CH4 ⇌ 2 CO +2 H2). The synthesis gas is used for the production of value-added products such as methanol, acetic acid and hydrocarbons leading to end products such as solvents, polymers, synthetic fuels, fertilizers, etc. We should note that “dry” is used in contrast to the well- established industrial counterpart, the “steam” reforming of methane (SRM: H2O +CH4 ⇌ CO +3H2), which is the major hydrogen/syngas
production route worldwide. Beside its extremely high investment and operational costs, if hydrocarbon synthesis is aimed, the H2/CO~3 ratio must be reduced. On the other hand, the CO-rich syngas of dry reforming represents a perfect source for the production of oxygenates or dimethyl ether [1]. The main disadvantage of catalytic DRM is that surface carbon easily accumulates in the form of filamentous or graphitic coke over the supported metal catalyst and this may lead to severe deactivation and the blockage of the reactor.
According to a very simple scenario of the DRM reaction steps, the methane dissociates on the metal surface to CHx (x =0–3) species, while CO2 dissociates also on the metal or it is adsorbed and activated on the oxygen vacancies of the support at the metal-support interface, more- over, it can adsorb on remote support sites and decompose by hydrogen spillover from the metal. Then, active CHx species react with Os or OHs
species and decompose finally to H2 and CO [2]. The surface CHx species can polymerize and lead to inactive carbon, viz. filamentous or encap- sulating type graphitic coke that eventually kill the catalyst. This
* Corresponding author.
E-mail address: horvath.anita@energia.mta.hu (A. Horv´ath).
Contents lists available at ScienceDirect
Applied Catalysis A, General
journal homepage: www.elsevier.com/locate/apcata
https://doi.org/10.1016/j.apcata.2021.118174
Received 19 February 2021; Received in revised form 6 April 2021; Accepted 22 April 2021
inactive carbon can potentially arise from methane decomposition and Boudouard reactions that compete for similar catalytic sites [3,4].
The cheapest and most perspective metal for methane dry reforming is nickel, however, it is prone to deactivation due to coke formation. The two general ways to reduce catalyst coking are i) the proper choice of support with mobile surface/subsurface oxygen (to boost carbon removal) and good CO2 activation ability and ii) alloying nickel with a second metal [5]. As methane conversion is significant only above 500− 600 ◦C, oxide supports with high specific surface area and good thermal stability are required, such as alumina, for example. As for the oxygen storage/release ability of the support, ceria component is an excellent and well-known choice: depending on the atmosphere (reducing or oxidizing), release or incorporation of oxygen species combined with Ce4+/Ce3+transformation can happen, and the mobile oxygen species can spill over to the neighboring metal sites where they gasify the carbon precursors [6]. The structure and extension of the metal-ceria interface and the proportion of Ce3+sites play a crucial role in the activation of reactants and the gasification of active carbon spe- cies [7,8]. Oxygen transfer along the surface of CeO2 support is fast but not selective for carbon oxidation only and so hydrogen species located at the proximity of the metal-support interface can be oxidized as well – forming water. This exhibits itself as a lower H2 selectivity in dry reforming [9].
As for the metal modification, nickel must be modified, because it can form nickel carbide easily that is the starting point of nanotubes and graphitic layers. For economic reasons, non-noble metal modifiers are highly recommended. It was discovered in our laboratory that coke formation can be retarded by indium in close vicinity of nickel or rather by alloying with nickel [10]. The application of indium in catalysis is rather rare, and mostly the role of indium oxide in hydro- genation/dehydrogenation reactions is discussed [11–14]. Metallic in- dium in In/SiO2 was found active in the direct dehydrogenative conversion of methane to ethane above 750 ◦C [15]. The combination of nickel with indium and alumina over SiO2 provided a selective methanol producing catalyst via CO2 hydrogenation [16]. During the electro- chemical reduction of CO2 [17] indium was found in partially oxidized state.
Our coke-resistant 3%Ni2%In/SiO2 catalyst contained less than 5 nm size bimetallic NiIn particles [10] giving a linear carbonyl band at 2013 cm−1 during CO chemisorption (DRIFTS) attributed to CO bonded on Ni atoms surrounded by In neighbors [18]. Methane pulse experi- ments on this catalyst revealed that the complete CH4 dissociation was hindered [19].
Based on such dramatic effect of indium it seemed straightforward to test other supports such as alumina or alumina modified by ceria (that is often applied in reforming reactions for the above mentioned reasons [8, 20–23]) as the next generation of NiIn catalysts but with significantly lower indium content (~0.3 wt%). The ceria content of the mixed oxide was set reasonable low (~8 wt%) to induce as many as possible defect sites [21]. In the present work, the two different coke-reducing strate- gies were unified: i) we modified the thermostable support with defec- tive, partially reducible cerium oxide in a low concentration and ii) doped the metal catalyst with minute amount of indium. We anticipated that the indium modifier will play a dual role as it can be alloyed with nickel and included in the supporting Al2O3 or CeO2 matrix deliberately inducing oxide defects. These possibilities were analyzed in the present manuscript. Catalysts were investigated by TPR, BET, TEM, XPS and CO chemisorption DRIFTS experiments, while activity of the samples was tested in CH4 decomposition and dry reforming reaction followed by coke quantification. The reasons for activity changes and coking prop- erties were explained based on the results.
2. Experimental 2.1. Catalyst preparation
The ceria-modified alumina (CeO2-Al2O3) support was prepared by wet impregnation of aqueous Ce(NO3)3*6H2O (Aldrich) solution on commercial alumina (Aldrich, SSA =175 m2 g-1; Vp =0.27 cm3 g−1) in order to have a final composition of 8.6 wt% CeO2 (or 7 wt% Ce) on Al2O3. Once dry, the powder was calcined at 500 ◦C for 2 h in static air.
The parent Al2O3 and the mixed CeO2-Al2O3 support are referred as Al and CeAl from now on. Monometallic nickel and bimetallic nickel- indium catalysts were prepared by deposition-precipitation method on both supports (resulting Ni_Al, Ni_CeAl, NiIn_Al and NiIn_CeAl samples).
The target metal loadings were 3 wt% Ni and 0.25 wt% In (nominal Ni/
In molar ratio =24). 1.5 g support and 2.5 g urea were suspended in 155 mL ultrapure water and stirred at room temperature until urea was dissolved. Then proper volume of 0.2 M nickel(II)nitrate (Aldrich) and – when needed – calculated amount of 0.06 M indium(III)chloride (Aldrich) were added. Then the temperature was ramped to 90 ◦C with 10 ◦C/min and the mixture was kept there for 3 h under stirring (final pH
~ 8.5). After cooling to room temperature, the sample underwent 3 cycles of centrifugation and washing steps. Catalyst samples were dried in an oven at 80 ◦C for 1 day, then calcined at 650 ◦C for 2 h in air flow (ex situ calcination). The calcined samples were further reduced ex situ at 750 ◦C/1 h in H2 before DRIFTS, TEM and XPS measurements. This pretreatment is called ex situ reduction from now on.
2.2. Catalyst characterization methods
The bulk compositions of calcined Ni_CeAl and NiIn_CeAl samples were determined with non-destructive Prompt Gamma Activation Analysis (PGAA) technique at the neutron beam of the PGAA facility in Budapest [24,25]. The concentration calculation procedure is described by R´evay [26].
The specific surface area and the pore volume of the samples were determined from N2 adsorption–desorption isotherms at − 196 ◦C using a Micromeritics ASAP 2020. Before measurements the samples were degassed at 250 ◦C for 2 h. The specific surface area was calculated through the Brunauer–Emmett–Teller (BET) method applied to the adsorption curve in the standard pressure range 0.05–0.3 P/P0. By analysis of the desorption curve, using the BJH method, the mean pore size was obtained. The total pore volume (Vp) was evaluated on the basis of the amount of nitrogen adsorbed at the relative pressure of 0.95.
The crystalline structure of the calcined samples was determined by Powder X-ray diffraction patterns (XRD), performed on a Bruker D 5000 diffractometer equipped with a Cu Kα anode and graphite mono- chromator. The data were recorded in a 2θ range of 20◦-80◦with a step size of 0.05◦ and time per step of 5 s. The crystalline phases were analyzed by means of International Centre for Diffraction Data (ICDD) database.
Reduction properties of the calcined catalysts were studied by tem- perature programmed reduction (TPR) measurements in 5% H2/Ar (30 mL/min) in the range between room temperature and 1000 ◦C with a heating rate of 10 ◦C/min. Experiments were carried out with a Micromeritics Autochem 2910 instrument equipped with a thermal conductivity detector (TCD). For each sample, about 0.1 g of powder was pre-treated in 5% O2/He (30 mL/min) at 350 ◦C for 30 min and then cooled down under He atmosphere prior to the TPR run.
Morphology of the catalysts after ex situ calcination/reduction and after the DRM test reaction was investigated by Transmission Electron Microscopy (TEM) in TEM, HRTEM and HAADF modes by means of a FEI Titan Themis 200 kV spherical aberration (Cs) - corrected TEM with 0.09 nm HRTEM and 0.16 nm STEM resolution. Composition of the samples was measured by STEM-EDS and elemental maps were obtained by spectrum imaging with 4 Thermofischer "Super X G1′′EDS detectors built in the microscope.
In situ diffuse reflectance infrared Fourier transform spectroscopy (DRIFTS) was applied to study the adsorbed species detectable on the catalysts under 1% CO/Ar flow at room temperature. A Nicolet iS50 infrared spectrometer equipped with a Specac DRIFTS accessory and environmental chamber heatable up to 500 ◦C was used as detailed in [18]. After mounting the ex situ reduced sample on the sample holder, in situ reduction in the DRIFTS cell was carried out by heating the catalyst to 500 ◦C under 5% H2/Ar atmosphere with 10 ◦C/min rate and kept at this temperature for 30 min then it was cooled down to room temper- ature ready for CO chemisorption. All spectra shown in here were cor- rected with the spectrum (background) taken just before the admission of CO.
Surface compositions of the samples were determined by X-Ray photoelectron spectroscopy (XPS) in a KRATOS XSAM 800 instrument.
The samples were analyzed by using an unmonochromatized Al K-alpha source (1486.6 eV). The Al 2p binding energy from the alumina support set at 74.4 eV was used as reference for charge compensation. We believe that the alumina support can provide a good source for internal referencing, because both the shape and the FWHM of the Al 2p peak was the same in the samples and was not altered during the reduction pretreatments. The samples were measured after ex situ 650 ◦C calci- nation/750 ◦C reduction and after in-situ reduction at 500 ◦C for 30 min using 100 % H2 inside the instrument’s atmospheric pretreatment chamber. In some cases also the ex situ calcined (650 ◦C) state was measured. Because of the low amount of cerium and the overlapping of Ce 3d5/2 with the Ni 2p1/2 peaks, for evaluation of Ce3+amount the data treatment of Pardo and his co-workers [27] was used. According to this method, the Ce(IV)% of cerium is estimated by calculating the attenu- ation of the u′′′component at 917 eV with respect to the total area of the Ce 3d peak after subtracting the Ni 2p1/2 contribution. The Ce3+content in % was calculated according to Eq. (1).
Ce(III)% =100 – Ce(IV)% =100-u′′′%/14*100 (1) where u′′′is the area fraction of the peak at 917 eV. When there is only Ce4+present in the sample (as in pure CeO2), the u′′′peak is 14 % of the total area of the Ce 3d multiplet.
2.3. Catalytic studies
2.3.1. Methane activation experiments followed by thermogravimetric analyses of coke
The activation of methane by the catalysts was investigated through Temperature Programmed CH4 decomposition (TP− CH4) carried out using 50 mg of sample and a flow of 15 % CH4/N2 with 50 mL/min. The ex situ calcined catalysts before each TP− CH4 experiment were oxidized first at 350 ◦C (30 min using 5% O2/He and a ramp of 10 ◦C/min) than reduced at 750 ◦C for 1 h using 5% H2/Ar and a ramp of 10 ◦C/min. The consumption of CH4 was evaluated continuously in function of tem- perature by an IR analyzer (ABB Uras 26) calibrated in the range of 0–30 vol% for CH4. The thermogravimetric analyses (TGA) of the sam- ples after TP− CH4 reactions were performed in air using the TGA 1 Star System of Mettler Toledo. About 10 mg of sample was heated from room temperature to 100 ◦C, left at this temperature for 1 h and then heated to 1000 ◦C at the rate of 10 ◦C/min in 30 mL/min of flowing air.
2.3.2. Catalytic DRM tests followed by temperature programmed oxidation of coke
The catalytic runs were done in a fixed-bed flow reactor at 1 atm using CH4:CO2:Ar =49.5:49.5:1 mixture. 20 mg of catalyst along with 70 mg of diluting quartz beads were placed in a tubular quartz reactor where the reactant mixture was introduced at a flow rate of 70 mL/min (210 L/h/gcat). At the beginning of the experiments, the ex situ calcined samples were in situ reduced first in 30 mL/min H2:Ar =90:10 mixture by heating from ambient temperature to 750 ◦C at a rate of 10 ◦C/min followed by a 1 h isothermal hold at the target temperature.
Subsequently, the sample was cooled down to 650 ◦C in 10 min while it was purged with He, then the flowing gas was switched to the DRM mixture. Reaction was allowed to proceed for 6 h. A quadrupole Pfeiffer Prisma spectrometer was used for gas analysis and quantification of mass flow rates of H2, CH4, CO and CO2 components were done in the way described in [10].
Temperature programmed oxidation (TPO) measurements after cooling the sample in He to room temperature were done in 40 mL/min O2:He:Ar =10:89:1 mixture under temperature ramp to 650 ◦C at a rate of 10 ◦C/min followed by a 30 min isothermal hold. CO2 signal was used for quantification of carbon deposition removed after a calibration procedure.
3. Results and discussion
3.1. Structural characterization by N2 adsorption, XRD, TPR and TEM Bulk metal content of the calcined samples was measured by PGAA in two representative cases. Table 1 collects the theoretical and actual Ce, In and Ni content of the catalyst samples together with the particle size data to be discussed later on. As it is seen, Ce, In and Ni content corre- sponds well to the nominal values. The textural properties, viz. BET surface area, pore volume and pore size of the calcined samples were comparable, the CeO2-modification induced only little decrease of sur- face area and pore volume compared to alumina, but metal introduction had no further effects (see Table S1).
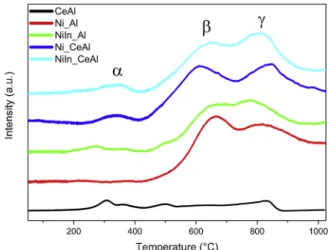
Reducibility of the samples was investigated by Temperature Pro- grammed Reduction (TPR) experiments in 5% H2/Ar stream up to 1000 ◦C. The H2-TPR profiles of the calcined catalysts are shown in Fig. 1. All the In and/or CeO2 containing samples showed three main reduction peaks, at around 300 ◦C, 650 ◦C and 800 ◦C, labelled respectively as α, β, γ, while the monometallic Ni_Al represented reduction features only above 450 ◦C. The presence of reduction peaks at such a high temperature indicates strong interaction of NiO with the support [28,29]. The peak at ca. 650 ◦C (β) is attributed to highly dispersed NiO species interacting with the support via Ni-O-Al linkages [22] and the peak at temperature higher than 750 ◦C (γ) is attributed to NiAl2O4 [30,31]. Therefore, in the case of Ni_Al reference sample, a significant portion of nickel exists as strongly interacting NiO species over the alumina surface (reduction peak maximum at 660 ◦C) and similar amount of nickel is inserted into the alumina structure as surface or bulk probably non-stoichiometric NiAl2O4 (with peak maximum at 790 ◦C).
The presence of In promoter induced a small additional α peak at low temperature (270 ◦C) for NiIn_Al. According to literature reports, sup- ported In2O3 usually shows two reduction zones, between 200− 400 ◦C due to highly dispersed surface In2O3 species predominant at low in- dium concentration and between 500− 800 ◦C due to reduction of bulk In2O3 [32–35]. In our catalyst this low temperature peak is assigned to the reduction of surface indium oxide species. The reduction of Ni-aluminate species shifts to slightly lower temperature (peak at 767 ◦C versus 790 ◦C of Ni_Al), this means Ni2+in the alumina lattice is easier to reduce because of the close presence of indium (oxide). Thus, similarly to our previous findings [10], indium promoter somewhat modifies the interaction of NiO with the support, and here mixed Ni-Al-In-oxide compounds or islands were supposedly formed and reduced to Ni or NiIn particles.
The black curve in Fig. 1 represents the reduction of CeAl support.
The presence of ceria additive with different reducibility is reflected by the small broad peaks in different temperature ranges. The low tem- perature peaks (at around 300 ◦C and 500 ◦C) are assigned to the reduction of surface CeO2 species while the peak at 830 ◦C is charac- teristic of the bulk CeO2 reduction [36]. If CeO2 content on alumina is below 20–30 %, (that is the case here), and the reduction temperature is such high as here, we can suppose the formation of Ce2O3 reacting with Al2O3 and resulting finally a CeAlO3 compound [36]. The Ni_CeAl
sample shows also a low temperature peak along with two high tem- perature peaks (β and γ). The α-feature can be assigned to the reduction of surface ceria interacting with surface Ni-oxide species. As found in other reports [37,38], the presence of ceria lowered the temperature of β peak (612 ◦C versus 660 ◦C) and consequently favored the reduction of surface NiO particles over Ni_CeAl. In contrast, the peak maxima of the Ni-aluminate species shifted 54 ◦C to higher temperature, meaning that a more-interacting [39] Ni-aluminate phase was formed when cerium oxide was also included in the support structure, yielding a sort of Ni-Ce-Al-oxide. Thus, it is harder to reduce nickel from this Ni-Ce-Al-oxide phase than from pure Ni-aluminate. The In-promotion in NiIn_CeAl sample brings the Ni-aluminate reduction peak to a lower temperature again (as in NiIn_Al compared to Ni_Al), while the presence of α peak shows the existence of some easily reducible Ni-CeOx(-InOy) compound on the alumina surface. Shortly, based on the above TPR results, the close vicinity of the modifier Ce-oxide or indium promoter to Ni is unambiguous.
Fig. S1 shows XRD pattern of calcined catalysts along with the respective Al (Al2O3) and CeAl (CeO2-Al2O3) supports. In order to check the presence of NiO and/or NiAl2O4 found by TPR analysis, the reference patterns of those from ICDD database (00− 044-1159 for NiO and 01− 078-6950 for NiAl2O4) have been added to the graphics. Beside γ alumina, peaks of 7.4 nm sized crystalline cubic ceria could be also identified in CeAl. For all samples the diffraction patterns were analo- gous to the bare supports and no segregated crystalline NiO or NiAl2O4
were visible. We can postulate that after reduction treatment the metallic nickel particles were formed from this well-dispersed NiO species and (some of) the surface – probably non-stoichiometric – Ni- aluminate.
TEM and HRTEM images of the ex situ calcined and reduced samples gave information on the catalyst morphology, while colored EDS elemental mapping of chosen areas informed us on the distribution of Ni, Ce and In compounds. Our catalysts showed the presence of nickel particles with a very similar average particle size, between 4.5–5.8 nm
(Table 1). The widest size distribution was observed on the most com- plex, NiIn_CeAl sample. Ni_Al catalyst is depicted in Fig. S2. A compact, kind of layered structure (Fig. S2a) and interplanar spacing of 0.46 nm corresponding to NiAl2O4 (111) phase was detected on the surface of Ni_Al sample along with some darker particles with 0.203 nm inter- planar spacing assignable to Ni(111) (Fig. S2b). The surface coverage of alumina by the residual (not reduced) Ni-aluminate must be only partial, as the Ni content was low, and the majority of Ni-oxide must have been reduced during the reduction process at 750 ◦C. We suppose that rela- tively small Ni particles (~4.5 nm) on Ni-aluminate or alumina is the characteristic morphology of the Ni_Al sample prior to the DRM reaction (after calc650 ◦C/red750 ◦C treatment).
The indium-promoted counterpart of this sample (NiIn_Al, Fig. 2) has 5.1 nm size Ni particles and the same, compact, layered-like structure at some parts and thinner Ni-rich areas at other parts as well. (see the ar- rows in TEM image of Fig. 2a and the corresponding HAADF image in Fig. 2b). The HAADF image of such thinner area is shown in Fig. 2c. The colored EDS maps including Al, Ni and In in Fig. 2d-f prove that nickel is present in particulate form and indium is alloyed with nickel particles and dispersed also in/on the alumina matrix. Elemental mapping for this total area provides an average value of Ni/In~42 that is higher than the theoretical value (Ni/In =24 or according to the elemental analysis Ni/
In =16), meaning that indium is not exclusively associated with nickel species. Fig. S3 depicts the same thin area shown in Fig. 2c but with selected areas focused on several individual Ni particles, where the Ni/
In atomic ratios were determined separately. All these and their average data were collected in a table beside the image. These data show that each of the Ni particles investigated is intimately associated with in- dium, viz. Ni is alloyed with indium. As the indium content is extremely low here, the detection of NiIn alloy based on lattice constant differences is really challenging and so to take HRTEM images were not in the focus of this work (Ni2In and NiIn alloys in the 2%In3%Ni/SiO2 sample were already found with ease [10]). Thorough investigation of the available TEM images with higher magnification resulted in the spot of lattice fringes shown in Fig. S4: the interplanar spacing of 0.212 nm might be attributed to the (102) or (110) plane of hexagonal Ni2In alloy (PDF 42–1033).
The TEM image of Ni_CeAl sample is shown in Fig. S5. Similarly as above, a kind of ordered, compact areas can be observed along with groups of round particles, the darkest of them must be nickel. The ceria content did not cause significant difference in nickel particle size (4.7 ±0.9 nm) but the size distribution slightly decreased, which in- dicates that the nickel-support interaction became stronger (remember the behavior of gamma peak in TPR spectra).
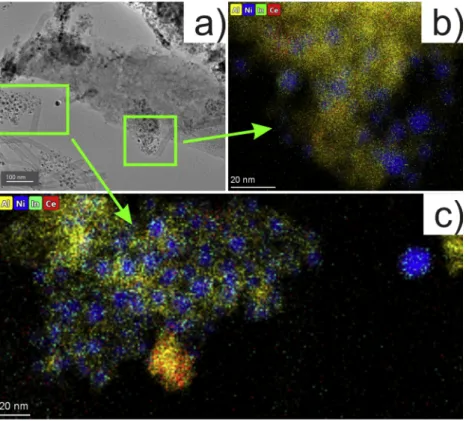
The presence of indium promoter over the mixed support increased the size of Ni particles and the size distribution widened. The TEM image of NiIn_CeAl in Fig. 3a shows both typical areas: thin, Ni-rich and a more compact structure with less nickel particles.
The thorough investigation of this sample revealed that ceria is not uniformly distributed over the catalyst (at least at nanoscale): there were ceria-richer (cloudy opaque area in the HAADF images) and ceria-leaner areas (Fig. 3b-c). In contrast, the distribution of indium is uniform and a value of Ni/In~25 was obtained all over the sample. It means that In is associated with nickel as it is shown by the colored elemental maps in as Fig. 3d-e. A closer, particle level distribution of Ni and In at higher Table 1
Bulk composition and particle size data of the samples.
Sample name Theoretical composition (wt%) Elemental composition by PGAA (wt%) Metal particle size by TEM (nm)
Ni In Ce Ni In Ce After red. After DRM
Ni_Al 3 – – n.d.* n.d. n.d. 4.5 ±1.3 n.d.
NiIn_Al 3 0.25 – n.d. n.d. n.d. 5.1 ±1.3 n.d.
Ni_CeAl 3 – 6.8 3.3 – 6.8 4.7 ±0.9 5.8 ±1.6
NiIn_CeAl 3 0.25 6.8 3.1 0.36 6.6 5.8 ±1.6 6.6 ±2.0
n.d.=not determined.
Fig. 1. TPR profiles of the calcined catalyst samples obtained under 5% H2/ Ar flow.
magnification is shown again in Fig. S6. The composition of the indi- vidual particles was determined and collected in the table beside the figure and resulted exactly the theoretical Ni/In~24 composition as an average, meaning that In is present dominantly very close/inside/over each and every Ni particle. Comparing the Ni/In ratios of the two In- containing samples, we can suggest that indium is preferentially located in/around/on the nickel particles of the NiIn_CeAl sample (and more indium might be alloyed with metallic nickel than in NiIn_Al).
3.2. XPS characterization results
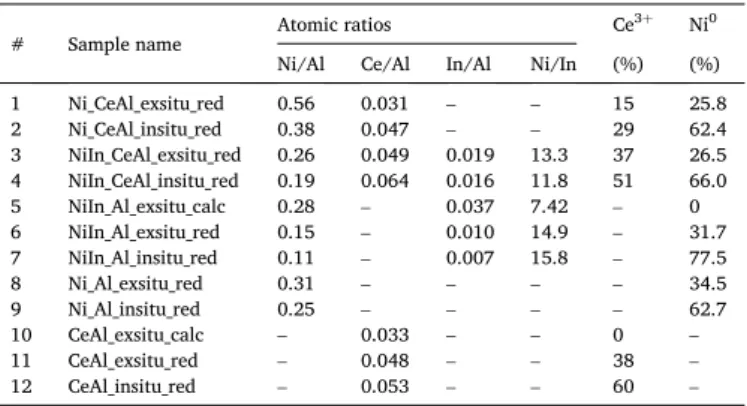
The XPS results collected in Table 2 provided valuable information on the oxidation state and surface concentration of catalyst components after the ex situ (750 ◦C) and then the in situ (500 ◦C) reduction treat- ment carried out inside the pretreatment chamber of the XPS machine.
This “double reduction” was done to produce the same state of the catalyst that was formed in the high temperature reduction before the DRM reaction. Based on these considerations we exactly know the oxidation states and surface compositions present when contacting the reactants at the very beginning of the catalytic test.
Fig. 2. TEM results of the calcined/reduced NiIn_Al sample: a) a thin Ni-rich area indicated by the upper arrow and a typical layered structure indicated by the lower arrow; b) HAADF image of the same area; c) HAADF image of a thin, Ni rich island and EDS elemental maps of d) Al, e) In and f) Ni elements obtained over this island.
All catalysts showed very similar binding energy shifts and intensity changes that are detailed here using the spectra of two representative samples, NiIn_Al and NiIn_CeAl (Fig. 4a-f). As for the indium region, we have to keep in mind that there is maximum 1 eV difference in the BE of In◦and In.3+The dotted line in Fig. 4a-c represents the shift of indium 3d5/2 peak position upon the reduction pretreatments. The peak with a maximum at 444.7 eV in calcined state of NiIn_Al (Fig. 4a) corresponds to indium oxide [40], which after the ex situ reduction shifted to 444.3 eV (not shown) and after the in situ reduction further to 444.0 eV (Fig. 4b) that is very close to the metallic indium detectable at 443.7 eV [41]. When Ce was present in the sample as in the case of NiIn_CeAl (Fig. 4c), the In peak in the in situ reduced state was located again at 444.1 eV. These low BE values suggest that after reduction significant amount (majority) of surface indium is present in zero oxidation state independent of the presence or absence of ceria additive.
Ni binding energy at 855.8 eV after ex situ calcination at 650 ◦C
(Fig. 4d) corresponds to the presence of both Ni2+in aluminate phase [42] and NiOxHy in the representative NiIn_Al sample [43]. The ex situ reduction produced a metallic nickel 2p3/2 component at 852.3 eV (not shown) that shifted with 0.2 eV downward upon the in situ reduction at 500 ◦C (852.1 eV), but a small fraction of Ni2+remained, as the fitted green peak with 855.1 eV maximum reflects in Fig. 4e. We expected to find Ni2+ after the ex situ reduction treatment, because the sample surface was definitely re-oxidized by contact with ambient air after the H2 treatment. The % Ni◦column in Table 2 shows the ratio of metallic nickel among all nickel species, and it reflects nicely the sensitivity of nickel surface towards air (compare the ex and in situ reduced states for each catalyst). The extent of re-oxidation of Ni at room temperature is similar over both ceria containing samples and significantly higher than over the samples without ceria. Since TPR results implied that the ex situ reduction treatment at 750 ◦C is not able to reduce all the Ni-oxide to metallic state (being the last TPR peak maxima at higher temperature Fig. 3. TEM results of the calcined/reduced NiIn_CeAl sample: a) a typical layered structure indicated by the upper arrow and a thin Ni-rich area indicated by the lower arrow; b) HAADF image of a large area and EDS maps of c) Ce, d) Ni and e) In elements obtained over the same large area.
than 750 ◦C), the presence of Ni2+ component (in the form of Ni-aluminate) – meaning the incomplete reduction of Ni-oxide – even after the lower temperature in situ reduction is highly acceptable. See that the highest reduced nickel amount was obtained over NiIn_Al that is 77.5 % (Table 2, entry 7). Note that in this sample the reduction of Ni-aluminate (γ peak in TPR) occurs at lower temperature than in the other catalysts.
If we follow the change of Ni and In surface concentrations during calcination and reduction of NiIn_Al sample (Table 2, entries 5–7), we can conclude that after calcination at 650 ◦C there are well dispersed nickel and indium oxide species on the surface that sinter upon reduc- tion. The larger change in the corresponding In/Al versus Ni/Al values can be explained by enhanced indium sintering or diffusion into the bulk upon reduction. As the In BE values are close to that of the zero oxidation state, indium must be mostly metallic rather than included in the Al-O- Al matrix. Moreover, the TPR and STEM-EDS elemental mapping results also suggest that significant amount of In is associated (alloyed) with nickel.
Let us analyze now the XPS results concerning the state and distri- bution of Ce, since ceria component can play a significant role in the active oxygen transport and the coke removal during DRM reaction. The XPS cerium region in our case is more complex than usually because of the low amount of cerium and the overlapping with the Ni 2p1/2 peaks.
The classic fitting suggested by Burrough [44] would have been complicated and uncertain here. This is why we used the method of Pardo [27] (see the Experimental and Fig. S7) for the determination of Ce3+ amount. The CeO2-modified alumina support after calcination (Table 2, entry 10) contained fully oxidized ceria having only Ce4+sites.
The CeAl support after ex situ reduction at 750 ◦C and room temperature air contact shows a degree of reduction of 38 % (Table 2, entry 11). The subsequent mild in situ reduction, that influences mostly the upper Table 2
XPS results: surface composition data and relative amount of metallic nickel and Ce3+sites.
# Sample name Atomic ratios Ce3+ Ni0
Ni/Al Ce/Al In/Al Ni/In (%) (%)
1 Ni_CeAl_exsitu_red 0.56 0.031 – – 15 25.8
2 Ni_CeAl_insitu_red 0.38 0.047 – – 29 62.4
3 NiIn_CeAl_exsitu_red 0.26 0.049 0.019 13.3 37 26.5 4 NiIn_CeAl_insitu_red 0.19 0.064 0.016 11.8 51 66.0
5 NiIn_Al_exsitu_calc 0.28 – 0.037 7.42 – 0
6 NiIn_Al_exsitu_red 0.15 – 0.010 14.9 – 31.7
7 NiIn_Al_insitu_red 0.11 – 0.007 15.8 – 77.5
8 Ni_Al_exsitu_red 0.31 – – – – 34.5
9 Ni_Al_insitu_red 0.25 – – – – 62.7
10 CeAl_exsitu_calc – 0.033 – – 0 –
11 CeAl_exsitu_red – 0.048 – – 38 –
12 CeAl_insitu_red – 0.053 – – 60 –
Fig. 4.Representative XPS results. Indium 3d region of a) NiIn_Al after ex situ calcination, b) NiIn_Al after in situ reduction and c) NiIn_CeAl after in situ reduction.
Ni 2p region with the fitted Ni 2p3/2 components of d) NiIn_Al after ex situ calcination, e) NiIn_Al after in situ reduction and f) NiIn_CeAl after in situ reduction.
oxide/hydroxide layers but renders the sample into the same state as after the high temperature reduction, increases the reduction degree of surface ceria – and 60 % Ce3+ forms over the parent CeAl support (Table 2, entry 12). The addition of Ni or Ni with In by DP method caused a decrease of the final Ce3+ concentration compared to the parent CeAl support (compare entries 2, 4, 12 in Table 2). It is known that intrinsic oxygen vacancies are created upon the reduction of ceria with the concomitant formation of Ce3+sites, and the increase of Ce3+ sites in the structure means the increase of the reducibility of ceria [6]. It seems that the reducibility of ceria modifier layer (its oxygen mobility) was decreased by the sole presence of nickel but only a little bit when indium guest ions were present as well. We should note that when a dopant (usually yttria) is incorporated in the ceria oxide lattice, addi- tional oxygen can be removed from the material resulting the formation of extrinsic oxygen vacancies and a decrease of Ce3+in the bulk struc- ture [6]. This is why the amount of Ce3+and the number of actual ox- ygen vacancies are not in strict relationship if guest atoms are expected to be incorporated in the ceria lattice. Unfortunately, our XPS oxygen spectra did not tell anything about the possible oxygen vacancies, as ceria content was really low and alumina oxygen was the prevailing component. However, no doubt, the highest Ce3+ concentration was obtained over the NiIn_CeAl catalyst sample.
The higher surface concentration of Ce (Ce/Al ratio) for the bime- tallic NiIn_CeAl catalyst compared to Ni_CeAl suggests that different interactions and surface rearrangements took place over the same CeAl_support under the catalyst preparation and activation steps (DP and calcination/reduction). During the deposition-precipitation process the ideal case is that the precursor and the precipitant are distributed uniformly throughout the pores before the onset of slow precipitation by urea hydrolysis [45]. As the IEP of alumina is higher than that of CeO2
[8] this may further vary the possibilities during deposition. To further complicate the picture, the calcination step transforms all components to different mixed Ni-(In)-Ce-Al-oxide species that reduce to metallic Ni (In) particles and some residual defective mixed surface oxide. Without knowing the exact reasons, it seems that ceria and nickel are distributed differently due to the indium promotion: there is more ceria on the surface and it is more reducible over NiIn_CeAl than over Ni_CeAl.
Finally, we should point out the surface In enrichment of NiIn_CeAl compared to NiIn_Al. If we accept that indium is present mainly in NiIn alloyed particles, the lower Ni/In ratio of NiIn_CeAl may suggest us that In is in higher concentration on the surface of its bimetallic particles.
The above XPS results tell us that Ni and In are mainly in metallic state after reduction, however, some oxidized Ni must be present and we cannot disclose minor amount of indium in oxidic state either. Note that the portion of nickel in zero oxidation state after the in situ reduction (~62 %) does not change when using the CeO2-modified alumina instead of pure alumina. In contrast, indium promoter induces an in- crease in the metallic nickel ratio, the most for NiIn_Al (77.5 % Ni0). This means ceria “rather keeps” nickel in oxidized state while indium en- hances the amount of metallic nickel via its intimate contact or alloy formation with Ni, in accordance with the TPR results (remember the Ni- aluminate peak shifted to lower temperature for the NiIn samples).
3.3. CO chemisorption investigated by DRIFTS
The stretching frequency of CO in general depends on the nature of the adsorbing metal, its surface structure and the CO coverage [46].
DRIFT spectra were obtained on the reduced samples during CO chemisorption experiments using 1% CO/Ar mixture. The catalyst was
“double reduced” to get as close as possible to the surface state present before the DRM test: the ex situ (750 ◦C) reduced samples were in situ pretreated at 500 ◦C in 5% H2/Ar before the room temperature CO chemisorption in the DRIFTS cell.
Beside the gas phase CO absorption bands between 2100 and 2200 cm−1, several bands of surface-bonded CO species can be seen in Fig. 5. The samples without indium exhibit less intense CO bands
(Fig. 5a-b). The band at around 2090 cm−1 (2089 cm−1 for Ni_Al and 2086 cm−1 for Ni_CeAl) is assignable to the CO molecules that are attached to the corner, step, kink Ni atoms of dispersed particles or to the presence of subcarbonyls [47,48]. The shoulder at around 2050 cm−1 can be assigned to chemisorbed monocarbonyls over dense facets [49, 50]. The band with a maximum at around 1950 cm−1 and a broad shoulder at around 1910 cm−1 can be attributed to bridge and multi- bonded carbonlys on low index planes with different surface heteroge- neities (1951 cm−1 and 1915 cm−1 for Ni_Al and 1947 cm−1 and 1912 cm−1 for Ni_CeAl) [47,48]. The systematic 3− 4 cm−1 red shift of each wavelengths in the case of ceria containing samples may reflect the small electronic effect of the Ni-ceria interface (increase of electron density of interfacial nickel via the formation of Ce3+sites).
The same type of spectra for the indium-containing catalysts (Fig. 5c- d) present a strong red shift for all carbonyl bands and an enhanced ratio of linear/bridged CO species. Generally, if the electronegativity of a metal modifier is lower than that of nickel, it can cause an increase in the electron density of surrounding Ni sites and shift the CO peak to lower frequencies (red shift) [51]. While a small red shift of CO band of a bimetallic catalyst suggests that the modifier atoms disrupt the original metal ensembles and decrease the dipole-dipole coupling of adsorbed CO molecules (geometric effect) [52,53].
The ~30 cm−1 shift caused by the ~0.3 wt% In can be interpreted only if Ni is in close vicinity or rather alloyed with indium. The shortage of adjacent Ni sites due to the addition of In atoms would mean also the strong reduction, even the absence of bridged CO molecules (as was the case for our 3%Ni2%In/SiO2 catalyst [18]). However, with as low as 0.3 wt% In here, calculating very roughly with Ni particles of 5 nm, the number of surface Ni atoms is still 4 times more than the indium atoms present in the sample and so even the theoretical monolayer coverage is not possible. It is indeed surprising how strong the indium effect is on the C–––O bond of chemisorbed carbonyls. The band that was seen at around 2090 cm−1 for the indium-free samples was shifted to
~2060 cm−1 (2064 cm−1 for NiIn_Al and 2062 cm−1 for NiIn_CeAl), and it is assigned to CO on Ni edge, corner, kink atoms surrounded by indium atoms. The small shoulder at around 2030 cm−1 must be attributed to CO bonded on bimetallic NiIn sites on closed packed planes, viz. Ni atoms surrounded by many or exclusively In neighbors. The band in the Fig. 5.DRIFT spectra of CO at room temperature over the in situ reduced samples in the presence of 1%CO/Ar. (Background corrected spectra are shown.).
bridged region at around 1870 cm−1 with a small shoulder at 1930 cm−1 for both In-containing samples is assigned to multiply bond carbonyls on Ni in contact with In-oxide at the metal-support interface.
Indium influences the bonding strength of CO drastically (see the large red shift). Additinally the dominance of the linear carbonyls at around 2060 cm−1 implies that indium deposition increases the ratio of undercoordinated Ni sites. That means the surface morphology of nickel particles must be very different: many Ni atoms are in defective, undercoordinated position – in the neighborhood of indium atoms.
3.4. Activity in CH4 decomposition and the TGA results
The activity towards CH4 activation was studied on reduced samples by Temperature Programmed CH4 decomposition (TP− CH4) up to 1000 ◦C. It is known that methane decomposition is a structure sensitive reaction and proceeds with higher activation energy over close packed than over open, undercoordinated planes of the metal [39]. Norskov et al. [54] demonstrated that step edges act as growth centers for gra- phene growth mainly because carbon binds more strongly to such sites than to sites on the close packed facets of Ni. It is clear that for CH4
decomposition and DRM activity metallic nickel is required. We are aware of that our reduction pretreatment before these experiments was performed at 750 ◦C that is lower than the maximum of the γ TPR peaks.
However, XPS results proved that significant part of the nickel content was reduced (up to 77 %) during 1 h reduction pretreatment at 750 ◦C and so there was metallic nickel present.
We expected different CH4 decomposition profiles for our catalysts after detecting such big differences in the CO chemisorption wave- lengths of In-promoted and unpromoted catalysts. The obtained TP− CH4 curves are shown in Fig. 6.
All samples show basically the same feature: an initial small and a subsequent main dissociation peak. Nevertheless, there are differences in temperatures and in the amount of methane converted up to 800 ◦C as it is summarized in Table 3.
The starting points of methane dissociation (CH4⇌CHx+(4-x)H), representing the light off values, followed the order: Ni_CeAl (390 ◦C) <
NiIn_Al (430 ◦C), NiIn_CeAl (440 ◦C) <Ni_Al (520 ◦C). The lower light off temperatures found for the samples containing In and Ce may be related to the presence of different Ni(In)-InOx-CeOx interfaces. This assumption is supported by the relevant literature: experimental and theoretical results on Ni/CeO2(111) surface showed that Ni atoms and small particles in direct contact with the ceria support are able to acti- vate methane even at room temperature [55]. Although CH4 dissocia- tion proceeds generally on metallic Ni, interfacial O sites were also suggested as activation sites for methane dissociation [56]. In contrast,
NiAl2O4 phase was found to hinder or inhibit the adsorption and dissociation of CH4 [57]. It is interesting to note for the Ce-free samples that the temperature of maximum CH4 conversion was higher. The descending side of the four curves were paired into Ce-free and Ce-containing groups (circled in Fig. 6). This means the Ce-containing catalysts can activate methane at lower temperature but their activity ceased earlier supposedly due to deactivation by coking. The other two catalysts (Ni_Al and NiIn_Al) deactivated at higher temperature, and Ni_Al had the narrowest activity window. According to the literature, catalyst having the widest temperature window of CH4 decomposition may exhibit the best anti-coking ability in dry reforming [58]. Based on this, Ni_Al is expected to be an easily coking catalyst. The most impor- tant issue of these experiments is that NiIn_CeAl sample converts the least CH4 and seemingly has several activation sites with different nature.
The differences in the amount of converted methane calculated by the integration of the area between 300 and 800 ◦C may be related to differences in dispersion of the active phase that is roughly valid in our case as Ni_Al is the most dispersed while NiIn_CeAl the least one.
However, beside the number of surface Ni atoms, their morphology and the presence of promoters have the same, or under our conditions, even more pronounced influence on the amount of decomposed methane.
Theoretical calculations showed that substituting even subsurface Ni atoms of stepped surface with other elements can weaken the adsorption of atomic carbon, resulting in the change of reaction mechanism of methane decomposition [59]. Thus, if indium is located in the subsur- face region of nickel, it can still influence CH4 dissociation. The different profiles of the two In-containing samples emphasize the importance of ceria additive and/or suggest that different NiIn surfaces (Ni ensemble geometries) are present to dissociate the CH4 molecules. (Although, this difference is not relevant at room temperature for the CO probe molecules.)
TGA analysis was performed after TP− CH4 experiments in order to evaluate the amount and nature of carbon formed upon methane decomposition. Since the methane decomposition test was followed up to quite high temperature (1000 ◦C) and considering as well the effect of surface assisted gas phase reaction [58], the amount of deposited carbon must be handled with care. However, the TGA profiles, although miss quantitative information, they may still provide qualitative evidence of the coke nature. Fig. 7 depicts that oxidation of surface coke proceeds in two different temperature ranges (framed separately) reflecting the different typology and oxidation ability of carbon. Ni_Al shows a peak at ca. 675 ◦C and a shoulder at 625 ◦C typical for the oxidation of fila- mentous carbon having graphitic structure [60]. We assign the lower temperature shoulder to the oxidation of disordered, thin nanotubes and the main peak to thick, really tough nanotubes and crystalline coke, encapsulating the nickel particles. For NiIn_Al this last type of coke seems insignificant and mainly fine carbon nanotubes may have been formed. As for the Ce-containing samples, there was a first peak in the lower temperature range. In details, over NiIn_CeAl only a single peak was detected at ca. 410 ◦C, typical of amorphous carbon spatially closer to the active sites. This means that during CH4 decomposition only a defective non-crystalline surface carbon was deposited that could be easily removed, in contrast with the other samples. Over the Ni_CeAl sample, two types of coke were deposited: an easily removable carbon at Fig. 6.Results of temperature programmed CH4 decomposition experiments in
the presence of 15 % CH4/N2 flow.
Table 3
Quantitative and qualitative results of temperature programmed CH4 decom- position experiments.
Sample Light off temp.
(◦C) T of peak
(◦C) Total CH4 converted between 300− 800 ◦C (mL)
Ni_Al 520 620 19.5
NiIn_Al 430 605 13.0
Ni_CeAl 390 550 15.5
NiIn_CeAl 440 570 5.5
400 ◦C, and a tough, graphitic type with the typical peak at 680 ◦C. This implies that there might have been two types of active sites on Ni_CeAl:
one of them may use the active oxygen provided by the ceria component [61,62], these are probably Ni atoms with Ni-CeO2 interface (producing amorphous coke removable around 400 ◦C), while the other type is similar to the ones present on pure Ni_Al. The bulky, filamentous carbon is hard to remove as it usually moves under reaction and accumulates on the support surface far from the Ni active sites, or detaches the nickel particles terminating the metal support interaction.
These TGA experiments pointed out firstly that, in contrast with the pure alumina supported samples, the presence of cerium contributes to the creation of active sites promoting the deposition of easily removable carbon (as expected). The addition of indium to this system (NiIn_CeAl sample) inhibits substantially the CH4 decomposition and produces only the easily oxidizable surface carbon. Adding indium to the pure alumina supported catalyst retards CH4 decomposition in lower extent and has a pronounced effect on the morphology and/or the oxidation kinetics of graphitic coke.
3.5. Dry reforming of methane test reaction 3.5.1. Catalytic properties under dry reforming
The previous CH4 decomposition experiments gave some hint on what trend in dry reforming activity could be expected. However, we know that the simultaneous presence of the reactants or the derived adsorbed species may influence the dissociation of the reactants them- selves [63] and even the enhancement of carbon deposition can happen.
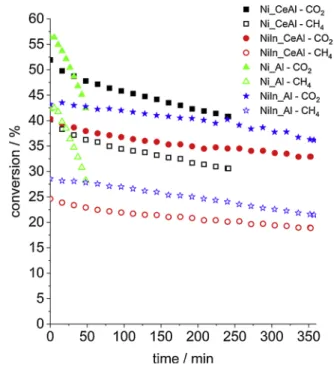
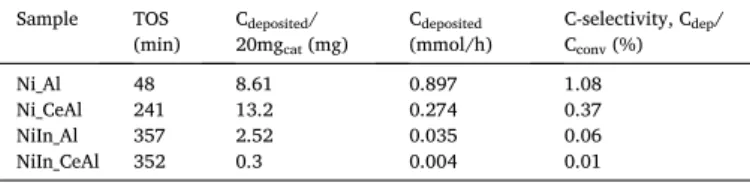
Fig. 8 depicts the conversion curves obtained during DRM test reaction at 650 ◦C. All the samples exhibited decreasing reactant conversions under TOS.
The deactivation can be generally attributed to coke deposition, sintering or overoxidation of active Ni sites. The highest CH4 conversion was obtained (42 %) over Ni_Al, while the lowest (25 %) over NiIn_CeAl catalyst. The Ni_Al and Ni_CeAl samples were so severely coked (see later) before the end of the test (TOS~6h =360 min) that the mass flow controllers were not able to maintain the flow and the reaction must have been stopped before the end (this is why those conversion curves are shorter). Compared to the steeply descending curve of Ni_Al sample, the deactivation tendency was somewhat attenuated 10 min after the start of the reaction in the case of Ni_CeAl and the catalyst could convert methane up to 240 min. The slight decrease in the initial CH4 and CO2
conversions of this sample compared to that of Ni_Al could be explained with migration of reduced ceria from the support onto the Ni surface as in the case of a 5% Ni/CeO2 [64]. (Remember, the lowest intensity CO band was found over this sample having the highest Ni concentration according to the XPS data.)
Concerning the In-promoted samples, the initial CO2 and CH4 con- version values were significantly lower, the least activity was presented by NiIn_CeAl, but they were much more stable than the In-free catalysts (CH4 conversion over NiIn_CeAl decreased from 25 % to 19 % by the end of TOS). The lower initial CH4 conversions reflect the decreased ability of NiIn surfaces to activate/dissociate CH4, as the previous TP− CH4
experiments showed (see Table 3), and are in agreement with the decrease of Ni dispersion values (TEM particle size, Table 1).
Table 4 collects the CO2/CH4 conversion and the H2/CO ratios and the H2 selectivity values obtained during DRM. The theoretical H2/CO ratio is 0.8 under our conditions of 1 bar, stoichiometric reactants and 650 ◦C, the change of this ratio with TOS is shown in Fig. S8 for all our samples.
If H2/CO is lower than the theoretical value, and the CO2 conversion is higher than the CH4 conversion, the occurrence of RWGS (CO2 +H2 ⇌ CO +H2O) can certainly be assumed [65]. The data in the three columns of Table 4 should be correlated to understand the catalytic behavior of the samples. For the first thought, one would expect an increased CO2
adsorption/activation/conversion due to the presence of basic CeO2
component, but ceria modifier itself induced no increase in the initial CO2/CH4 conversion ratio compared to Ni_Al. As ceria has significant WGS activity even at moderate temperatures [66], this could influence the H2/CO ratio obtained. The H2 selectivity was the lowest for Ni_CeAl, which means the hydrogen atoms of methane were not fully converted to H2 – some of them remained on the surface forming probably water or Fig. 7. TGA curves and their first derivatives after the TP−CH4 experiments
obtained during temperature ramp in the presence of airflow.
Fig. 8. Methane and CO2 conversion curves during DRM test. CH4: empty symbols, CO2: full symbols. (Conditions: after reduction at 750 ◦C/1 h cooling to T =650 ◦C in He, then DRM with CH4:CO2:Ar =49.5:49.5:1 mixture, 210 L/
h/gcat.).
Table 4
Catalytic results of DRM tests at 650 ◦C: conversion and H2/CO ratios, H2
selectivity.
Sample CO2/CH4 conversiona H2/COb H2 selectivityc
Ni_Al 1.33 0.68 → 0.64 0.90 → 0.93
Ni_CeAl 1.29 0.70 → 0.61 0.80 → 0.71
NiIn_Al 1.48 0.63 → 0.56 0.84 → 0.80
NiIn_CeAl 1.60 0.60 → 0.50 0.87 → 0.73
a At the beginning of the reaction.
b At the beginning and at the end of the reaction, see Fig. S8 for more details.
cAt the beginning and at the end of the reaction.