Association between AIRE gene polymorphism and rheumatoid arthritis: a systematic review and meta-analysis of case-control
studies
Bálint Bérczi
1, Gellért Gerencsér
1, Nelli Farkas
2, Péter Hegyi
3,4,5, Gábor Veres
6, Judit Bajor
7, László Czopf
8, Hussain Alizadeh
9, Zoltán Rakonczay
10, Éva Vigh
11, Bálint Erőss
4, Kata Szemes
7& Zoltán Gyöngyi
1Autoimmune regulator (AIRE) is a transcription factor that functions as a novel player in immunological investigations. In the thymus, it has a pivotal role in the negative selection of naive T-cells during central tolerance. Experimental studies have shown that single nucleotide polymorphism (SNP) alters transcription of the AIRE gene. SNPs thereby provide a less efficient negative selection, propagate higher survival of autoimmune T-cells, and elevate susceptibility to autoimmune diseases. To date, only rheumatoid arthritis (RA) has been analysed by epidemiological investigations in relation to SNPs in AIRE. In our meta-analysis, we sought to encompass case-control studies and confirm that the association between SNP occurrence and RA. After robust searches of Embase, PubMed, Cochrane Library, and Web of Science databases, we found 19 articles that included five independent studies.
Out of 11 polymorphisms, two (rs2075876, rs760426) were common in the five case-control studies.
Thus, we performed a meta-analysis for rs2075876 (7145 cases and 8579 controls) and rs760426 (6696 cases and 8164 controls). Our results prove that rs2075876 and rs760426 are significantly associated with an increased risk of RA in allelic, dominant, recessive, codominant heterozygous, and codominant homozygous genetic models. These findings are primarily based on data from Asian populations.
Rheumatoid arthritis (RA) is a common autoimmune disease associated with chronic synovial inflammation.
The resultant symmetrical polyarticular arthritis, combined with extra-articular complications, leads to func- tional impairment. In developed countries, disease prevalence is 0.5–1% of the adult population, and the annual incidence has been reported to be 5–50 per 100,0001. Although the aetiology of RA has not been completely elucidated, numerous publications agree that autoimmune T-cells may escape from the adaptive immune system and, by migrating to the synovium, initiate disease development2–5. RA susceptibility is determined by multiple environmental and genetic factors, including several risk alleles. The latest trans-ethnic genome wide association study (GWAS), which involved 29,980 RA cases and 73,578 controls, completely screened novel polymorphisms in genes contributing to the disease6. One of the associated genes that seems to play a pivotal role in controlling autoimmunity is autoimmune regulator (AIRE). The gene is located in the 21q22.3 region, is ∼12.5 kb long, and
1Department of Public Health Medicine, Medical School, University of Pécs, Pécs, Hungary. 2Institute of Bioanalysis, Medical School, University of Pécs, Pécs, Hungary. 3MTA-SZTE Translational Gastroenterology Research Group, Szeged, Hungary. 4Institute for Translational Medicine, University of Pécs, Pécs, Hungary. 5Department of Translational Medicine, First Department of Medicine, University of Pécs, Pécs, Hungary. 61st Department of Pediatrics, Semmelweis University, Budapest, Hungary. 7Department of Gastroenterology, First Department of Medicine, University of Pécs, Pécs, Hungary. 8Division of Cardiology and Angiology, First Department of Medicine, University of Pécs, Pécs, Hungary. 9Department of Haematology, First Department of Medicine, University of Pécs, Pécs, Hungary. 10Department of Pathophysiology, University of Szeged, Szeged, Hungary. 11Department of Radiology, Medical School, University of Pécs, Pécs, Hungary. Correspondence and requests for materials should be addressed to Z.G. (email: zoltan.gyongyi@aok.pte.hu)
Received: 7 July 2017 Accepted: 9 October 2017 Published: xx xx xxxx
OPEN
www.nature.com/scientificreports/
encodes a 545 amino acid protein of 58 kDa by 14 exonial sequences7–9. The AIRE protein is a transcription factor that is indispensable with regards to the negative selection of immature T-cells (thymocytes). Cooperating with DNA-binding proteins, AIRE controls the promiscuous expression of peripheral tissue antigens (PTA). Mutations in the protein coding gene sequence of AIRE results in the development of autoimmune polyendocrinopathy candidiasis-ectodermal dystrophy, an autoimmune deterioration of numerous organs10–12.
To date, increasing numbers of publications have suggested that SNPs in the gene sequence affect AIRE tran- scription. The SNPs thereby alter the functional activity of AIRE and potentially elevate disease susceptibility7. A recent experimental study described two distinct SNPs of AIRE. AIRE−230Y, and AIRE−655G. AIRE−230T haplotype transcriptionally modifies AIRE expression and influence negative selection, elevating the risk of autoimmunity13. Various SNPs in the AIRE genetic sequence have garnered attention; however, to date, only a minority of case-control studies have observed an association between gene polymorphism and susceptibility to diseases, including vitiligo7,14, alopecia areata7,15, melanoma7,16, systemic sclerosis7,17 and RA7,18–22. Among the latter diseases, only RA has been analysed by multiple case-control studies and, therefore, seems to be optimal to analyse positive or negative associations7. Xu et al. have published that AIRE polymorphism was associated with the increased risk of RA23. Here, we present a systematic review and first meta-analysis that includes case-control studies to verify the association of SNPs rs2075876 and rs760426 in the AIRE gene with RA.
Results
Characteristics of included studies.
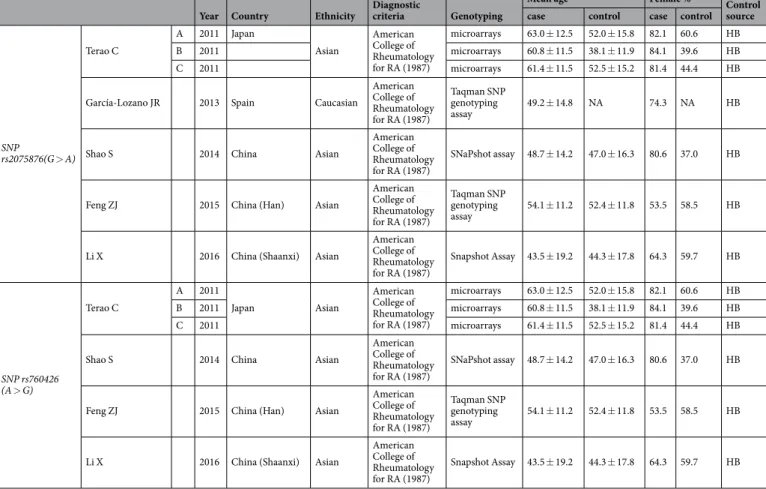
We identified 19 publications after a thorough search of Embase, PubMed, Cochrane Library, and Web of Science databases. After removing duplicates, we reviewed the remain- ing 11 studies for eligibility and selected five publications for inclusion in our meta-analysis. Our PRISMA flow chart of the searching process is shown in Fig. 1. Asian and Caucasian ethnicities were involved. Diagnosis of RA was determined according to the American College of Rheumatology classification criteria in 198724. The overall mean age of RA patients was 54.1 ± 2.4 years, and the percentage of female cases was 73.34%. Genotyping was conducted by microarrays, single base extension methods (SNaPshot), and Taqman SNP Genotyping Assays. By further reviewing the five eligible publications, we identified 11 SNPs of the AIRE gene (rs2075876, rs760426, rs1800250, rs2776377, rs878081, rs1055311, rs933150, rs1003854, rs2256817, rs374696, rs1078480).Only rs2075876 and rs760426 were involved in four or more studies; therefore, we performed meta-analysis for rs2075876 (7145 cases and 8579 controls) and rs760426 (6696 cases and 8164 controls). All genotype frequen- cies of the controls were in Hardy-Weinberg Equilibrium (HWE). Characteristics of the included studies on rs2075876 and rs760426 are summarized in Table 1.
Meta-analysis of SNP rs2075876 (G > A). Five studies were identified that investigated the association between SNP rs2075876 and RA susceptibility18–22. Most of the publications doubled the individual number to account for alleles; thus, to normalize the data, we also calculated with duplicated values (see Supplementary Figure 1. PRISMA flow diagram for inclusion and exclusion of studies in the meta-analysis.
Table S1). GWAS by Terao et al.18 served as three independent case-control studies (denoted with A, B, C). With the exception of García-Lozano et al.19, all of the studies described the genotype distribution for GG, AG, AA.
Therefore, we calculated odds ratios (ORs) for genetic models where there was no available or feasible data in the given study (Table 2). Results for each genetic model are shown in Fig. 2. For the allelic model (A vs. G, Fig. 2A) the ORs were 1.21 (95% CI 1.09–1.36, P < 0.001), 1.18 (1.07–1.30, P = 0.001), 1.15 (1.06–1.24, P < 0.001), 1.02 (0.42–2.42, P = 0.964), 1.32 (1.04–1.69, P = 0.021), 1.30 (1.12–1.50, P < 0.00), and 1.41 (1.16–1.70, P < 0.001).
For the dominant model (AG + AA vs. GG, Fig. 2B) the ORs were 1.18, (95% CI 1.06–1.32, P = 0.002), 1.31 (1.19–1.45, P < 0.001), 1.18 (1.09–1.27, P < 0.001), 1.41 (1.08–1.84, P = 0.010), 1.55 (1.32–1.82, P < 0.001), and 1.48 (1.22–1.78, P < 0.001). For the recessive model (AA vs. AG + GG, Fig. 2C) the ORs were 1.53 (95% CI 1.31–1.79, P < 0.001), 1.09 (0.95–1.26, P = 0.204), 1.25 (1.12–1.39, P < 0.001), 1.52 (1.13–2.05, P = 0.006), 1.25 (1.05–1.49, P = 0.010), and 1.78 (1.36–2.35, P < 0.001). For the codominant heterozygous model (AG vs. GG, see Supplementary Fig. S1), the ORs were 1.08 (0.96–1.21, P = 0.168), 1.32 (1.20–1.47, P < 0.001), 1.13 (1.05–
1.23, P = 0.002), 1.28 (0.97–1.70, P = 0.077), 1.51 (1.28–1.79, P < 0.001), and 1.34 (1.10–1.64, P = 0.003). For the codominant homozygous model (AA vs. GG, see Supplementary Fig. S1) the ORs were 1.60 (95% CI 1.35–1.89, P < 0.001), 1.27 (1.09–1.48, P = 0.002), 1.34 (1.19–1.51, P < 0.001), 1.78 (1.26–2.52, P = 0.001), 1.62 (1.32–1.99, P < 0.001), and 2.09, (1.56–2.81, P < 0.001).
Results of heterogeneity analysis for each genetic model are shown in Supplementary Table S2. For the allelic model Ph= 0.439 and I2 = 0%, for the dominant model Ph = 0.011 and I2 = 66.2%, for the recessive model Ph= 0.005 and I2 = 69.9%, for the codominant heterozygous model Ph = 0.004 and I2= 70.5%, and for the codom- inant homozygous model Ph = 0.012 and I2= 65.4%. Moderate heterogeneity was found in dominant, recessive, codominant heterozygous, and codominant homozygous models.
Only four out of 31 ORs were statistically insignificant, and the ORs revealed that SNP rs2075876 (G > A) is associated with an elevated risk of RA. These results therefore suggest a link between AIRE SNP rs2075876 (G > A) and RA susceptibility.
Meta-analysis of SNP rs760426 (A > G). Four studies investigated the association between SNP rs760426 and RA susceptibility18,20–22. Most of the publications doubled the individual number; thus, to normal- ize the data, we also calculated with duplicated values, as was conducted with rs2075876 SNP (see Supplementary Table S1). Again, GWAS by Terao et al.18 served as three independent case-control studies (denoted with A, B, C).
Year Country Ethnicity Diagnostic
criteria Genotyping
Mean age Female % Control
source case control case control
SNP rs2075876(G > A) Terao C
A 2011 Japan
Asian
American College of Rheumatology for RA (1987)
microarrays 63.0 ± 12.5 52.0 ± 15.8 82.1 60.6 HB
B 2011 microarrays 60.8 ± 11.5 38.1 ± 11.9 84.1 39.6 HB
C 2011 microarrays 61.4 ± 11.5 52.5 ± 15.2 81.4 44.4 HB
García-Lozano JR 2013 Spain Caucasian
American College of Rheumatology for RA (1987)
Taqman SNP genotyping
assay 49.2 ± 14.8 NA 74.3 NA HB
Shao S 2014 China Asian
American College of Rheumatology for RA (1987)
SNaPshot assay 48.7 ± 14.2 47.0 ± 16.3 80.6 37.0 HB
Feng ZJ 2015 China (Han) Asian
American College of Rheumatology for RA (1987)
Taqman SNP genotyping
assay 54.1 ± 11.2 52.4 ± 11.8 53.5 58.5 HB
Li X 2016 China (Shaanxi) Asian
American College of Rheumatology for RA (1987)
Snapshot Assay 43.5 ± 19.2 44.3 ± 17.8 64.3 59.7 HB
SNP rs760426 (A > G)
Terao C
A 2011
Japan Asian
American College of Rheumatology for RA (1987)
microarrays 63.0 ± 12.5 52.0 ± 15.8 82.1 60.6 HB
B 2011 microarrays 60.8 ± 11.5 38.1 ± 11.9 84.1 39.6 HB
C 2011 microarrays 61.4 ± 11.5 52.5 ± 15.2 81.4 44.4 HB
Shao S 2014 China Asian
American College of Rheumatology for RA (1987)
SNaPshot assay 48.7 ± 14.2 47.0 ± 16.3 80.6 37.0 HB
Feng ZJ 2015 China (Han) Asian
American College of Rheumatology for RA (1987)
Taqman SNP genotyping
assay 54.1 ± 11.2 52.4 ± 11.8 53.5 58.5 HB
Li X 2016 China (Shaanxi) Asian
American College of Rheumatology for RA (1987)
Snapshot Assay 43.5 ± 19.2 44.3 ± 17.8 64.3 59.7 HB
Table 1. Characteristics of the included studies on SNP rs2075876 (G > A) and rs760426 (A > G) (SNP = single nucleotide polymorphism; NA = not available; HB = hospital based).
www.nature.com/scientificreports/
With the exception of Feng et al.21, all studies described the genotype distribution for AA, GA, GG. We therefore calculated ORs for all the genetic models that were not published in the original articles (Table 2). Furthermore, we excluded the OR, 95% CI and p-value of Feng et al.21 from the statistical analysis due to the asymmetry of the OR. Results for each genetic model are shown in Fig. 3. For the allelic model (G vs. A), Fig. 3A, the ORs were 1.23 (95% CI 1.10–1.37, P < 0.001), 1.13 (1.02–1.25, P = 0.011), 1.16 (1.08–1.26, P < 0.001), 1.25 (0.98–1.60, P = 0.062), 1.25 (1.04–1.52, P = 0.018). For the dominant model (GG + GA vs. AA, Fig. 3B), the ORs were 1.16 (1.04–1.29, P = 0.007), 1.19 (1.08–1.31, P < 0.001), 1.18 (1.09–1.27, P < 0.001), 1.19 (0.92–1.55, P = 0.171), and OR 1.32 (1.10–1.59, P = 0.003). For the recessive model (GG vs. GA + AA, Fig. 3C) the ORs were 1.66 (95%CI Figure 2. The association of SNP rs2075876 (G > A) with RA risk in different genetic models. (A) Allelic model (A vs. G). (B) Dominant model (AG + AA vs. GG). (C) Recessive model (AA vs. AG + GG).
1.43–1.94, P < 0.001), 1.15 (1.00–1.32, P = 0.047), 1.19 (1.07–1.32, P = 0.001), 1.55 (1.16–2.08, P = 0.003), and 1.36 (1.05–1.77, P = 0.020). For the codominant heterozygous model (GA vs. AA, see Supplementary Fig. S2) the ORs were 1.03, (95% CI 0.92–1.16, P = 0.582), 1.17 (1.06–1.30, P = 0.002), 1.15 (1.06–1.25, P = 0.001), 1.04 (0.79–1.38, P = 0.741), and 1.26 (1.03–1.54, P = 0.020). For the codominant homozygous model (GG vs. AA, see Supplementary Fig. S2), the ORs were 1.69 (1.43–2.00, P < 0.001), 1.25 (1.08–1.46, P = 0.003), 1.29 (1.15–1.44, P < 0.001), 1.60 (1.15–2.24, P = 0.006), and 1.54 (1.16–2.04, P = 0.003).
Results of heterogeneity analysis for each genetic model are shown in Supplementary Table S2. For the allelic model Ph= 0.737, I2= 0%, for the dominant model Ph= 0.822, I2= 0%, for the recessive model: Ph= 0.001, Figure 3. The association of SNP rs760426 (A > G) with RA risk in different genetic models. (A) Allelic model (A vs. G). (B) Dominant model (AG + AA vs. GG). (C) Recessive model (AA vs. AG + GG).
www.nature.com/scientificreports/
I2= 76.7%, for the codominant heterozygous model: Ph= 0.323, I2= 14.2%, and for the codominant homozy- gous model Ph= 0.038, I2= 60.5%. Moderate heterogeneity was found in recessive and codominant homozygous models.
Only four out of 26 ORs were statistically insignificant, and the ORs showed that rs760426 (A > G) SNP is associated an elevated risk. These results therefore suggest a link between AIRE SNP rs760426 (A > G) and RA susceptibility.
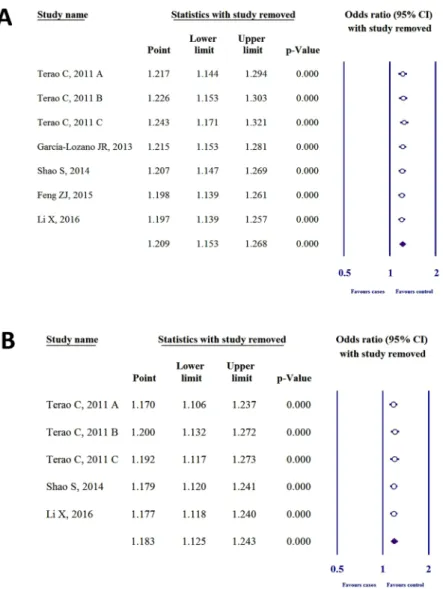
Sensitivity analysis.
To detect the influence of each case-control study on the whole meta-analysis, we performed sensitivity analysis by omitting one individual study. Heterogeneity was not found in SNP rs2075876 or rs760426 by investigating allelic (Fig. 4), dominant, recessive, codominant heterozygous, and codominant homozygous genetic models (see Supplementary Figs S3 and S4).Publication bias.
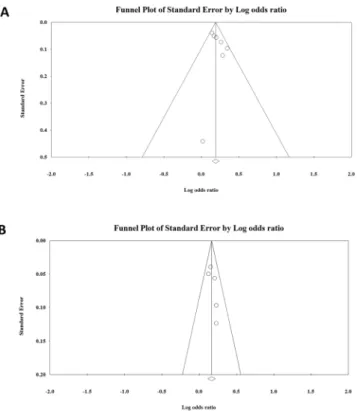
Bias analysis was performed by generating funnel plots for each polymorphism of the allelic (Fig. 5), dominant, recessive, codominant heterozygous, and codominant homozygous genetic models (see Supplementary Figs S5 and S6). After analysis, all funnel plots were perfectly symmetric, and no publication bias was detected for SNP rs2075876 or rs760426.Trial sequential analysis.
We performed a TSA for the allelic models (Fig. 6) of SNPs rs2075876 (G > A) and rs760426 (A > G). Results of allelic models for both polymorphisms showed that the blue line of cumula- tive z-curve crossed the TSA monitoring boundary and the cumulative sample size was reached. Therefore, we observed robust evidence in the association between SNPs rs2075876 (G > A) and rs760426 (A > G) and RA risk.These results suggest that no further studies are necessary to confirm the association.
Figure 4. Sensitivity analysis for the allelic models of (A) SNP rs2075876 (G > A) and (B) rs760426 (A > G).
polymorphism study Genetic model OR 95%CI P
SNP rs2075876 (G > A)
Terao C, 2011
A
Allelic* (A vs. G) 1.21 1.09–1.36 < 0.001
Dominant (AG + AA vs. GG) 1.18 1.06–1.32 0.002
Recessive (AA vs. AG + GG) 1.53 1.31–1.79 < 0.001 Codominant heterozygous (AG vs. GG) 1.08 0.96–1.21 0.168 Codominant homozygous (AA vs. GG) 1.60 1.35–1.89 < 0.001
B
Allelic* (A vs. G) 1.18 1.07–1.30 < 0.001
Dominant (AG + AA vs. GG) 1.31 1.19–1.45 < 0.001
Recessive (AA vs. AG + GG) 1.09 0.95–1.26 0.204
Codominant heterozygous (AG vs. GG) 1.32 1.20–1.47 < 0.001 Codominant homozygous (AA vs. GG) 1.27 1.09–1.48 0.002
C
Allelic* (A vs. G) 1.15 1.06–1.24 < 0.001
Dominant (AG + AA vs. GG) 1.18 1.09–1.27 < 0.001
Recessive (AA vs. AG + GG) 1.25 1.12–1.39 < 0.001
Codominant heterozygous (AG vs. GG) 1.13 1.05–1.23 0.002 Codominant homozygous (AA vs. GG) 1.34 1.19–1.51 < 0.001
García-Lozano JR, 2013
Allelic (A vs. G) 1.02 0.42–2.42 0.964
Dominant (AG + AA vs. GG)
Recessive (AA vs. AG + GG) NA
Codominant heterozygous (AG vs. GG) Codominant homozygous (AA vs. GG)
Shao S, 2014
Allelic* (A vs. G) 1.32 1.04–1.69 0.021
Dominant (AG + AA vs. GG) 1.41 1.08–1.84 0.010
Recessive (AA vs. AG + GG) 1.52 1.13–2.05 0.006
Codominant heterozygous (AG vs. GG) 1.28 0.97–1.70 0.077 Codominant homozygous (AA vs. GG) 1.78 1.26–2.52 0.001
Feng ZJ, 2015
Allelic (A vs. G) 1.30 1.12–1.50 < 0.001
Dominant (AG + AA vs. GG) 1.55 1.32–1.82 < 0.001
Recessive (AA vs. AG + GG) 1.25 1.05–1.49 0.010
Codominant heterozygous (AG vs. GG) 1.51 1.28–1.79 < 0.001 Codominant homozygous (AA vs. GG) 1.62 1.32–1.99 < 0.001
Li X, 2016
Allelic* (A vs. G) 1.41 1.16–1.70 < 0.001
Dominant (AG + AA vs. GG) 1.48 1.22–1.78 < 0.001
Recessive (AA vs. AG + GG) 1.78 1.36–2.35 < 0.001
Codominant heterozygous (AG vs. GG) 1.34 1.10–1.64 0.003 Codominant homozygous (AA vs. GG) 2.09 1.56–2.81 < 0.001
SNP rs760426 (A > G)
Terao C, 2011
A
Allelic* (G vs. A) 1.23 1.10–1.37 < 0.001
Dominant (GG + GA vs. AA) 1.16 1.04–1.29 0.007
Recessive* (GG vs. GA + AA) 1.66 1.43–1.94 < 0.001 Codominant heterozygous* (GA vs. AA) 1.03 0.92–1.16 0.582 Codominant homozygous* (GG vs. AA) 1.69 1.43–2.00 < 0.001 B
Allelic* (G vs. A) 1.13 1.02–1.25 0.011
Dominant (GG + GA vs. AA) 1.19 1.08–1.31 < 0.001
Recessive (GG vs. GA + AA) 1.15 1.00–1.32 0.047
Codominant heterozygous (GA vs. AA) 1.17 1.06–1.30 0.002 Codominant homozygous (GG vs. AA) 1.25 1.08–1.46 0.003
C
Allelic* (G vs. A) 1.16 1.08–1.26 < 0.001
Dominant (GG + GA vs. AA) 1.18 1.09–1.27 < 0.001
Recessive (GG vs. GA + AA) 1.19 1.07–1.32 0.001
Codominant heterozygous (GA vs. AA) 1.15 1.06–1.25 0.001 Codominant homozygous (GG vs. AA) 1.29 1.15–1.44 < 0.001
Shao S, 2014
Allelic* (G vs. A) 1.25 0.98–1.60 0.062
Dominant (GG + GA vs. AA) 1.19 0.92–1.55 0.171
Recessive (GG vs. GA + AA) 1.55 1.16–2.08 0.003
Codominant heterozygous (GA vs. AA) 1.04 0.79–1.38 0.741 Codominant homozygous (GG vs. AA) 1.60 1.15–2.24 0.006
Feng ZJ, 2015
Allelic* (G vs. A) 1.87 1.09–2.45 0.074
Dominant (GG + GA vs. AA)
Recessive (GG vs. GA + AA) NA
Codominant heterozygous (GA vs. AA) Codominant homozygous (GG vs. AA)
Li X, 2016
Allelic* (G vs. A) 1.25 1.04–1.52 0.018
Dominant (GG + GA vs. AA) 1.32 1.10–1.59 0.003
Recessive (GG vs. GA + AA) 1.36 1.05–1.77 0.020
Codominant heterozygous (GA vs. AA) 1.26 1.03–1.54 0.020 Codominant homozygous (GG vs. AA) 1.54 1.16–2.04 0.003
Table 2. ORs, 95% CIs, and P-values for each genetic model in the association of SNPs rs2075876 (G > A) and rs760426 (A > G) with RA risk (NA = not available; OR = odds ratio; CI = confidence interval; * literature data.
www.nature.com/scientificreports/
Discussion
RA is a multifactorial disorder where genetic and environmental events equally contribute to disease commence- ment1,25. The latest GWAS meta-analysis discovered and screened 42 novel RA risk SNPs at a genome level from 98 candidate biological RA risk genes6. The detected risk genes, including AIRE, are mainly in the category of primary immunodeficiency (PID), HIV, and immune dysregulation. With the exception of AIRE, none of the other associated proteins have been directly related to central tolerance6.
Self-tolerance involving negative selection, the machinery of which is directed by AIRE, is a central immuno-physiological process required to create a normal adaptive immune system. We believe that polymor- phisms in this indispensable gene lower the protein expression of AIRE, decrease the presentation of self-antigens, reduce negative selection, and contribute to the escape and survival of autoimmune T-cells. Reaching the periph- ery, matured, autoimmune T-cells are a source of autoantibodies and serve as a medium for numerous immune disorders, including RA. In support of this belief, Lovewell et al.13 have concluded, through a gene reporter assay, that specific haplotypes (AIRE−655G AIRE-230T) can dramatically reduce AIRE transcription. However, with in vitro and in vivo experiments, Kont et al.26 have demonstrated that the presentation of PTAs from mTECs is quantitatively affected by these reductions in AIRE expression.
An in silico investigation by Terao et al.18, which analysed the expression profile of 210 lymphoblastoid cells in the Gene Expression Omnibus (GEO) database, has demonstrated a statistically significant (p < 0.001) correla- tion between the rs2075876 risk allele (A) and decreased AIRE transcription27. No association was found in GEO between rs760426 (G) and AIRE expression. Additionally, García-Lozano et al.19 found statistically significant decreases in the expression levels of rs878081 C allele by analysing GEO database. This SNP is located in the Exon 5 region of AIRE; however, rs2075876 (G > A) is located in Intron 5 and rs760426 (A > G) in Intron 127. The latter SNPs may affect the transcription of AIRE by modifying alternative splicing or intron-mediated enhance- ment28. The reduction in transcription, in turn, provides lower amounts of PTAs ectopically on the major histo- compatibility complex/human leukocyte antigen of mTECs, which thereby contributes to the failure of negative selection in the thymus and increases the survival of autoimmune T-cells. In individuals who carry these SNPs, this sequence increases RA susceptibility. By analysing allelic, dominant, recessive, codominant heterozygous, and codominant homozygous models, we demonstrated that the SNPs rs2075876 (G > A) and rs760426 (A > G) occur more frequently in RA patients than in controls.
There are some limitations in our meta-analysis. We cannot extrapolate the findings of rs2075876 (G > A) and rs760426 (A > G) to Caucasians due to the limited study number. Based on García-Lozano et al.19, the results are not statistically significant; however, rs878081 C allele seemed to occur more frequently in RA patients.
Furthermore, considering GWAS of Terao et al.18, the association of AIRE with RA among Caucasians was not supported. The number of the included studies also limited our meta-analysis; however, Terao et al.18 provided three case-control studies in one publication, which elevated the number of the included epidemiological studies.
In the future, further European case-control, GWAS, and stratified subgroup analyses (age, smoking) are needed in order to better elucidate the association between RA and AIRE polymorphism.
Figure 5. Funnel plots of allelic genetic models of (A) SNP rs2075876 (G > A) and (B) rs760426 (A > G).
To our knowledge, this is the first time that the association between SNP rs2075876 (G > A), rs760426 (A > G), and RA susceptibility was statistically estimated in one meta-analysis. We used multiple haplotype investigations for each polymorphism, sensitivity analyses, and TSA to confirm the robustness of association. In conclusion, our meta-analysis clearly confirmed with each genetic model that the presence of SNPs rs2075876 (G > A) and rs760426 (A > G) is significantly associated with an increased risk for RA.
Methods
Search strategy.
We searched for related literature in the PubMed, Embase, Cochrane Library, and Web of Science databases in accordance with the recommendations of the Preferred Reporting Items for Systematic Reviews and Meta-Analyses (PRISMA) statement29. On 16th May 2017 we completed the search. Keywords (“autoimmune regulator”; “AIRE”; “polymorphism”; “rheumatoid arthritis”) were thoroughly used by two inde- pendent investigators. All studies were published from April 2011 to June 2016.Inclusion and Exclusion criteria.
In order for studies to be included, publications had to demonstrate that (1) the study focused on the association between SNPs or haplotypes within the AIRE gene and RA suscep- tibility, (2) the study was case-control-designed, (3) all RA patients met the American College of Rheumatology classification and diagnostic criteria, and (4) detailed genotype data and feasible ORs, 95% CIs, and p-values were available. Publications were excluded if (1) a previous study was duplicated or (2) the given polymorphism was not found in at least four studies. Review articles were also excluded. Inclusion and exclusion criteria were inde- pendently screened by two investigators.Statistical analysis.
HWE was calculated by the chi-squared test for each study in the control groups.Pooled ORs and 95% CIs were calculated to examine the strength of the association between rs2075876 and rs760426 polymorphisms and RA. We used the random effect model by DerSimonian and Laird30 because of the different ethnicities of those included. Heterogeneity between trials was tested with two methods. First, we employed the Cochrane’s Q homogeneity test, which exceeds the upper-tail critical value of chi-square on k–1 Figure 6. Trial sequential analysis for allelic genetic models of (A) SNP rs2075876 (G > A) and (B) rs760426 (A > G).
www.nature.com/scientificreports/
degrees of freedom, with a p-value of less than 0.10 considered suggestive of significant heterogeneity. Second, we used the inconsistency (I2) index. I2 is the proportion of total variation contributed by between-study variability.
I2 values of 25, 50 and 75% correspond to low, moderate, and high degrees of heterogeneity, respectively, based on Cochran’s handbook31. Sensitivity analyses were performed to identify the influence of each study on the pooled ORs and 95% CIs. Publication bias was examined by visual inspection of funnel plots where the standard error was plotted against the log odds ratio. Meta-analytic calculations were performed with Comprehensive MetaAnalysis software Version 3 (Biostat, Inc., Englewood, NJ, USA).
Trial sequential analysis (TSA).
Meta-analyses may be biased in type I errors owing to an increased risk of random error when sparse data are analysed, combined with reduplicative testing on accumulating data. To avoid this problem and to increase the robustness of conclusions, we used trial sequential analysis (TSA)32–34. TSA com- bines an estimation of the required sample size with an adjusted threshold for statistical significance. The relation- ship between the cumulative z-curve and the trial sequential monitoring boundary shows the expressiveness of the meta-analysis. If the cumulative z-curve crosses the trial sequential monitoring boundary, and the cumulative sample size of the meta-analysis reaches the required sample size, firm evidence can be observed. When the cumulative z-curve crosses the boundaries, but the sample size does not reach the required information size, a sufficient level of evidence for the anticipated intervention effect may have been reached and no further trials are needed. If the z-curve does not cross any of the boundaries and the required sample size has not been reached, evidence to reach a conclusion is insufficient35. For calculation of the information size, we used a heterogeneity adjusted assumption with 10% of relative risk reduction, 5% of overall Type-I-Error, and 10% of Type-II-Error for the case of both gene alleles. The adjusted CIs for rs2075876 and rs760426 are 1.13–1.31 and 1.11–1.26, respec- tively. For calculations we used the Trial Sequential Analysis software tool from Copenhagen Trial Unit, Center for Clinical Intervention Research, Denmark (version 0.9 beta, www.ctu.dk/tsa).All data generated or analysed during this study are included in this published article and its Supplementary information file.
References
1. Scott, D. L., Wolfe, F. & Huizinga, T. W. Rheumatoid arthritis. Lancet 376, 1094–1108 (2010).
2. Cosway, E., Anderson, G., Garside, P. & Prendergast, C. The thymus and rheumatology: should we care? Curr. Opin. Rheumatol. 28, 189–195 (2016).
3. Viatte, S., Plant, D. & Raychaudhuri, S. Genetics and epigenetics of rheumatoid arthritis. Nat. Rev. Rheumatol. 9, 141–153 (2013).
4. Starr, T. K., Jameson, S. C. & Hogquist, K. A. Positive and negative selection of T cells. Annu. Rev. Immunol. 21, 139–176 (2003).
5. Mellado, M. et al. T Cell Migration in Rheumatoid Arthritis. Front. Immunol. 6, 1–12 (2015).
6. Okada, Y. et al. Genetics of rheumatoid arthritis contributes to biology and drug discovery. Nature 506, 376–381 (2014).
7. Colobran, R., Giménez-Barcons, M., Marín-Sánchez, A., Porta-Pardo, E. & Pujol-Borrell, R. AIRE genetic variants and predisposition to polygenic autoimmune disease: The case of Graves’ disease and a systematic literature review. Hum. Immunol. 77, 643–651 (2016).
8. Nagamine, K. et al. Positional cloning of the APECED gene. Nat. Genet. 17, 393–398 (1997).
9. Finnish-German, A. P. E. C. E. D. Consortium. An autoimmune disease, APECED, caused by mutations in a novel gene featuring two PHD-type zinc-finger domains. Nat. Genet. 17, 399–403 (1997).
10. Mathis, D. & Benoist, C. Aire. Annu. Rev. Immunol. 27, 287–312 (2009).
11. Anderson, M. S. & Su, M. A. Aire and T cell development. Curr. Opin. Immunol. 23, 198–206 (2011).
12. Heino, M. et al. APECED mutations in the autoimmune regulator (AIRE) gene. Hum. Mutat. 18, 205–211 (2001).
13. Lovewell, T. R., McDonagh, A. J., Messenger, A. G., Azzouz, M. & Tazi-Ahnini, R. The AIRE -230Y Polymorphism Affects AIRE Transcriptional Activity: Potential Influence on AIRE Function in the Thymus. PLoS One. 10, e0127476 (2015).
14. Tazi-Ahnini, R. et al. The autoimmune regulator gene (AIRE) is strongly associated with vitiligo. Br. J. Dermatol. 159, 591–596 (2008).
15. Wengraf, D. A. et al. Genetic analysis of autoimmune regulator haplotypes in alopecia areata. Tissue Antigens. 71, 206–212 (2008).
16. Conteduca, G. et al. The role of AIRE polymorphisms in melanoma. Clin. Immunol. 136, 96–104 (2010).
17. Ferrera, F. et al. AIRE gene polymorphisms in systemic sclerosis associated with autoimmune thyroiditis. Clin. Immunol. 122, 13–17 (2007).
18. Terao, C. et al. The human AIRE gene at chromosome 21q22 is a genetic determinant for the predisposition to rheumatoid arthritis in Japanese population. Hum. Mol. Genet. 20, 2680–2685 (2011).
19. García-Lozano, J. R. et al. Association of the AIRE gene with susceptibility to rheumatoid arthritis in a European population: a case control study. Arthritis Res. Ther. 15, R11 (2013).
20. Shao, S., Li, X. R., Cen, H. & Yin, Z. S. Association of AIRE polymorphisms with genetic susceptibility to rheumatoid arthritis in a Chinese population. Inflammation. 37, 495–499 (2014).
21. Feng, Z. J., Zhang, S. L., Wen, H. F. & Liang, Y. Association of rs2075876 polymorphism of AIRE gene with rheumatoid arthritis risk.
Hum. Immunol. 76, 281–285 (2015).
22. Li, X., Li, T., Chen, M. & Chai, Y. Association of AIRE gene polymorphisms with susceptibility to rheumatoid arthritis among ethnic Han Chinese from Shaanxi. Chin. J. Med. Genet. 33, 373–377 (2016).
23. Xu, Y. S., Jiang, X. J. and Chen, J. M. A single nucleotide polymorphism of AIRE gene located in the 21q22. 3 increases the risk of rheumatoid arthritis. Oncotarget (2017).
24. Arnett, F. C. et al. The American Rheumatism Association1987 revised criteria for the classification of rheumatoid arthritis. Arthritis Rheum. 31, 315–324 (1988).
25. van der Woude, D. et al. Quantitative heritability of anti-citrullinated protein antibody-positive and anti-citrullinated protein antibody-negative rheumatoid arthritis. Arthritis Rheum. 60, 916–923 (2009).
26. Kont, V. et al. Modulation of Aire regulates the expression of tissue-restricted antigens. Mol. Immunol. 45, 25–33 (2008).
27. Stranger, B. E. et al. Relative impact of nucleotide and copy number variation on gene expression phenotypes. Science 315, 848–853 (2007).
28. Rose, A. B. Intron-mediated regulation of gene expression. Curr. Top. Microbiol. Immunol. 326, 277–290 (2008).
29. Moher, D. et al. Preferred reporting items for systematic review and meta-analysis protocols (PRISMA-P) 2015 statement. Syst. Rev.
4, 1 (2015).
30. DerSimonian, R. & Laird, N. Meta-analysis in clinical trials revisited. Contemp. Clin. Trials 45, 139–145 (2015).
31. The Cochrane Collaboration Cochrane Handbook for Systematic Reviews of Interventions Version 5.1.0 (eds. Higgins, J. P. T. &
Green, S.; John Wiley & Sons, 2011)
32. Turner, R. M., Bird, S. M. & Higgins, J. P. The impact of study size on meta-analyses: examination of underpowered studies in Cochrane reviews. PLoS One 8, e59202 (2013).
33. Wetterslev, J., Thorlund, K., Brok, J. & Gluud, C. Trial sequential analysis may establish when firm evidence is reached in cumulative meta-analysis. J. Clin. Epidemiol. 61, 64–75 (2008).
34. Brok, J., Thorlund, K., Wetterslev, J. & Gluud, C. Apparently conclusive meta-analyses may be inconclusive–Trial sequential analysis adjustment of random error risk due to repetitive testing of accumulating data in apparently conclusive neonatal meta-analyses. Int.
J. Epidemiol. 38, 287–298 (2009).
35. Wetterslev, J., Thorlund, K., Brok, J. & Gluud, C. Estimating required information size by quantifying diversity in random-effects model meta-analyses. BMC Med. Res. Methodol. 9, 86 (2009).
Acknowledgements
This study was supported by grants from the Medical School, University of Pécs, Hungary (No. PTE- AOK-KA-2017). The present scientific contribution is dedicated to the 650th anniversary of the foundation of the University of Pécs, Hungary.
Author Contributions
B.B., P.H., and Z.G. designed this study; B.B. and G.G. searched databases and collected full-text papers; B.B., G.V. and J.B. extracted data; K.F., B.E., and L.C. analysed data; B.B., H.A., and É.V. wrote the manuscript; Z.R., K.S., B.K., and Z.G. reviewed the manuscript. All of the authors have read and approved the final version of the manuscript.
Additional Information
Supplementary information accompanies this paper at https://doi.org/10.1038/s41598-017-14375-z.
Competing Interests: The authors declare that they have no competing interests.
Publisher's note: Springer Nature remains neutral with regard to jurisdictional claims in published maps and institutional affiliations.
Open Access This article is licensed under a Creative Commons Attribution 4.0 International License, which permits use, sharing, adaptation, distribution and reproduction in any medium or format, as long as you give appropriate credit to the original author(s) and the source, provide a link to the Cre- ative Commons license, and indicate if changes were made. The images or other third party material in this article are included in the article’s Creative Commons license, unless indicated otherwise in a credit line to the material. If material is not included in the article’s Creative Commons license and your intended use is not per- mitted by statutory regulation or exceeds the permitted use, you will need to obtain permission directly from the copyright holder. To view a copy of this license, visit http://creativecommons.org/licenses/by/4.0/.
© The Author(s) 2017