CARDIOVASCULAR AND ANTHROPOMETRIC TWIN STUDIES
PhD thesis
Ádám Domonkos Tárnoki
Basic Medicine Doctoral School Semmelweis University
Supervisor: Viktor Bérczi MD, D.Sc Official reviewers:
Attila Cziráki MD, Ph.D Zsuzsanna Putz MD, Ph.D
Head of the Final Examination Committee:
Zoltán Benyó MD, D.Sc
Members of the Final Examination Committee:
Attila Doros MD, Ph.D
Zsuzsanna Monostori MD, Ph.D
Budapest, 2013
Cardiovascular and anthropometric twin studies
Table of Contents
1. Introduction 6
1.1. Background of twin studies 6
1.2. Cardiovascular twin studies outside Hungary 15 1.3. Arterial stiffness and hemodynamic variables 17
1.3.1. Biomechanic background of arterial stiffness
hemodynamic variables 18
1.3.2. Noninvasive measurement of arterial stiffness 23
1.4. Carotid intima-media thickness 25
1.5. Anthropometric cardiovascular risk factors and their assessment
modalities 27
2. Objectives 31
3. Methods 33
3.1. Subjects 33
3.1.1. Sample of the hemodynamic study 33
3.1.2. Sample of the carotid intima-media thickness study 33 3.1.3. Sample of the anthropometric study 33
3.2. Study design 34
3.3. Hemodynamic measurement 35
3.4. Carotid ultrasonography (IMT measurement) 36
3.5. Assessment of body composition 38
3.6. Statistical analysis 39
3.6.1. Risk factor assessment 39
3.6.2. Estimating genetic influence on hemodynamic, carotid
intima-media thickness and body composition parameters 39 3.6.3. Estimating the correlation between arterial stiffness and
carotid intima-media thickness parameters 41
4. Results 42
4.1. Clinical characteristics 42
4.2. Results of the hemodynamic twin study 48
4.2.1 Genetic and environmental effects on hemodynamic
components 48
4.2.2 Phenotypic correlation between brachial and central blood pressure, pulse pressure and arterial stiffness 49 4.2.3 Genetic covariance of brachial and central blood pressure,
pulse pressure and arterial stiffness 50
4.3. Results of the carotid intima-media thickness twin study 52 4.3.1 Genetic and environmental effects on carotid IMT 52 4.3.2 Correlation between carotid IMT variables, arterial stiffness
and augmentation index 53
4.4. Results of anthropometric twin study 59
4.4.1 Univariate model describing the heritability of
body composition 59
4.5. Summary of the univariate model results of the three substudies 61
5. Discussion 62
5.1. Role and importance of moderate heritability on hemodynamic
variables 62
5.2. Role and importance of low to moderate heritability on carotid
IMT variables 68
5.3. Clinical implications of high heritability on body composition 71
6. Conclusions 74
7. Summary 75
8. Összefoglaló 76
9. Bibliography 78
10. Bibliography of own publications 104
11. Acknowledgements 108
The list of Abbreviations
A = additive genetic influence AC = arterial compliance
AIC = Akaike‘s Information Criterion AIx = augmentation index
BIA = bioelectrical impedance analysis BMI = body mass index
BP = blood pressure
C = common familial environmental factors CC = correlation coefficient
CCA = common carotid artery CI = confidence interval CT = computed tomography CVD = cardiovascular disease
D = non-additive (dominant) genetic factors DBP = diastolic blood pressure
DD = diastolic intraluminal diameter Di = distensibility
DNA = deoxyribonucleic acid DZ = dizygotic
E = unique environmental factors
GWAS = genome wide association study ICA = internal carotid artery
IMT = intima-media thickness MRI = magnetic Resonance Imaging MZ = monozygotic
P = probability PP = pulse pressure
SBP = systolic blood pressure
SID = systolic intraluminal diameter SD = standard deviation
SNP = Single Nucleotide Polymorphism USA = United States of America
V = arterial volume
1. Introduction
1.1. Background of twin studies
The subject of „nurture or nature‖ has always been a question in medicine, namely, whether genetic or environmental effects determinate a certain trait. In the 19th century, determinism and indeterminism represented the two inordinated viewpoints (Métneki 2005). While the deterministics believed that genetic traits are already defined at birth and definitely specify the individual‘s walk of life (without any environmental effects), indeterministics showed evidences that the environment and the education is essential only (Métneki 2005).
Nowadays we know that the source of different traits derives from environmental and/or genetic effects as well. There are diseases which are only genetically defined without any role of environmental factors (eg., chromosome or monogenous defects), or determinated by the environment only (eg., infections, nutritional disorders, injuries). However, most of the traits (diabetes, hypertension, epilepsy, etc.) have multifactorial background, namely, both genetic and environmental factors have importance, but in different portions. Francis Galton, grandnephew of Darwin realised in the 19th century that twin studies are of help to calculate the portion of genetic and environmental influence in percentage in case of any traits (Métneki 2005).
Monozygotic (MZ) twins share nearly 100% of their genes, since the two embrios originate from one fertilized egg (Figure 1). Therefore, the observed differences between the two members of a monozygotic twin pair are attributed to environmental factors (Métneki 2005). The timing of the division of the fertilized egg determinates whether the monozygotic twin embrios will develop in the same or different caul, and if the nutrition will be provided from identical or different placenta. Accordingly, monozygotic twins may be dichorionic diamnionic (in case of early detachment: on the 2nd - 3rd day after fertilization), monochorionic diamnionic (if the detachment happens on the 4-8th days after fertilization), and finally, monochorionic monoamnionic (in case of late detachment after the 9th day
after fertilization). Accordingly, monozygotic twins can be only same-sex, and their all genetically determinated traits (eg., blood group) are the same (Métneki 2005).
On the other hand, fraternal or dizygotic (DZ) twins share 50% of their genes, as the not at the same time born siblings, therefore, the observed differences between the members of a dizygotic twin pair are due to either genetic or environmental effects. Dizygotic twinning happens if two offsprings born of the same pregnancy and develop from two ova that were released from the ovary simultaneously and fertilized at the same time. Dizygotic twins may be of either same or opposite sex, and have two separate and distinct placentas and membranes, therefore, they are always dichorionic diamnionic. Nearly two-third of the twin pregnancies are dizygotic (Métneki 2005).
Figure 1. Development of identical and fraternal twins
Twin studies contribute to the discovery of the relationship of genes, environment and diseases, and help to explore the source and genetic determinacy of disorders.
Nowadays, twin studies are combined with new gene technologies and have an
outstanding importance in gene localisation and exploring metabolic pathways which might open new ways in prevention and therapy (Métneki 2005).
Genetic etiology of a disease (Métneki 2005):
Gene variant
↓
Gene expression
↓ Gene product
↓
Altered physiology
↓ Phenotype
Nowadays, three types of twin studies include classical twin studies (1), the investigation of only monozygotic twins (2), and monozygotic twins reared apart (3) (Métneki 2005).
1. Classical twin study design involves both monozygotic and dizygotic twins.
Higher correlation in monozygotic than in dizygotic twin pairs provides evidence for additive genetic influence (A) on a phenotype (effects due to genes at multiple loci or multiple alleles at one locus). Similarity of correlations suggests a contribution of the common familial environmental factors (C) shared by the twins (e.g., familiar socialization, diet, exposure to high levels of air pollution, shared womb, etc.). Finally, unique environmental factors (E), or unshared environmental factors that affect one twin but not the other, are estimated using the deviation from perfect MZ co-twin correlation (Neale et al 2006). Univariate quantitative genetic A-C-E models are fitted to decompose phenotypic variance of the considered parameters into additive genetic effects, or heritability (Neale et al 2006). The A-C- E model is able to estimate these components by capitalizing on several reasonable assumptions (Figure 2). Thus, identical twins share their genome (r=1.0) while this correlates r=0.5 for fraternal twins. Moreover, on average both monozygotic and
monozygotic and dizygotic twins). Accordingly, environmental confounders are minimized because twin children are usually exposed to similar environments. The unique environment of co-twins remains uncorrelated for both zygosities. In the structural equation model, A-C-E components are latent variables but these variables for both co-twins are related to each other based on the described structure giving us the possibility to estimate the proportions of interest. In addition, longitudinal classical twin studies are useful for investigating the longitudinal contribution of genes on a phenotype (Métneki 2005, Neale et al 2006).
Figure 2. Univariate A-C-E model. Rectangles denote the observed variables (i.e., cardiovascular or anthropometric parameters) and circles denote the latent variables. Curved arrows denote correlations (fixed at the highlighted values).
Straight arrows signify the estimated impact of the latent factor on variance of the observed phenotype. Letters A, C, and E stand for additive genetic, common environmental, and unique environmental influences, respectively. (Courtesy of Dr.
Tamás Horváth, Institute of Human Physiology and Clinical Experimental Research, Semmelweis University, Budapest, Hungary)
2. Investigation of only monozygotic twins is of the increasing interest of current twin research (Métneki 2005). Disturbance of DNA methylation leading to aberrant gene expression has been implicated in the etiology of many diseases. Since monozygotic twins share a common DNA sequence, their study represents an ideal design for investigating the contribution of epigenetic factors to a disease etiology (Métneki 2005). In the recent years, therefore, twin
researchers have been started to focus on monozygotic twin pairs discordant for a phenotype (eg., obesity) in order to assess the influence of epigenetic factors which are responsible for discordance between the members of monozygotic twin pairs. These epigenetic factors mean cellular modifications (usually comprise DNA methylation and histone modifications) that can be heritable to the next generation, but appear unrelated to DNA sequence changes, and can be modified by environmental stimuli (Bell and Spectoral 2011, Holliday 1994).
Recent studies have focused on the investigation of DNA methylation patterns in twins, and reported increasing differences in epigenetic profile by aging due to common or unique environmental exposures (eg., X-chromosome inactivation patterns) (Kaslow et al 1987, Vickers 2001, Fraga 2005). The most interesting first study assessed the epigenetic profile (DNA methylation and histone acetylation) at multiple genomic regions in 3-year-old and 50-year-old monozygotic twins and reported highly similar intrapair epigenetic profiles, whose epigenetic variability increased with age across multiple tissues especially in twins with greater difference in lifestyle (Fraga 2005).
Furthermore, genome-wide analysis of DNA methylation on peripheral blood DNA samples are obtained on these samples of monozygotic twin pairs discordant for a certain disease (Fraga 2005).
3. The most challenging twin study profile is the examination of monozygotic twins reared apart which is appropriate for studying genetic effects in different environments (Métneki 2005). Mainly psychologic studies are carried on these kind of twin pairs, however, it is getting even more difficult to collect enough sample due to less frequent switch-baby incidents in the hospital (Jonason 2012, Segal and Stohs 2007, Segal 2009).
Twin studies have advantages in comparison with family and genome wide association studies (GWAS) or whole genome association studies which will be discussed later.
Family-based association studies assess the appearence of an investigated phenotype in a multi-generation model and thus provide important information on the genetic etiology of certain disease traits via considering transmission of genotype within a family (Cupples 2008). These kind of studies not only identify and quantify the family risk and heritability of certain phenotypes but also permit segregation, linkage and association analyses, and have importance even in the modern GWAS era (Cupples 2008). The favorable features of family studies are the following (Borecki and Province 2008): 1. Studies of extended pedigrees or nuclear families, are likely to represent a more homogeneous and limited set of causative genes and pathways which enhance statistical power for gene discovery. In addition, this advantage leads to discovery of novel loci and pathways (Borecki and Province 2008). 2. Because family members share a predictable extent of their genetic background and environmental exposures identical-by-descent, the background genetic variation is controlled to some extent as a function of the degree of relationship, which can be modeled as a polygenic component (Borecki and Province 2008).
We must note that familial aggregation of a phenotype does not necessarily indicate that the disease is primarily determined by genetic components. Non-genetic factors may have similar effect on observed phenotypic variance since families share not only gene polymorphisms, but also many cultural, behavioral, and dietary habits that define critical environmental exposures (Susser and Susser 1987). An important drawback of family studies is that even if they are useful to determine inter-generation resemblance or difference, but these kind of studies cannot reliably distinguish heritability and common environmental effects (Susser and Susser 1987). Thus, genetic variance can be confounded by shared environmental factors that exist among related individuals and are usually environmentally context- specific (Susser and Susser 1987). Heritability estimates for individuals exclusively from one environment might differ from those calculated for individuals from disparate environments (Vitzthum 2003). Therefore, better understanding may be derived from studies based on the twin design, which is particularly suitable to distinguish heritability from effects of shared and unshared environmental influence. Accordingly, twin studies can take the shared family environment into
account, including potentially deleterious and confounding effects (eg., salt intake, alcohol use, and lack of physical exercise).
Two general ways for gene discovery include linkage and association studies (Borecki and Province 2008, Borecki and Province 2008). Linkage studies investigate the alleles at loci that are close together to be transmitted together as an intact unit (haplotype) within families („where is the gene?‖) (Borecki and Province 2008). For linkage studies, DZ twin pairs can be also studied as sib-pairs since they perfectly match their ages and thus reduce the environmental variation affecting the phenotype (Borecki and Province 2008). On the other hand, MZ twins are used to estimate allele frequencies for the markers tested (Luft 2001). By contrast, association studies can be performed either in families or in unrelated individuals.
GWAS provides an opportunity to comprehensively examine associations of genetic variation with disease phenotypes.
On the course of GWAS, DNA is extracted from collected blood specimens of two groups (case-control method: a person with disease and another without), and the investigated gene variants are characterized using Single Nucleotide Polymorphisms (SNPs) represented on chips (these are usually high-density custom arrays that capture DNA variation at regions identified by well-powered GWAS meta-analyses for diseases and traits) and finally compared. Accordingly, if one allele is more frequent in the individuals with the investigated disease, the SNP is said to be "associated" with that certain disease. Although recent genome-wide studies have yielded to valuable genetic results on various traits by investigating the entire genome, only a relatively little of the heritability of most complex traits have been explained (Eichler et al 2010). This debate has led to the search of the 'missing heritability' of complex diseases. Accordingly, genome-wide linkage analysis usually underreport heritability (Vineis and Pearce 2010, Eichler et al 2010).
Limitation of twin studies must be noted (Pearson 2008). Environmental exposures may not be identical even in MZ twins. MZ twins can have different gene expressions. The risk of the genotype may be heterogenous between twin
pairs. Ascertainment bias: Co-twin with disease is more likely to participate in twin studies as compared to unaffected co-twin (Pearson 2008).
Statistical twin study methods
1. The basic univariate quantitative genetic A-C-(D)-E model, which was described briefly above, is able to estimate the contribution of additive genetic (A), non-additive genetic (D), common or shared environmental (C) and unique or unshared (E) environmental variance components (Neale and Cardon 1992, Littvay 2012) (Figure 2). A descriptive estimate of the genetic influence on a single trait can be calculated using the within-pair (co-twin) correlation in MZ and DZ pairs separately. A higher within-pair correlation in MZ than in DZ pairs provides evidence for existing genetic influences on the phenotype (Neale and Cardon 1992, Littvay 2012). Structural equation modeling is used to estimate the genetic and environmental influences on the investigated variables as well as the degree to which genetic and environmental factors overlap with another trait. According to the classical twin study methodology, genetic variation can be divided into additive and dominant genetic effects, which have an expected correlation of 1 within MZ pairs and correlations of 0.5 and 0.25, respectively, within DZ pairs. The A component refers to the sum of the allelic effects on the phenotype over all susceptible loci, whereas D refers to interaction effects between alleles at the same locus. The environmental variation can be either common to both twins within a pair or unique to each twin individual, and has (by definition) a correlation of 1 and 0, respectively, within both MZ and DZ twin pairs. The common environment includes all environmental factors that make the twin pair similar for the trait, such as shared childhood experiences or parental socioeconomic status. The unique environment includes all environmental factors and experiences that make the twin pair dissimilar, such as diseases or accidents that have affected only one sibling within a pair. The E component also includes measurement error. In case of a relatively small sample size the degrees of freedom is not strong enough to analyze the four components (A, D, C, E) together. Accordingly, three components are usually measured (if no additive genetic effect is present, it is not worth to examinate the dominant genetic influence) (Neale and Cardon 1992, Littvay 2012).
In case of a large sample size, different combinations of these components (e.g.
ACE, ADE, AE, CE) can be hypothesized to account for the pattern of variation in twin data, but effects due to dominance and common environmental effects cannot be estimated simultaneously with data limited to that from twins reared together (Hansen et al 2007).
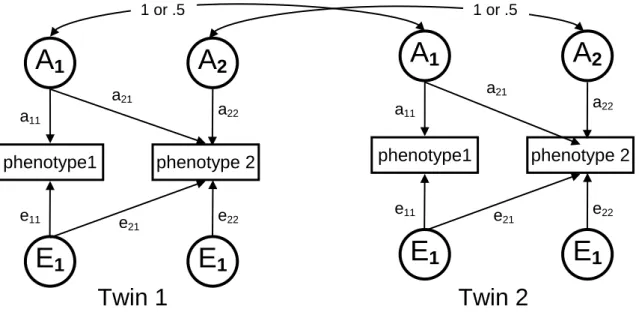
2. Beyond the classical A-C-E model, a bivariate Cholesky decomposition model can be also carried out to derive the magnitude of covariation between two investigated phenotypes of interest and to estimate what proportion of this correlation is attributable to common underlying genetic and environmental factors (Figure 3) (Neale and Cardon 1992, Littvay 2012). In order to estimate the amount of overlap between genes or environment that influences the two parameters, genetic (rg) and environmental correlations (rc, re) between a pair of measures are calculated. For example, the genetic correlation indicates the extent to which genetic effects on one trait correlate with genetic effects on another trait, independently of the heritability of the two traits. A genetic correlation of 1.0 would indicate that genetic influences on the two traits completely overlap, whereas a genetic correlation of 0 would indicate that entirely different genes influence the two traits. By including the heritability of the measures, it is also possible to estimate the extent to which genetic and environmental factors contribute to the observed phenotypic correlation between two traits (bivariate heritability) and the extent to which the two traits share common genetic variance (rg^2) (Neale and Cardon 1992, Littvay 2012).
3. For both univariate and bivariate modeling, the significance of each parameter in the model is tested by dropping the parameter and evaluating the change in −2 log likelihood between the full model and the nested submodel.
Model comparisons are made with likelihood ratio χ2 tests, where a significant change in χ2 indicates that dropping the parameter significantly decreases model fit, suggesting that the parameter should be retained in the model. Akaike‘s Information Criterion (AIC) is always used to compare non-nested models. Within-
sex, and further adjustments can be also taken into account after rank- transformation to normality of the outcome variables (Neale and Cardon 1992, Littvay 2012).
Figure 3. Path diagram of the bivariate Cholesky AE model
Squares represent the observed variables. Circles represent latent variables, including additive genetic (A) and unique environment (E) components. a11, Additive genetic influence acting on phenotype 1. a22, Additive genetic influence acting on phenotype 2. e11, unique environmental influence acting on phenotype 1,
e22, unique environmental influence acting on phenotype 2. a21, genetic covariance between phenotype 1 and phenotype 2. e21, unique environmental
covariance between phenotype 1 and phenotype 2.
1.2 Cardiovascular twin studies outside Hungary
Twins have always been important ‘tools‘ in the cardiovascular genetic research.
Blood pressure was the first investigated cardiovascular trait which was shown to be heritable in a German twin study (Weitz 1925, Frohlich 1937, Luft 2001).
Several years later, an English twin study certified the heritability of blood pressure
phenotype1 phenotype 2
Twin 1
A
1Twin 2
a11
e11
a21
a22
e21 e22
E
1A
2E
1phenotype1 phenotype 2
A
1 a11e11
a21
a22
e21 e22
E
1A
2E
11 or .5 1 or .5
in school children (Stocks 1930). In the past decades, numerous twin studies assessed the heritability of blood pressure in order to search for ethnic and age group differences in genetic predisposition of these phenotypes (Borhani et al 1976, Hong et al 1994, Rao et al 1993, Somes et al 1995, Grim et al 1990). In addition, intermediary blood pressure phenotypes, such as components of the renin- angiotensin and sympathetic nervous system (plasma aldosterone, catecholamines), renal function, and the facility in excreting electrolytes, turned to be also heritable beyond blood pressure traits (Luft 2001).
Beyond the blood pressure traits, further cardiovascular phenotypes have been also studied in twins. In the early 1990‘s, cardiovascular reactivity was studied in an adult male American twin cohort (Carmelli et al 1991). Genetic influence was found in blood pressure reactivity to the mental arithmetic task after adjustments for baseline and performance, but no genetic variance for blood pressure reactivity to the cold pressor test was observed (Carmelli et al 1991). In addition, numerous twin studies reported heritability values of traditional cardiovascular risk factors, eg.
lipoproteins, alcohol consumption or obesity (Lamon-Fava et al 1991, McGue et al 1992, Carmichael et al 1995). Additional studies were also carried out concerning blood pressure regulation which yielded to identification of blood pressure-related SNPs, such as on β-2 AR gene which underscored the importance of the β-2 AR gene to blood pressure regulation, heart size, and probably to the development of hypertension (Luft 2001, Busjahn et al 2000). In the recent decades, studies aimed to explore the genetic contribution to the newly „detected‖ blood pressure-related phenotypes, such as central blood pressure, arterial aging and arterial stiffness which will be described below in more detail.
Thanks to twin studies, it was also shown that genetic effects have an important influence in the development of certain heart and vascular diseases as well (Berg 1987, Lindpaintner 1994, Busjahn et al 1998, Busjahn et al 1999). For example, cardiac hypertrophy, arrythmia, long QT associated sudden cardiac death and coronary heart disease was also turned to be heritable (Berg 1987, Lindpaintner 1994, Busjahn et al 1998, Busjahn et al 1999).
Due to the increasing number of investigable cardiovascular phenotypes, twin studies will continue to gain in importance and utility, particularly in elucidating normal human genetic diversity in the future (Luft 2001).
1.3 Arterial stiffness and hemodynamic variables
Blood pressure regulation involves complex interactions among genetic and nongenetic factors, providing major challenges to dissection of the genetic components that influence blood pressure and hypertension. Twin studies (Vinck et al 2001, Snieder et al 2003) and nuclear family studies (Knuiman et al 1996, Mitchell et al 1996, An et al 1999, Rotimi et al 1999, Livshits and Gerber 2001, North et al 2003) have shown that a sizeable proportion of systolic blood pressure and diastolic blood pressure variance is due to the effect of genes. More limited data are available on the heritability of pulse pressure (Mitchell et al 2005, Bochud et al 2005, Fava et al 2004, van Rijn et al 2007) and of central pressure (Cecelja et al 2009). Arterial stiffness is regulated by the amount, density and spatial organization of stiff wall material (Laurent et al 2005). Changes in the expression of genes associated with cell signaling and mechanical regulation of vascular structure may play an equally important role in the regulation of arterial stiffness (Durier et al 2003). In recent years, several genes associated with the renin- angiotensin-aldosterone system, beta-adrenergic and endothelin receptors, inflammatory molecules, and the transcriptional pathways controlling gene expression, differentiation of vascular smooth muscle cells, apoptosis of endothelial cells, and the immune response within the vascular wall have all been associated with arterial stiffness (Lacolley et al 2009). Although there is a consensus that genetic factors play a role in atherogenesis (Franklin et al 2009), the precise magnitude of the genetic influence and association of arterial stiffness, central systolic blood pressure and pulse pressure is poorly described.
1.3.1 Biomechanic background of arterial stiffness and hemodynamic variables
In recent decade, great emphasis has been placed on the role of arterial stiffness in the development and management of cardiovascular diseases. Arterial stiffness is a dynamic property, determined both by vascular function like vascular smooth muscle tone and by the structure of the vessel wall like elastin/collagen content (Van Bortel et al 2002). Arterial stiffness is inversely related to arterial distensibility (Di), which is considered a determinant of stress on the vessel wall and defined as the relative change in volume per unit of pressure ([ΔV/V]/ΔP) (Safar and London 1994). In addition, arterial compliance (C) is also an important vessel wall property which is defined as the change in volume per unit of pressure (ΔV/ΔP) and reflects the afterload on the heart and the buffering function of the vessel (Lévy and Safar 1990, Guyton 1986, Van Bortel et al 1995). Arterial compliance is related to arterial distensibility (Di) and arterial volume (V) by the formula C=Di×V (Guyton 1986).
Pulse wave velocity is inversely related to arterial wall distensibility and its calculation is a widely used method. Pulse wave velocity (as an arterial distensibility index) can be calculated from measurements of pulse transit time and the distance traveled by the pulse between two recording sites (eg., carotid-femoral) (Avolio 1991). Determination of pulse wave velocity enables one to evaluate indirectly arterial distensibility and stiffness.
New risk factors have been determined in 2007 Guidelines for the Management of Arterial Hypertension including increased arterial stiffness (Mancia et al 2007). According to this latest guideline, an increase in arterial stiffness, due to pathological changes in large artery walls, is a direct measure of target organ damage (Mancia et al 2007). Endothelial dysfunction, associated with altered arterial stiffness, is a marker of increased cardiovascular risk (Kuvin et al 2001).
Pulse wave velocity (PWV) can be estimated non-invasively and has an independent predictive value for cardiovascular events (Laurent et al 2006).
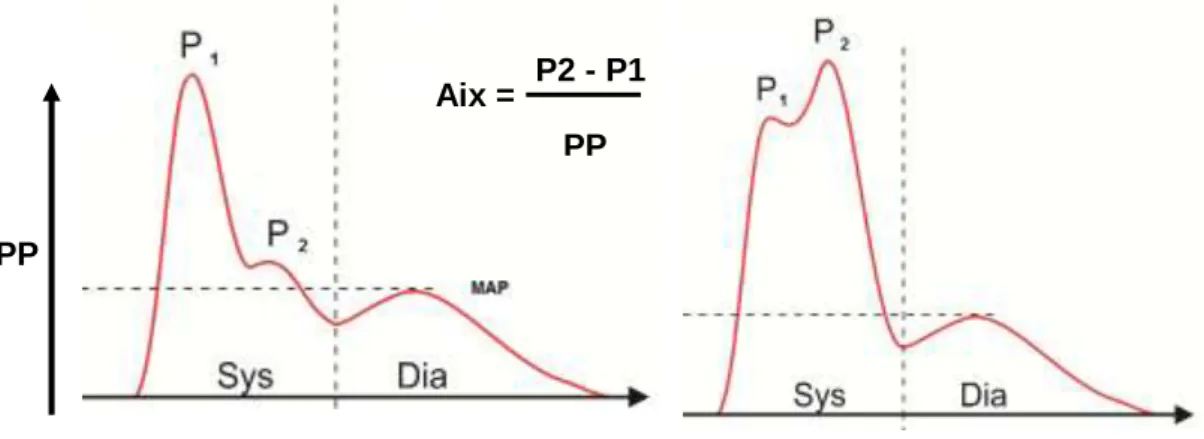
Augmentation index (AIx) is given by the ratio of the augmentation pressure and
wave reflection (Snieder et al 2000) (Figure 4). Augmentation indices can be calculated both at brachial and aortic sites.
Figure 4. Measurement of augmentation index.
Augmentation index informs us about wave reflection. Two characteristic pulse waveforms can be distinguished. The first reflected wave (P1) is a foreward wave
following the heart ejection, and the second one (P2) is the reflection from the periphery, coming still in systole (reflected wave). Normally, the second peak is located the amplitude of the first peak (on the left). In case of impaired vascular function (on the right), as the peripheral vascular function is getting worse, the wave reflection increases (pulse pressure, PP). The augmentation index shows the
difference between the two peaks’ heights and gives an evaluable and understandible value of this increase.
Courtesy of Ágnes Lannert and Balázs Varga (Medexpert Ltd.)
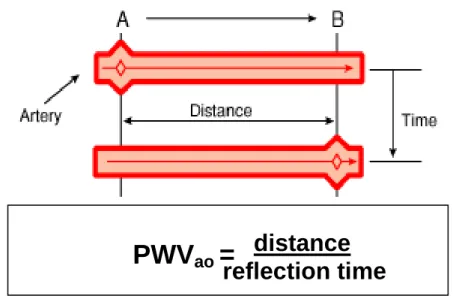
PWV, the most important measure of arterial stiffness, is characterized by the distance traveled (s) by the wave divided by the time (t) for the wave to travel that distance (Figure 5):
PWV = ∆s/∆t.
PP
P2 - P1 PP Aix =
Figure 5. Measurement of aortic pulse wave velocity based on forward traveling wave between points A and B. Courtesy of Ágnes Lannert and Balázs Varga
(Medexpert Ltd.)
It has also been shown that measurement of arterial vascular stiffness and wave reflection can stratify patients with a high risk of cardiac and cerebral events who might profit from more aggressive cardiovascular treatment (Baulmann et al 2004, Nilsson et al 2009). It is well known that arterial stiffness increases with age mainly due to the development of isolated systolic hypertension in elderly (Zeki et al 2013). In addition, certain diseases are also related to increased arterial stiffening, such as diabetes mellitus, hypercholesterolaemia, hypertension and end-stage renal disease (Glasser et al 1997). In general, these conditions increase the central stiffness due to the infavorable effect of risk factors resulting less compliant central arteries (Figure 6.). On the course of pulse wave analysis, the properties of the pressure pulse wave, which travels from the heart toward the peripheral arteries, are analysed (eg., amplitude, frequency). Frequency domain analysis allows the analysis of the pulse pressure wave at the aorta in time. Augmentation pressure is the increase of the pulse pressure wave due to the reflected wave. This pulse pressure amplification occurs in the large elastic and smaller conduit arteries in association with changes in the magnitude (amplitude) of each harmonic
PWV
ao= distance
reflection time
Figure 6. Development of arterial stiffening.
A. In healthy arteries the situation is the following: because of the tissue differences (elastic aorta, having the windkessel function and less elastic muscular type peripheral arteries) the blood pressure differs in the central arteries (aortic root)
from the periperal measured, and is lower in the elastic part.
B. If the total peripheral resistance and/or the cardiac output increases (among other factors), and the arteries have less compliance due to the infavorable effect of
risk factors, higher blood pressure can be measured in the aorta, while such a big difference cannot be observed in the periphery (brachial blood pressure).
Accordingly, worsening arterial function has unfavorable hemodynamic effects for the central arteries and the heart. Lower pulse pressure amplification increases the
left ventricular afterload due to the increased stiffness of central arteries.
Courtesy of Ágnes Lannert and Balázs Varga (Medexpert Ltd.)
The definition of hypertension and the assessment of its prognostic value have long been based upon brachial systolic and diastolic blood pressure (BP) measurement (Lewington et al 2002). More recently, pulse pressure (PP), a measure of the pulsatile component of BP, has also been recognized as an important predictor of future cardiovascular events (Gasowski et al 2002). In elderly subjects, it has been more closely associated with the future development of cardiovascular disease than either systolic or diastolic BP (Franklin et al 2001, Glynn et al 2000, Vaccarino et al 2000, Franklin et al 2009). High brachial pulse pressure was shown as an independent predictor of cardiovascular mortality in both hypertensive and normotensive individuals, and in middle-aged and elderly subjects (Benetos et al 1998, Franklin et al 1999). In addition, long-term spontaneous increase in PP portends a high cardiovascular risk independently of absolute values of BP and other risk factors (Benetos et al 2000).
Although mean BP varies little from the aorta to the brachial artery, the oscillating pulse wave generated in the arterial tree by left ventricular contraction undergoes a progressive distortion with distance, due to changes in stiffness of the different arterial segments and the presence of wave reflections from the peripheral arteries (Figure 6). Thus, brachial systolic BP and pulse pressure provide an inaccurate measure of the corresponding values measured at the level of the ascending aorta (Nichols and O'Rourke 2005).
Central BP, a more direct measure than peripheral BP of the hemodynamic stress imposed on the myocardium and the coronary and cerebral circulation, has a closer relation to target organ damage (Roman et al 2010, Wang et al 2009) than peripheral BP and may be a more robust predictor of future cardiovascular complications (Roman et al 2007, Chirinos et al 2005, Pini et al 2008). An increase in central BP is influenced by arterial stiffness, pressure wave reflections from the geometry and vasomotor tone of small arteries, stroke volume, and heart rate (Mancia et al 2007). In a meta-analysis of 5 prospective studies, central PP was associated with a higher risk of future cardiovascular events, although its predictive superiority over brachial PP only bordered statistical significance (Vlachopoulos et
end-stage renal disease (Safar et al 2002). High PP involves an excessive arterial pressure pulsatility on the aortic wall which is associated with microvascular damage in the heart, brain, kidneys and contributes to an increased risk for major adverse clinical events involving these organ systems (Mitchell et al 2008).
Notably, the different effects of BP-lowering drugs on brachial and central BP may partly explain their different vascular protective properties (Williams et al 2006).
Aortic stiffness has also recently emerged as a strong, independent predictor of cardiovascular mortality and morbidity in patients with essential hypertension (Laurent et al 2001, Boutouyrie et al 2002). In hypertensive patients, increased carotid incremental elastic modulus can be observed independently of age, end- stage renal disease and mean blood pressure (Blacher et al 1999).
1.3.2 Nonivasive measurement of arterial stiffness
In order to detect changes in the pulse, volume or distension arterial waveforms before the appearance of clinically apparent vascular disease, several methods were developed for the assessment of arterial stiffness. Since evidences have shown that arterial stiffness is influenced, especially using pulse wave analysis, by body position, blood pressure, cardiac function, vasomotor tone, smoking, diurnal variation, recent nutrition, drinking and alcohol consumption, subject conditions must be standardized (van Bortel et al 2002). Accordingly, subjects must be in rest in a quiet room at least 10 minutes before the measurement, cannot sleep during the measurements, and subjects cannot drink coffein containing beverages, have meal and must refrain from smoking 3 hours prior to the assessment (Benowitz 1988, Kool et al 1991, Waaler et al 1991, Failla et al 1997, Wilkinson et al 1998, van Bortel et al 2002).
The assessment methods can be structured as follows (Cseprekál 2011, Laurent et al 2006):
A. Local arterial stiffness
Local arterial stiffness can be assessed either by echo tracking (ultrasound), applanation tonometry or video magnetic resonance imaging. Local arterial stiffness can be determined from (preferentially simultaneous) measurements of stroke changes in diameter and local pulse pressure (Laurent et al 2006). Most important assessed parameters include (Hayashi et al 1974, Kawasaki et al 1987, Hoeks et al 1990):
1. local PWV (eg., carotid);
2. strain, in brief, a percentage change of the lumen diameter during the cardiac cycle, or the amount of deformation relative to the unstressed state and expressed as percent change in the arterial diameter: strain=(SID–DD)/DD, where SID is the systolic and DD the diastolic intraluminal CCA diameter (mm);
3. stiffness ( ) representing the stress (SBP–DBP)-to-strain ratio, as ln(SBP/DBP)/strain, where SBP and DBP are brachial blood pressures measured in the systolic and diastolic cardiac cycle, respectively;
4. distensibility as the absolute and relative change in cross-sectional area ( A) of the vessel per unit of pressure change;
5. a) measurement of intima-media thickness allows calculation of Young's incremental elastic modulus characterizes the elastic properties of the arterial wall material by taking into account the thickness of the arterial wall. Young's modulus can be calculated as [3×(1+Lcsa/IMcsa)]/DC where Lcsa means lumen cross sectional area IMcsa means intima-media cross sectional area, and DC characterize distensibility coefficients.
b) pressure-strain elastic modulus (Peterson elastic modulus; inversely related to cross-sectional distensibility, and elastic properties of large arteries): EM=K(SBP- DBP)/strain, where K=133.3 is the conversion factor for mmHg to Nm-2.
B. Regional arterial stiffness
Regional arterial stiffness which measures the change in waveform between two sites. Oscillometry, tonometry (Sphygmocor, PulsePen), mechanotransducer method (Complior) and Doppler technique are the most common methods of the
measurement of regional arterial stiffness characterized by aortic, carotid-femoral, carotid-radial and femoro-tibial PWV (Cseprekál 2011, Laurent et al 2006).
C. Systemic arterial stiffness (waveform shape analysis)
Systemic arterial stiffness can be estimated from models of the circulation based on analogies with electrical models combining capacitance and resistance in series (Laurent et al 2006). The measurement possibilities of systemic arterial stiffness include tonometry, oscillometry, mechanotransducer method, stroke volume and pulse pressure assessment, and finally, decrease of diastole and windkessel function using pulse wave analysis (Mahomed 1877). Accordingly, most important variables include proximal capacitive compliance, distal oscillatory compliance and systemic arterial compliance (Laurent et al 2006).
1.4 Carotid intima-media thickness
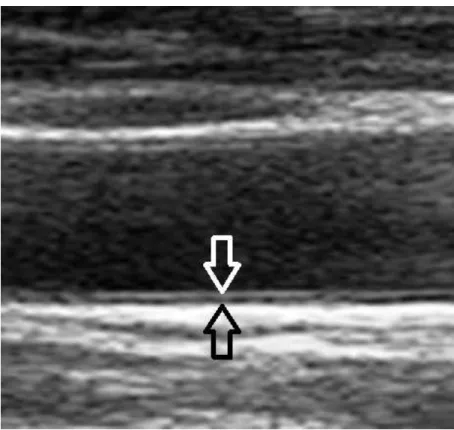
Carotid intima-media thickness (IMT), or the thickness of the intima and media layers of the carotid artery (Figure 7.) is a surrogate marker for atherosclerosis, and is associated with prevalent and incident cardiovascular disease (Bots et al 1997, Hollander et al 2002, Simon et al 2002, O‘Leary and Polak 2002).
The carotid IMT can be easily, safely, reliably and inexpensively measured with B- mode ultrasound, and the predictive value increases when carotid IMT is measured at multiple extracranial carotid sites (Simon et al 2002, Paul et al 2012). Even if carotid IMT can be assessed at the near-wall and the far-wall of the carotid artery as well, studies suggest that the assessment of the far wall is more accurate due to the easier detection of media-adventitia interface at this location (Wikstrand and Wendelhag 1994, Wong et al 1993, Paul et al 2012). Color Duplex imaging mode can help in the surface detection as well by clear imaging of the circulating red blood cells in the arterial lumen.
Figure 7. Intima-media thickness measurement by ultrasound (white arrow: intima, black arrow: media layer)
The normal carotid IMT measures 0.74±0.14 mm in general (Mohan et al 2000). A recent 2012 study showed similar findings in a heathy Indian and Bangladeshian population: 0.75±0.12 mm was the mean carotid IMT value (Paul et al 2012).
According to recent studies, normal carotid IMT is considered if it is <0.8 mm, and a value of carotid IMT ≥1 mm is associated with atherosclerosis and a significantly increased cardiovascular disease (CVD) risk in any age group (Simon et al 2002, Wikstrand et al 1994, Paul et al 2012). In addition, carotid IMT values increase with age and it is especially higher in the age group of 60-88 years than lower age groups (Stein et al 2004, Paul et al 2012). Moreover, carotid IMT is always higher in men than women (Kablak-Ziembicka et al 2005, Paul et al 2012).
Recent studies have shown that carotid IMT is mostly determined by genetic factors (Zannad et al 1998, Zannad and Benetos 2003, Zhao et al 2008). Heritability estimates of carotid IMT ranged from 24% to 59% based on three twin studies (Zhao et al 2008, Swan et al 2003, Jartti et al 2002).
1.5 Anthropometric cardiovascular risk factors and their assessment modalities
Obesity is a complex condition of excessive fat accumulation linked to major adverse health effects including the development of type 2 diabetes, cardiovascular disease, and certain forms of cancer (Field et al 2001, Bianchini et al 2002).
Obesity has reached epidemic proportions worldwide with more than one billion overweight adults of which at least 300 million are clinically obese (Nguyen and El-Serag 2010). On the basis of body fat percentage, prevalence of obesity was 17.9% for boys and 12.8% for girls in a Hungarian study conducted among schoolchildren (Antal et al 2009). In an American study performed among schoolchildren, 30.5% of girls and 26.8% of boys were above the 95th percentiles for BMI-for-age (Caballero et al 2003). Underlying mechanisms of the rising obesity epidemic are still unclear. Environmental effects undeniably contribute to the body‘s energy balance through modifying caloric intake and physical activity (Herrera and Lindgren 2010, Qi and Cho 2008). However, not everyone becomes obese and there is considerable variation in individual responsiveness to obesogenic environments (Wardle et al 2008). Large epidemiological studies based on family, adoption, and twin relations indicate that genetic influences contribute substantially to variation in obesity (Allison et al 1996, Haworth et al 2008). Collectively, these findings suggest that gene–environment interactions may particularly increase the risk of obesity among those who are genetically predisposed to weight gain.
Body mass index (BMI) is a simple but quantitative anthropometric estimate of obesity based on height and weight that applies to adult men and women. However, the relationship between BMI and body fat may significantly vary by age, gender, and ethnicity (Gallagher et al 2000). For instance, athletes can present with high values of BMI but normal or low fat percentage (Seagle et al 2009). Moreover, the definition of obesity based on BMI alone may highly vary by geographical areas (Shiwaku et al 2004). Accordingly, body fat percentage that exceeds normal levels may indicate obesity more reliably than BMI alone and there is a recommendation
for the normal range of body fat content in both genders (Position of the American Dietetic Association, 2009) (Table 1).
Table 1. Recommended amount of body fat according to gender (Position of the American Dietetic Association, 2009) For
women:
The recommended amount of body fat is 20-21% (at least 10%).
The average American woman has approximately 22-25% body fat.
A woman with more than 30% body fat is considered obese.
For men: The recommended amount of body fat is 13-17% (at least 8%).
The average American man has approximately 17-19% body fat.
A man with 25% body fat or higher is considered obese.
Body fat percentage refers to the amount of body fat mass in regards to the total body weight expressed as a percentage as follows:
Body fat percentage (%) = (Body fat mass / Body weight) × 100 where body fat mass and body weight are expressed in kg.
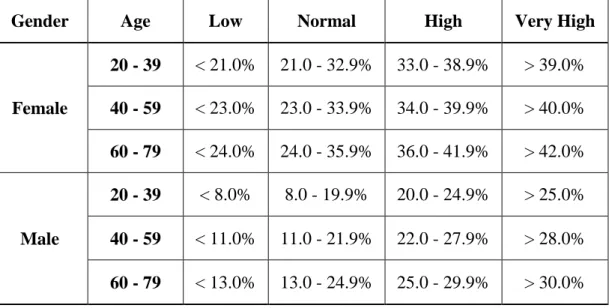
Interpretation of body fat percentage results based on NIH/WHO guidelines for age are shown in Table 2 (Gallagher et al 2000).
Table 2. Interpreting Body Fat Percentage values according to age (Gallagher et al 2000)
Gender Age Low Normal High Very High
Female
20 - 39 < 21.0% 21.0 - 32.9% 33.0 - 38.9% > 39.0%
40 - 59 < 23.0% 23.0 - 33.9% 34.0 - 39.9% > 40.0%
60 - 79 < 24.0% 24.0 - 35.9% 36.0 - 41.9% > 42.0%
Male
20 - 39 < 8.0% 8.0 - 19.9% 20.0 - 24.9% > 25.0%
40 - 59 < 11.0% 11.0 - 21.9% 22.0 - 27.9% > 28.0%
60 - 79 < 13.0% 13.0 - 24.9% 25.0 - 29.9% > 30.0%
Levels significantly above these amounts may indicate excess body fat. Athletes, leaner individuals, and more muscular individuals will have a body fat percentage lower than these levels. Furthermore, body composition is a sensitive indicator of health and nutritional status. There are different methods to estimate body
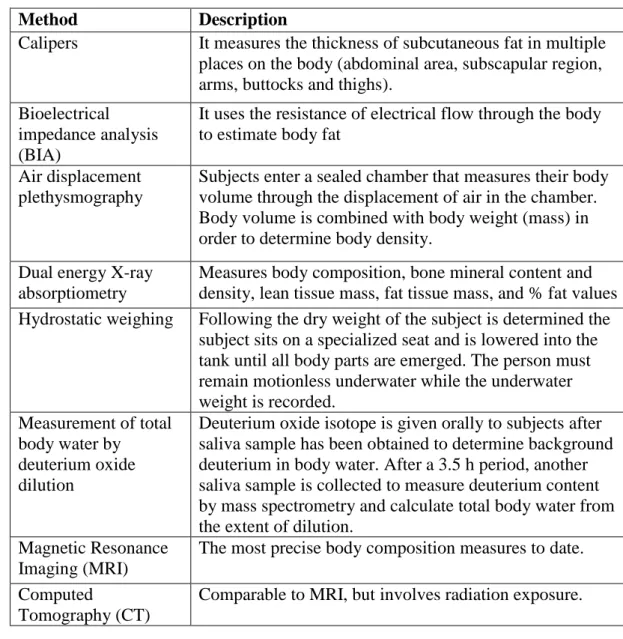
composition parameters (Table 3).
Table 3. Different methods of body composition measurements (Kiebzak et al 2000)
Bioelectrical impedance analysis determines electrical impedance, or the opposition to current flow of an electric current through body tissues, in order to estimate total body water (Kyle et al 2004). In early studies, bioelectrical impedance analysis
Method Description
Calipers It measures the thickness of subcutaneous fat in multiple places on the body (abdominal area, subscapular region, arms, buttocks and thighs).
Bioelectrical impedance analysis (BIA)
It uses the resistance of electrical flow through the body to estimate body fat
Air displacement plethysmography
Subjects enter a sealed chamber that measures their body volume through the displacement of air in the chamber.
Body volume is combined with body weight (mass) in order to determine body density.
Dual energy X-ray absorptiometry
Measures body composition, bone mineral content and density, lean tissue mass, fat tissue mass, and % fat values Hydrostatic weighing Following the dry weight of the subject is determined the
subject sits on a specialized seat and is lowered into the tank until all body parts are emerged. The person must remain motionless underwater while the underwater weight is recorded.
Measurement of total body water by
deuterium oxide dilution
Deuterium oxide isotope is given orally to subjects after saliva sample has been obtained to determine background deuterium in body water. After a 3.5 h period, another saliva sample is collected to measure deuterium content by mass spectrometry and calculate total body water from the extent of dilution.
Magnetic Resonance Imaging (MRI)
The most precise body composition measures to date.
Computed
Tomography (CT)
Comparable to MRI, but involves radiation exposure.
highly varied and was not considered an accurate measure of body composition parameters, except for individuals with very low or very high BMI (Biaggi et al 1999). More recently, bioelectrical impedance analysis has become a commonly used, low-cost approach to assess body composition in a variety of health care settings (Jaffrin 2009). For instance, a Danish study found that BMI correlates with body fat assessed by bioelectrical impedance (r=0.9), indicating that BMI reflects body fat very well (Schousboe et al 2004).
2. Objectives
To decide whether genetic or environmental variances determinate the cardiovascular and anthropometric traits of interest, twin studies are necessary.
Twin studies by comparing identical with non-identical twins produce information on the relative contribution of genes and environment, and how the two interact.
The development or the progression of a heritable phenotype predisposing to a disease can be avoided or postponed, if proper screening methods are available. On the other hand, if the unique environmental factors determinate the certain trait, prevention (eg., by the modification of lifestyle) must be highlighted. Accordingly, our aims can be summarized in the following points:
1. Although the heritability of few hemodynamic variables has been shown (Vinck et al 2001, Snieder et al 2003, Mitchell et al 2005, Bochud et al 2005, Fava et al 2004, van Rijn et al 2007, Cecelja et al 2009), the precise magnitude of the genetic influence on novel hemodynamic variables (eg., central SBP, PP, arterial stiffness) and the association of arterial stiffness with central SBP and PP is poorly described.
The first goal of our investigation was to assess the heritability of arterial stiffness, central SBP and PP and of brachial PP and the phenotypic/genotypic correlations between central pressure and arterial stiffness measures using a twin sample.
2. Previous studies have shown that carotid IMT is determined by genetic factors but largely influenced by environmental variance on certain segments (Zannad et al 1998, Zannad and Benetos 2003, Zhao et al 2008, Swan et al 2003, Jartti et al 2002, Lee et al 2012). However, narrow age-range cohorts or samples involving only one gender (eg., females) were applied and the precise extent to which genetic predisposition explains the variance of carotid IMT on multiple segments in a wide age-range population (including both males and females) is unclear. In addition, it is poorly investigated what connection is between carotid IMT and arterial stiffness measures. The second goal of this investigation, was to assess the heritability of carotid IMT, and to estimate phenotypic correlations between carotid IMT and arterial stiffness and augmentation index measures using the same twin sample.
3. Several studies have investigated the interplay of genetic and environmental influences on anthropometric parameters related to obesity by studying twin cohorts
(Fabsitz et al 1992, Korkeila et al 1995). In this study, we aimed to assess body composition components by using bioelectrical impedance analysis to determine the heritability of key anthropometric attributes in twins. Our goal was to demonstrate the ease with which this relatively simple method may confirm the role of genetics in body composition attributes and prove practical in identifying individuals who would primarily benefit from lifestyle changes to prevent obesity- related adverse health events.
3. Methods
3.1 Subjects
In this classical twin study, we examined in total 391 twin pairs, including 166 Hungarian (59 DZ and 107 MZ, mean age 42±17 years±standard deviation /SD/, range 18-82 years), 50 American (3 DZ and 47 MZ, age 46±17 years, range 18-76 years) and 175 Italian (97 DZ and 78 MZ, age 55±12 years, range 22-74 years) pairs. In the three substudies, different sample sizes were included in the analysis as follows (Table 4):
3.1.1 Sample of the hemodynamic study
In this analysis, 146 Hungarian and 50 American twin pairs were analyzed.
3.1.2 Sample of the carotid intima-media thickness study
205 twin pairs (44 Hungarian, 124 Italian, 37 American twin pairs) were included in the second substudy analysis.
3.1.3 Sample of the anthropometric study
380 twin pairs (157 Hungarian, 174 Italian and 49 American; 230 monozygotic and 150 dizygotic pairs) were included in this cross-sectional twin substudy.
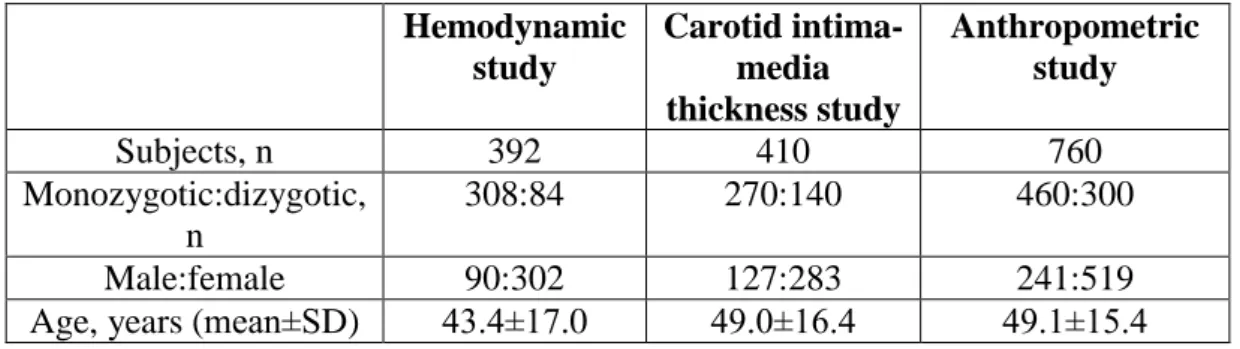
Table 4. Basic sample characteristics of the three studies Hemodynamic
study
Carotid intima- media thickness study
Anthropometric study
Subjects, n 392 410 760
Monozygotic:dizygotic, n
308:84 270:140 460:300
Male:female 90:302 127:283 241:519
Age, years (mean±SD) 43.4±17.0 49.0±16.4 49.1±15.4
3.2 Study design
Subjects were recruited as part of the International Twin Study 2009 project. Twins above the age of 18 years were invited to participate. Exclusion criteria were race other than white (to exclude the influence of ethnicity), pregnancy, medical conditions possibly interfering with compliance during test procedures, arrythmia, morbid obesity, and anorexia.
Hungarian subjects were enrolled from our Hungarian Twin Registry (Littvay et al 2012) and examined during local twin festivals (at locations in Ágfalva and Szigethalom) and in two large hospitals in Budapest (Semmelweis University Department of Radiology and Oncotherapy; Military Hospital Department of Cardiology) between July, 2009 and June, 2010.
Italian twins were enrolled by the Italian Twin Registry (Fagnani et al 2006) and tested in Roman, Paduan, and Perugian hospitals in September, 2009 and in March, 2010.
American twins were tested at the Twins Day Festival in Twinsburg, OH, USA in August, 2009.
Hemodynamic and anthropometric measurements were facilitated by the author and the author‘s twin brother (ADT and DLT) at all research sites together in order to avoid inter-observer variation. The carotid ultrasounds were performed by multiple sonographers beyond ourselves due to technical reasons.
In the absence of genotypic data, zygosity was assessed in Hungary and in the USA through a multiple widely used and accepted self-reported questionnaire of a >99%
accuracy (Heath et al 2003). In Italy, zygosity was determined by using a validated self-report questionnaire (Kyvik et al 1995), which included questions on the similarities of twins during their childhood. To assess past medical history and personal habits (diet, smoking, alcohol consumption, and history of physical activity), all study subjects were requested to complete an on-site questionnaire.
The research was conducted in accordance with the Declaration of Helsinki. The local responsible university IRB committees have approved the study (in Hungary:
Semmelweis University Regional and Institutional Committee of Science and
Research Ethics, TUKEB, 29/2009). Written informed consent was obtained from all subjects/patients.
3.3 Hemodynamic measurement
Aortic PWV, brachial and aortic AIx along with central blood pressure components can be assessed using Arteriograph (Medexpert Ltd., Budapest), a clinically validated oscillometric device (Baulmann et al 2008) which has been favorably compared with intra-arterial invasive measurements (Horváth et al 2010) (Figure 8.). The measurements were performed in accordance with the suggestions of the European Society of Cardiology (Laurent et al 2006). Arteriograph calculates arterial stiffness parameters from oscillometrically recorded pressure waves of the brachial artery. Using inflatable upper arm cuffs with high fidelity sensors, pulsatile volume changes (resulting from pulsatile fluctuations of the brachial artery) are transduced into pressure curves. Pulse waves are recorded when the brachial artery is completely occluded at a cuff pressure that is 35-40 mmHg above systolic BP.
Computer programs are used to further analyze the recorded pulse waves. Pulse transit time is determined from the decomposition of the generated aortic pressure wave using the reflection method (Qasem and Avolio 2008), based on the fact that the forward traveling pulse wave (generated by the ejection of the left ventricle) is reflected in the periphery creating a second reflected wave. Pulse transit time is determined from the time delay between the forward and the beginning of the reflected pressure wave, and aortic PWV is automatically calculated from transit time and traveling distance between jugulum (sternal notch) and symphysis pubica (according to the manufacturers recommendations) (jugulum-symphysis distance).
Central hemodynamics including AIx and central BP were calculated from brachial pressure curves in combination with automated transfer algorithms.
All subjects were asked not to smoke three hours, not to eat one hour, not to drink alcohol and coffee ten hours prior to their visit. Subjects were examined in supine position on the dominant arm after at least 10 min of rest, and were asked not to speak or move during the measurements, and to keep their eyes closed during the
test. The same device was used for all tests except for circa 50 twin pairs on the twin festivals where parallel measurements were necessary due to the lack of time.
If the automatic quality control was appropriate at the first measurement, i.e. SD of aortic PWV was <1 m/s, only one measurement was performed. In case of SD >1 m/s, the mean value obtained from the average of at least 3 measurements was considered.
Figure 8. Hemodynamic measurements of the American twin pairs (Twinsburg, OH)
3.4 Carotid ultrasonography (IMT measurement)
The measurement of carotid IMT was performed by B-mode ultrasound with linear array high frequency (5-10 MHz) transducers (in Rome: Esaote Technos MPX, in Padua: Philips iU22, in Perugia: Esaote Technos MP, in Hungary: Toshiba Power Vision and Esaote Mylab70, in the USA: Sonosite Titan). Sonographers were professional internists, neurologists or radiologists. Bilateral carotid arteries were assessed from the origin of the common carotid artery until the proximal 3-4 cm of the internal and external carotid arteries (Figure 9.).
IMT of proximal and distal common carotid artery, and of proximal internal carotid
the far wall of the CCA 3-5 cm after its origin from subclavian artery (proximal CCA) and 1 cm proximally to the bifurcation (distal CCA). In addition, IMT was measured on the far wall at the proximal left and right ICA 1 cm distal to the bifurcation. For each segment, the sonographer used multiple different scanning angles to identify the longitudinal image of IMT showing the maximum IMT. At least 10 pictures for each segment were stored digitally, and measurements were made off-line using semiautomated computerized analytical software (Carotid Analyzer, Medical Imaging Applications LLC). In Padua, a dedicated software (QLAB) measured the IMT thickness automatically (since it was available in the ultrasound machine). Average values of the IMT of each of the six measurement spots (both proximal CCA, distal CCA, proximal ICA) were used as the IMT values for each twin in the analysis. We did not use electrocardiogram gating. In case of a carotid plaque we measured the carotid IMT at the end of the plaque.
Figure 9. Ultrasonographic measurements of the Hungarian twin pairs
3.5 Assessment of body composition
Body composition was determined by a clinically validated, portable body consistency monitor (OMRON BF500, Omron Healthcare Ltd., Kyoto, Japan) using bioelectrical impedance analysis (Bosy-Westphal et al 2008). The monitor leads weak electrical current of 50 kHz and less than 500 μA through the subject‘s body to determine the amount of fat tissue. Muscles, blood vessels and some soft tissues including high water content conduct electricity easily while body fat has little electric conductivity. During the course of day, body water tends to gradually shift to the lower limbs making the ratio of water between the upper and lower body different in the morning and evening. Accordingly, the body‘s electrical impedance varies during the day. Use of electrodes for both hands and feet may reduce the influence of fluctuations on measured values. To further improve consistency, measurements were taken in the late morning hours and in the afternoon. To avoid electromagnetic interferences, subjects with pacemaker were excluded.
Under guidance of a trained assistant, current height, age, and gender information was entered in order to generate results. The subjects were instructed to stand on the scale barefooted with straight knees and back, looking straight ahead with horizontally raised arms and extended elbows (Figure 10.). The extended arms had at a 90° angle to the subject‘s body until the BMI, total body fat, fat-free mass rates were calculated. Body fat percentage refers to the amount of body fat mass with regards to total body weight expressed as follows:
Body fat percentage (%) = [Body fat mass (kg) / Body weight (kg)] × 100
Fat-free mass was interpreted as [100% - body fat percentage (%)]. Waist and hip circumferences were measured by placing a measuring tape in a horizontal plane mid-way between the top of the iliac bone and the bottom of the rib cage, and at hip level, respectively.
Figure 10. Body composition measurement of a Hungarian twin
3.6 Statistical analysis
3.6.1. Risk factor assessment
Initially we conducted a descriptive analysis (mean, standard deviation and the percentage for categorical variables) in MZ and DZ twins. Between-sex, between- zygosity and between-country differences were calculated using independent- samples t-test. The heritability model corrected for country of sample by regressing out its effects as these differences were significant at p<0.05.
3.6.2. Estimating genetic influence on hemodynamic, carotid intima-media thickness and body composition parameters
A descriptive estimate of the genetic influence was calculated using the bivariate co-twin correlation in MZ (rMZ) and DZ (rDZ) pairs for each trait of interest. The corresponding 95% confidence intervals for rMZ and rDZ were calculated (McGraw and Wong 1996). If the within pair similarity for a phenotype is greater
in MZ than DZ pairs this provides evidence for genetic influence. Saturated models estimate means, variances and covariances separately for each group of twins (twin 1 vs twin 2) and by zygosity (MZ vs DZ pairs). Accordingly, we can get a baseline likelihood estimate against which to compare a genetic model.
Structural equation modeling was used to estimate heritability. Univariate quantitative genetic model (ACE) was performed to decompose phenotypic variance of the considered parameters into additive (A), common environmental (C) and unique environmental (E) effects (Neale and Cardon 1992). The additive genetic component measures the effects due to genes at multiple loci or multiple alleles at one locus. In case of carotid IMT parameters, non-additive or dominant (D) genetic component was also calculated which component measures the interaction between alleles at the same locus or on different loci. The common environmental component estimates the contribution of the shared family environment by both twins, whereas the unique environmental component estimates the effects that apply only to each individual twin, and includes measurement error.
More formally, the covariance matrix of the MZ co-twins is modeled to be equal to a2+c2+e2 (or the total phenotypic variance) and the off diagonal as a2+c2 (the components that the co-twin covariance consists of). For DZ twins the diagonal restrictions are the same for MZ twins but the off-diagonals are restricted to 0.5xa2+c2 (since genetic co-twin covariance is, on average, 0.5 for non-identical twins while their shared environmental correlation is the same as for MZ twins).
With these restrictions in place the likelihood is maximized to obtain the estimates.
The p-values for the 2 difference test of the likelihood function was calculated (sometimes insignificant results show that the model estimated covariance is not significantly worse than what is observed). The fitting model was determined on intraclass correlation: if twin correlations do not suggest shared environmental influence the (A+D) E model was considered (broad heritability); if twin correlations show evidence of common environmental effects the full ACE model was considered. Nested models were compared using likelihood-ratio 2 tests and Akaike Information Criteria (AIC) model selection was performed according to the principle of parsimony. Model fitting was done with the statistical software Mplus