http://www.jgc301.com; jgc@jgc301.com | Journal of Geriatric Cardiology
Research Article
•Open Access
•Inflammation and oxidative stress caused by nitric oxide synthase uncoupling might lead to left ventricular diastolic and systolic dysfunction in patients with hypertension
Zsuzsanna Szelényi
1,*, Ádám Fazakas
2,*, Gábor Szénási
3, Melinda Kiss
2, Narcis Tegze
4, Bertalan Csaba Fekete
5, Eszter Nagy
6, Imre Bodó
6, Bálint Nagy
7, Attila Molvarec
7, Attila Patócs
8, Lilla Pepó
2,
Zoltán Prohászka
2, András Vereckei
21The Heart and Vascular Center of Semmelweis University, Budapest 1122, Gaál József u. 9, Hungary
23rd Department of Internal Medicine, Semmelweis University, School of Medicine, Budapest 1125, Kútvölgyi út 4, Hungary
3Institute of Pathophysiology, Semmelweis University, Budapest 1089, Nagyvárad tér 4, Hungary
4Department of Neurology, Kútvölgyi Clinical Group, Semmelweis University, Budapest 1125, Kútvölgyi út 4, Hungary
52nd Department of Medicine, Military Hospital, Budapest 1134, Róbert Károly krt. 44, Hungary
6St. Istvan and St. Laszlo Hospital, St. Laszlo Hospital Campus, Hematology and Stem Cell Transplantation Department, Hemostasis Laboratory, Budapest 1097, Gyáli út 5-7, Hungary
7First Department of Obstetrics and Gynecology, Semmelweis University, Budapest 1085, Baross u. 27, Hungary
8MTA-SE, Lendulet” Hereditary Endocrine Tumors Research Group, Budapest 1051, Széchenyi István tér 9, Hungary
Abstract
Objective To investigate the role of oxidative stress, inflammation, hypercoagulability and neuroendocrine activation in the transition of hypertensive heart disease to heart failure with preserved ejection fraction (HFPEF). Methods We performed echocardiography for 112 patients (≥ 60 years old) with normal EF (18 controls and 94 with hypertension), and determined protein carbonylation (PC), and tetrahydrobiop- terin (BH4), C-reactive protein (CRP), interleukin-6 (IL-6), tumor necrosis factor-α (TNF-α), fibrinogen, plasminogen activator inhibitor type-I (PAI-I), von Willebrand factor, chromogranin A (cGA) and B-type natriuretic peptide (BNP) levels from their blood samples. Results We found that 40% (38/94) of the patients with hypertension (HT) had no diastolic dysfunction (HTDD−), and 60% (56/94) had diastolic dysfunc- tion (HTDD+). Compared to the controls, both patient groups had increased PC and BH4, TNF-α, PAI-I and BNP levels, while the HTDD+
group had elevated cGA and CRP levels. Decreased atrial and longitudinal left ventricular (LV) systolic and diastolic myocardial deformation (strain and strain rate) was demonstrated in both patient groups versus the control. Patients whose LV diastolic function deteriorated during the follow-up had elevated PC and IL-6 level compared to their own baseline values, and to the respective values of patients whose LV diastolic function remained unchanged. Oxidative stress, inflammation, BNP and PAI-I levels inversely correlated with LV systolic, diastolic and atrial function. Conclusions In patients with HT and normal EF, the most common HFPEF precursor condition, oxidative stress and inflamma- tion may be responsible for LV systolic, diastolic and atrial dysfunction, which are important determinants of the transition of HT to HFPEF.
J Geriatr Cardiol 2015; 12: 1−10. doi:10.11909/j.issn.1671-5411.2015.01.001 Keywords: Hypertension; Heart failure; Inflammation; Oxidative stress
1 Introduction
Hypertension is the main underlying cause of heart fail- ure with preserved ejection fraction (HFPEF). This condi- tion partially or entirely accounts for 78% to 88% of HFPEF
*The first two authors contributed equally to this work
Correspondence to: András Vereckei, MD, 3rd Department of Medicine, Semmelweis University, School of Medicine, Budapest 1125, Kútvölgyi út 4, Hungary. E-mail: vereckei.andras@med.semmelweis-univ.hu
Telephone: +36-1-325-1100 Fax: +36-1-225-0196 Received: September 22, 2014 Revised: November 20, 2014 Accepted: November 27, 2014 Published online:December 29, 2014
cases.[1–3] The most common diseases causing HFPEF (hy- pertension, diabetes mellitus, obesity and chronic renal dis- ease) are associated with a proinflammatory, prothrombotic state and increased oxidative stress.[2] Proinflammatory cy- tokines, such as interleukin-6 (IL-6) and tumor necrosis factor-α (TNF-α) are raised in HFPEF,[4] and predict future HFPEF development.[5] This proinflammatory state pro- motes the activation, adhesion and subendothelial migration of circulating leukocytes in two ways: by increasing the expression of the vascular cell adhesion molecule (VCAM) and E-selectin, and by increasing the activity of nicotina- mide adenine dinucleotide phosphate (NADPH) oxidase,
which leads to increased reactive oxygen species production in the coronary microvasculature endothelial cells.[2,6–8] The presence of nitrosative/oxidative stress was recently demon- strated by using nitrotyrosine and dihydroethidium staining in cardiomyocytes of HFPEF patients. Nitrotyrosine stain- ing reflects low nitric oxide (NO) bioavailability due to pe- roxynitrite formation from NO by superoxide anion (O2−.).[6,9]
Peripheral endothelial dysfunction was recently iden- tified as an independent predictor of the outcome of HFPEF, thus suggesting a causal role of endothelial dysfunction in the pathogenesis of HFPEF.[10] In cardiomyocytes adjacent to dysfunctional endothelium, low NO bioavailability be- cause of high nitrosative/oxidative stress decreases cyclic guanosine monophosphate (cGMP) production without al- tering soluble guanylate cyclase activity. Low cGMP level accounts for low protein kinase G (PKG) activity in HFPEF myocardium, which results in hypertrophy and increased stiffness of the myocardium.[2,9,11] Both low cGMP content and low PKG activity were recently demonstrated in myo- cardial homogenates of HFPEF patients.[9]
Besides peripheral endothelial dysfunction, another im- portant concept in the pathogenesis of HFPEF is oxidative stress due to myocardial nitric oxide synthase (NOS) un- coupling. This myocardial NOS uncoupling is caused mainly by oxidative depletion of the NOS cofactor tetrahy- drobiopterin (BH4).[12] In hypertonic animal HFPEF models, treatment with BH4 reversed left ventricular (LV) hypertro- phy, fibrosis and diastolic dysfunction. However, this effect could not be observed when the animals were treated with an antihypertensive agent (hydralazine) or non-specific an- tioxidants that do not affect NOS uncoupling (Tempol and tetrahydroneopterin). We can thus conclude that the above LV alterations (LV hypertrophy, fibrosis and diastolic dys- function) were specifically due to oxidative stress resulting from myocardial NOS uncoupling and were not the results of hypertension or oxidative stress in general.[13,14]
We hypothesized that oxidative stress and inflammation have an important (potentially primary) role in the patho- genesis of LV diastolic and subtle systolic dysfunction in patients with hypertension and normal ejection fraction (EF), which is the most common precursor state of HFPEF. To this end, we investigated the presence of oxidative stress, a proinflammatory and prothrombotic state and endothelial dysfunction in patients with hypertension and normal EF.
2 Methods
The study was conducted from December 2007 to July 2012 at the 3rd Department of Medicine, Semmelweis University, Budapest. We prospectively enrolled a total of
112 patients ≥ 60 years old with normal LVEF (> 50%).
Ninety-four participants were patients with uncomplicated hypertension and eighteen participants were age-matched normotensive, healthy controls. The average follow-up pe- riod was 23.3 ± 12.5 months, depending on the time of en- rollment. Forty-four of the patients were followed for three years, and each patient was followed for a minimum of one year. Annual follow-up examinations were set up, with each patient undergoing a physical examination, an electrocar- diograph (ECG), a detailed echocardiography, a carotid ultrasound and a chest X-ray. Biochemical measurements were also performed. We used the same tests during the follow-up period and the baseline examinations.
Note that measurements of BH4, total biopterin and B-type natriuretic peptide (BNP) were added to the study protocol only later. As a result, biopterin and BNP levels were measured in all patients at least once, BNP was meas- ured twice in about 75% of the patients and three times in case of a few patients, while biopterin levels were measured twice only in a few patients.
Seventeen patients did not finish the follow-up. Eight of them did not want to continue with the study, and nine pa- tients satisfied one of the exclusion criteria (HFPEF deve- loped in two of them). The study complied with the Decla- ration of Helsinki and was approved by the Institutional Committee on Human Research. An informed consent was obtained from all patients. Hypertension was defined by a systolic blood pressure > 140 mmHg and/or a diastolic blood pressure > 90 mmHg, or by antihypertensive phar- macotherapy. Blood pressure was measured three times according to the standard procedure, i.e., in a sitting position following a 10-min rest. Then the values were averaged.
Exclusion criteria included diabetes mellitus, more than a mild degree valvular or congenital heart disease, the pre- sence of electrical pacemakers or implantable cardiac defi- brillators, prior cardiovascular surgery, an established his- tory of coronary heart disease, prior or ongoing atrial tach- yarrhythmias, prior or manifest heart failure, any malignant or immunological disease, anticoagulant or antioxidant treatment, or conditions associated with acute inflammation or stress.
2.1 Biochemical measurements
All measurements were carried out from plasma or serum samples.
2.1.1 Oxidative stress parameters
Protein carbonylation (PC) assays were based on the photometric method of Levine, et al.[15]
Plasma BH4 levels were measured using high performance liquid chromatography (HPLC) based on the method of
http://www.jgc301.com; jgc@mail.sciencep.com | Journal of Geriatric Cardiology
Fukushima and Nixon[16] and modified by Fekkes and Voskuilen-Kooijman.[17] Briefly, blood was collected into 4 mL Vacutainer tubes containing 7.2 mg K-EDTA and 0.1%
(w/v) dithiothreitol (DTT) and centrifuged at 2650 r/min for 20 min after standing at room temperature in the dark for 2 to 3 h. Plasma was separated and frozen immediately at
−80°C until analysis. The amount of BH4 was determined by the differential oxidation method of Fukushima and Nixon.[16] The BH4 level was calculated from the difference between total biopterin [BH4 plus 7,8-dihydrobiopterin (BH2) plus biopterin] level and the alkaline-stable oxidized biopterin level (BH2 plus biopterin). Total biopterin level was determined by acid iodine oxidation of BH2 and BH4 to biopterin and the alkaline-stable oxidized biopterin level was determined by using alkaline iodine, which oxidizes only BH2 to biopterin.
2.1.2 Inflammatory parameters
C-reactive protein (hs-CRP) concentrations were measured in serum samples with the ultrasensitive particle-enhanced immunoturbidimetric assay in Cobas Integra 800 analyzer (Roche, Basel, Switzerland). Interleukin-6 (IL-6) and tumor necrosis factor-α (TNF-α) levels were measured by high- sensitivity sandwich ELISA Kits (R&D Systems, Minnea- polis, MN, USA), according to the instructions of the manufacturer.
2.1.3 Coagulation parameters
The von Willebrand factor antigen (VWF: Ag) level was measured by an in-house sandwich ELISA assay using rab- bit polyclonal anti-human VWF antibodies (Dako, Glostrup, Denmark). Commercial reference plasma (Diagnostica Stago, Taverny, France) was used as calibration in each experiment. In addition, assay control samples (both pooled normal and commercially available plasma) were used in each experiment.
Human tissue plasminogen activator inhibitor type I (PAI-I) concentrations were measured in citrated plasma samples with a commercially available ELISA kit according to manufacturer’s instructions (Hyphen BioMed, Neuville–
Sur-Oise, France).
Plasma fibrinogen was measured on an ACL TOP co- agulation analyzer (Instrumentation Laboratory, Milano, Italy) using the prothrombin-derived method, according to the manufacturer’s instructions.
2.1.4 Neuroendocrine parameters
The chromogranin A (cGA) levels were determined by the commercially available chromogranin A assay (Cisbio Bioassays, IBA, Gif-sur-Yvette, France) according to manu- facturer’s instructions.
The concentration of the BNP levels were measured by immune fluorescence method using 250 μL EDTA-plasma (Triage BNP test, Biosite Diagnostics Incorporated, San Diego, CA, USA) as described in detail earlier.[18,19]
2.2 Pulse wave velocity (PWV) measurement
PWV was measured using the validated PulsePen tono- meter (DiaTecne, Milan, Italy) with the patient in supine position as described earlier.[20,21] Briefly, two sequences of measurements were performed in each subject, and their mean was used for statistical analysis. The PulsePen device measures the time difference between the R wave of the ECG and the ‘foot’ of the pulse pressure wave, which was obtained sequentially above the carotid and the femoral arteries using a handheld tonometer, to calculate pulse transit time between these two sites. The average signal of at least 10 heart cycles was used in the measurements at both sites. Surface tape measurements were performed between the carotid site and the jugular notch, and between the jugular notch and the femoral site. The difference of these two distances was considered to be the pulse wave travel distance and this data was used to calculate PWV using PulsePen software.
2.3 Carotid ultrasonography
Echo-Doppler examination was performed using a Phi- lips iE33 system (Philips Ultrasound, Bothell, WA, USA).
The common, bulb, internal and external carotids of both left and right sides were studied in longitudinal and trans- verse planes with anterior, lateral and posterior approaches.
The carotid ultrasonography finding was scored as follows:
score 0: absence of plaque and intima media thickness (IMT)
< 1 mm; score 1: increased (≥ 1 mm) IMT; score 2: non- stenotic plaque (with or without increased IMT); and score 3: stenotic (≥ 50% stenosis) plaque.
2.4 Standard echocardiography
Echocardiographic imaging was carried out using a Phi- lips iE33 system (Philips Ultrasound, Bothell, WA, USA).
Cardiac dimensions and wall thicknesses were measured from two-dimensionally guided M-mode tracings according to the recommendations of the American Society of Echo- cardiography.[22] LV mass was computed by the Deve- reux-modified cube formula.[23] Left atrial volume was cal- culated using the biplane area-length method. The biplane Simpson method was applied to calculate LV end-diastolic and end-systolic volumes, stroke volume and LVEF. LV diastolic function was assessed using the combination of transmitral Doppler flow, pulmonary venous flow, iso- volumic relaxation time (IVRT) and myocardial tissue Doppler septal early diastolic filling velocity (E’). LV dia-
stolic function was graded according to Nishimura and Ta- jik:[24] Grade 1= impaired relaxation with normal filling pressure; Grade 1a = impaired relaxation pattern with in- creased filling pressure; Grade 2 = pseudonormalized pat- tern; and Grade 3 = restrictive pattern. Transmitral flow was acquired from the apical four-chamber view with the sample volume placed at the level of the tips of mitral leaflets. E/A ratio, E deceleration time, A wave duration and IVRT were determined. Pulmonary venous flow was acquired from the same apical four-chamber view by placing the sample vol- ume within the right upper pulmonary vein. Peak systolic forward flow, diastolic forward flow, atrial reversal flow duration and peak velocity were measured from this trace.
2.5 Color tissue Doppler imaging
Real time color Doppler myocardial imaging data were obtained in the apical four-chamber, two-chamber and five-chamber views. Mitral annular velocities [peak systolic velocity, peak E’ and peak late diastolic (A’) velocities]
were recorded from the lateral, septal, inferior, anterior, posterior, anteroseptal LV walls. The width of the image sector and the depth of the imaging were adjusted to achieve a frame rate more than 180 frames/s. Pulse repetition fre- quency was set at the lowest possible level without aliasing.
An insonation angle not exceeding 20o was maintained to ensure an appropriate alignment of the Doppler beam with the myocardial segment that was examined. Color-coded tissue Doppler images were also acquired over three con- secutive cardiac cycles for each of the six LV walls and four atrial walls (in the apical four-chamber and two-chamber views from the mid lateral, inferior and anterior left atrial and mid lateral right atrial walls). We used narrow sector images (≤ 20o) with frame rates of 200–300 frames/s and the data were analyzed offline using the QLAB 6.0 advanced ultrasound quantification software (Koninklijke, Philips Electronics N.V. 2007). During the analysis, we measured the longitudinal LV peak systolic strain (S), end-systolic S, peak systolic, early diastolic and late diastolic strain rates (SR) in the basal and mid myocardial segments of the six LV walls in the apical views. The peak atrial contraction period, atrial reservoir period and atrial conduit period Ss and SRs were measured in the apical four- and two-chamber views from the mid lateral, inferior and anterior left atrial and the mid lateral right atrial myocardium.
2.6 Statistical analysis
All continuous data are expressed as mean ± SD unless otherwise stated. Categorical variables are expressed as proportions. Comparisons between two groups were per- formed with two-tailed t test or two-tailed t test with
Welch’s correction if variances were not equal according to the F test. Comparisons among groups used one-way analy- sis of variance (ANOVA) followed by the Tukey’s multiple comparisons test for between-groups comparisons. The Kruskal–Wallis one-way analysis of variance by ranks was performed if Bartlett’s test indicated heterogeneity of vari- ances and comparisons between groups used the two-tailed t test with Welch’s correction. Time series were compared using two-way ANOVA for repeated measures followed by the Bonferroni post-hoc test. Linear correlation coefficients were determined by calculating Pearson correlation. All tests were conducted at the two-sided 5% significance level.
Statistical analysis was performed using GraphPad Prism5 (GraphPad Software Inc., San Diego, CA, USA).
3 Results
3.1 Patient characteristics
The control group and both patient groups (HTDD− and HTDD+) had similar gender distribution, height, weight, body surface area, diastolic blood pressure, heart rate, esti- mated glomerular filtration rate values and hemoglobin concentration. No significant difference was found between patient groups in terms of medication (Table 1). There was no difference in age between the control group and the whole hypertensive patient group (66.1 ± 4.4 vs. 69.4 ± 7.7 years, the data of the whole hypertensive patient group is not shown in Table 1) and between the control and the HTDD− group.
However, patients in the HTDD+ group were slightly older than those in the control (P < 0.05) and HTDD− (P <
0.01) groups. The body mass index (BMI) was higher in both patient groups than in the control group (P < 0.05 for HTDD− and P < 0.01 for HTDD+ groups). Serum creatinine levels were higher in the HTDD+ group than in the control group (P < 0.05). Compared to the control group, systolic blood pressure was similarly elevated in both pa- tient groups (P < 0.01 for HTDD− and P < 0.001 for HTDD+ groups) (Table 1).
3.2 LV diastolic dysfunction
At the baseline examination, 40% (38/94) of the patients with hypertension and normal EF had no LV diastolic dys- function (HTDD− group), and 60% (56/94) of the patients had mild, Grade 1 (54 patients) or Grade 1a (2 patients) LV diastolic dysfunction (HTDD+ group).
3.3 LV systolic and atrial function
Echocardiography results are summarized in Table 2. No
http://www.jgc301.com; jgc@mail.sciencep.com | Journal of Geriatric Cardiology Table 1. Patient characteristics.
Controls (n = 18)
HTDD− (n = 38)
HTDD+
(n = 56) Age, yrs 66.1 ± 4.4 66.1 ± 5.6 71.6 ± 8.1*, ##
Sex, F/M 12/6 29/9 33/23
Duration of HT, yrs 0 11.5 ± 11.6 14.4 ± 12.2 Height, cm 168.7 ± 8.4 164.3 ± 7.5 164.8 ± 8.6 Weight, kg 70.1 ± 13.2 74.3 ± 18 80.2 ± 25 BMI, kg/m2 24.6 ± 3.7 27.6 ± 5.8* 28 ± 4**, # BSA, m2 1.8 ± 0.2 1.8 ± 0.2 1.8 ± 0.3 Serum creatinine, μmol/L 71.6 ±14.8 70.3 ± 14.8 82.8 ± 25.2# eGFR, mL/min 82.6 ± 19.9 88.4 ± 26.6 75.4 ± 27.1 SBP, mmHg 129.5 ± 16.6 146.5 ± 16.2** 148.9 ± 17.9**
DBP, mmHg 83.8 ± 9.1 85.9 ± 10.9 88.9 ± 10.8 Heart rate, beats/min 71.1 ± 8.3 74.9 ± 9.3 72.2 ± 8.0 Hemoglobin concentration, g/L 140.9 ± 12.6 137.2 ± 13.1 138.9 ± 14.8 Medications (number of patients)
BB 1 22 30
ACEI 0 19 35
ARB 0 9 13
CCB 0 15 27
Diuretics 0 22 35
Aldosterone antagonists 0 0 0
Platelet inhibitors 0 14 24
Statin 3 13 29
PPI 2 10 8
*P < 0.05, **P < 0.01 vs. control; #P < 0.05, ##P < 0.01 vs. HTDD− groups.
ACEI: angiotensin convertase enzyme inhibitor; ARB: angiotensin receptor blocker; BB: beta-adrenergic receptor blocker; BMI: body mass index; BSA:
body surface area; CCB: calcium channel antagonist; DBP: diastolic blood pressure; eGFR: estimated glomerular filtration rate; HT: hypertension;
SBP: systolic blood pressure; PPI: proton pump inhibitor.
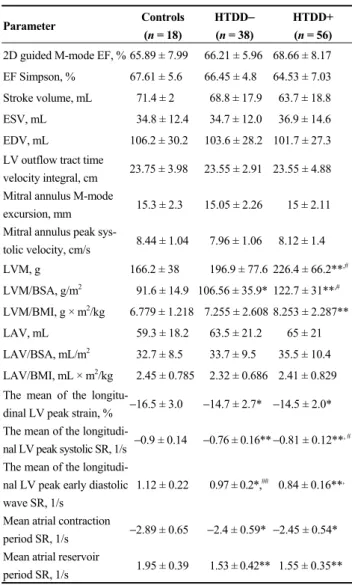
significant between-groups differences were found either in traditional LV systolic function indices [2D-guided M-mode EF measurement using the LVIDd2−LVIDs2/LVIDd2 × 100 formula (LVIDd: diastolic left ventricular internal dimen- sion; LVIDs: systolic left ventricular internal dimension), EF Simpson, stroke volume (SV), LV outflow tract time velocity integral (LVOT-TVI), mitral annulus M-mode ex- cursion] or in LV systolic function parameters based on myocardial velocity measurements by tissue Doppler imag- ing (TDI) such as mitral annulus peak systolic velocity.
However, the more sensitive myocardial deformation pa- rameters (strain and strain rate) revealed LV systolic dys- function in our patients with hypertension and normal EF.
Compared to the control group, we found reduced absolute values for the following parameters in both patient groups:
the mean peak longitudinal LV systolic S (P < 0.05 for both patient groups), systolic (P < 0.001 for both patient groups) and early diastolic SRs (P < 0.05 for HTDD− and P < 0.001 for HTDD+ groups). In the HTDD+ group, the absolute
Table 2. Echocardiographic measurements.
Parameter Controls
(n = 18)
HTDD− (n = 38)
HTDD+
(n = 56) 2D guided M-mode EF, % 65.89 ± 7.99 66.21 ± 5.96 68.66 ± 8.17 EF Simpson, % 67.61 ± 5.6 66.45 ± 4.8 64.53 ± 7.03 Stroke volume, mL 71.4 ± 2 68.8 ± 17.9 63.7 ± 18.8 ESV, mL 34.8 ± 12.4 34.7 ± 12.0 36.9 ± 14.6 EDV, mL 106.2 ± 30.2 103.6 ± 28.2 101.7 ± 27.3 LV outflow tract time
velocity integral, cm 23.75 ± 3.98 23.55 ± 2.91 23.55 ± 4.88 Mitral annulus M-mode
excursion, mm 15.3 ± 2.3 15.05 ± 2.26 15 ± 2.11 Mitral annulus peak sys-
tolic velocity, cm/s 8.44 ± 1.04 7.96 ± 1.06 8.12 ± 1.4 LVM, g 166.2 ± 38 196.9 ± 77.6 226.4 ± 66.2**,#
LVM/BSA, g/m2 91.6 ± 14.9 106.56 ± 35.9* 122.7 ± 31**,#
LVM/BMI, g × m2/kg 6.779 ± 1.218 7.255 ± 2.608 8.253 ± 2.287**
LAV, mL 59.3 ± 18.2 63.5 ± 21.2 65 ± 21 LAV/BSA, mL/m2 32.7 ± 8.5 33.7 ± 9.5 35.5 ± 10.4 LAV/BMI, mL × m2/kg 2.45 ± 0.785 2.32 ± 0.686 2.41 ± 0.829 The mean of the longitu-
dinal LV peak strain, % −16.5 ± 3.0 −14.7 ± 2.7* −14.5 ± 2.0*
The mean of the longitudi-
nal LV peak systolic SR, 1/s −0.9 ± 0.14 −0.76 ± 0.16** −0.81 ± 0.12**, # The mean of the longitudi-
nal LV peak early diastolic wave SR, 1/s
1.12 ± 0.22 0.97 ± 0.2*,## 0.84 ± 0.16**,
Mean atrial contraction
period SR, 1/s −2.89 ± 0.65 −2.4 ± 0.59* −2.45 ± 0.54*
Mean atrial reservoir
period SR, 1/s 1.95 ± 0.39 1.53 ± 0.42** 1.55 ± 0.35**
*P < 0.05, **P < 0.01 vs. the control group; #P < 0.05, ##P < 0.01 vs. the HTDD− group. BMI: body mass index; BSA: body surface area; EDV: left ventricular end-diastolic volume; EF: ejection fraction; ESV: left ventricular end-systolic volume; LAV: left atrial volume; LV: left ventricle; LVM: left ventricular mass; SR: strain rate.
value of the mean peak longitudinal LV systolic SR was increased (P < 0.05) and the longitudinal LV early diastolic SR was reduced (P < 0.01) compared to the HTDD− group.
The absolute values of the mean peak atrial contraction period (P < 0.05 for both patient groups) and the atrial re- servoir period (P < 0.001 for both patient groups) SRs were decreased in both patient groups compared to the control.
3.4 Left atrial volume (LAV) and LV mass
No differences were found between groups in terms of LAV, LAV indexed to body surface area (LAV/BSA) or LAV indexed to BMI (LAV/BMI). LV mass (LVM) in- creased in the HTDD+ group compared to the control (P <
0.001) and HTDD− groups (P < 0.05), while LVM was similar in the HTDD− and the control groups. LVM/BSA increased (P < 0.05 for HTDD−, P < 0.001 for HTDD+
groups) in both patient groups versus the control, and in the HTDD+ group versus the HTDD− group (P < 0.05). LVM/
BMI increased (P < 0.01) in the HTDD+ group versus the control and in a borderline significant manner (P = 0.063) in the HTDD+ group versus the HTDD− group (see Table 2) [these LAV and LVM results will be published in another article written from this multipurpose study: (J Hypertens accepted for publication, 2014)].
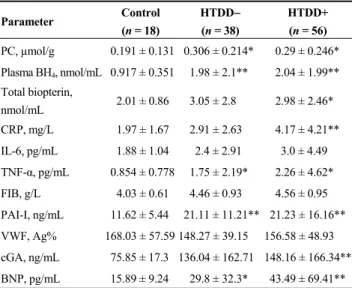
3.5 Biochemical measurements
Table 3 shows the biochemical measurement results.
There was no significant difference in any of the investi- gated biochemical parameters between the HTDD+ and HTDD− groups.
Table 3. Biochemical results.
Parameter Control
(n = 18)
HTDD− (n = 38)
HTDD+
(n = 56) PC, µmol/g 0.191 ± 0.131 0.306 ± 0.214* 0.29 ± 0.246*
Plasma BH4, nmol/mL 0.917 ± 0.351 1.98 ± 2.1** 2.04 ± 1.99**
Total biopterin,
nmol/mL 2.01 ± 0.86 3.05 ± 2.8 2.98 ± 2.46*
CRP, mg/L 1.97 ± 1.67 2.91 ± 2.63 4.17 ± 4.21**
IL-6, pg/mL 1.88 ± 1.04 2.4 ± 2.91 3.0 ± 4.49 TNF-α, pg/mL 0.854 ± 0.778 1.75 ± 2.19* 2.26 ± 4.62*
FIB, g/L 4.03 ± 0.61 4.46 ± 0.93 4.56 ± 0.95 PAI-I, ng/mL 11.62 ± 5.44 21.11 ± 11.21** 21.23 ± 16.16**
VWF, Ag% 168.03 ± 57.59 148.27 ± 39.15 156.58 ± 48.93 cGA, ng/mL 75.85 ± 17.3 136.04 ± 162.71 148.16 ± 166.34**
BNP, pg/mL 15.89 ± 9.24 29.8 ± 32.3* 43.49 ± 69.41**
*P < 0.05, **P < 0.01 vs. the control group. BH4: tetrahydrobiopterin; BNP:
B-type natriuretic peptide; cGA: chromogranin A; CRP: C-reactive protein;
FIB: fibrinogen; IL-6: interleukin-6; PAI-I: plasminogen activator inhibitor type I; PC: protein carbonylation; TNF-α: tumor necrosis factor- α; VWF:
von Willebrand factor.
3.5.1 Oxidative stress parameters
Protein carbonylation (PC) (P < 0.05 for both) and plasma BH4 levels (P < 0.01 for both) increased in both patient groups. Plasma total biopterin level (BH4 + BH2 + biopterin) increased in the HTDD+ group (P < 0.05).
3.5.2 Inflammatory parameters
Only a non-significant increase in IL-6 levels could be detected in the patient groups. While TNF-α levels were increased in both patient groups (P < 0.05 for both), CRP level increased (P < 0.01) only in the HTDD+ group.
3.5.3 Coagulation parameters
There was no significant difference in fibrinogen and VWF: Ag levels. PAI-I levels increased (P < 0.001) in both patient groups.
3.5.4 Neuroendocrine activation parameters
BNP level increased in both patient groups (P < 0.05 for the HTDD− group, P < 0.01 for the HTDD+ group). cGA level increased only in the HTDD+ group (P < 0.01) and showed a non-significant elevation in the HTDD− group.
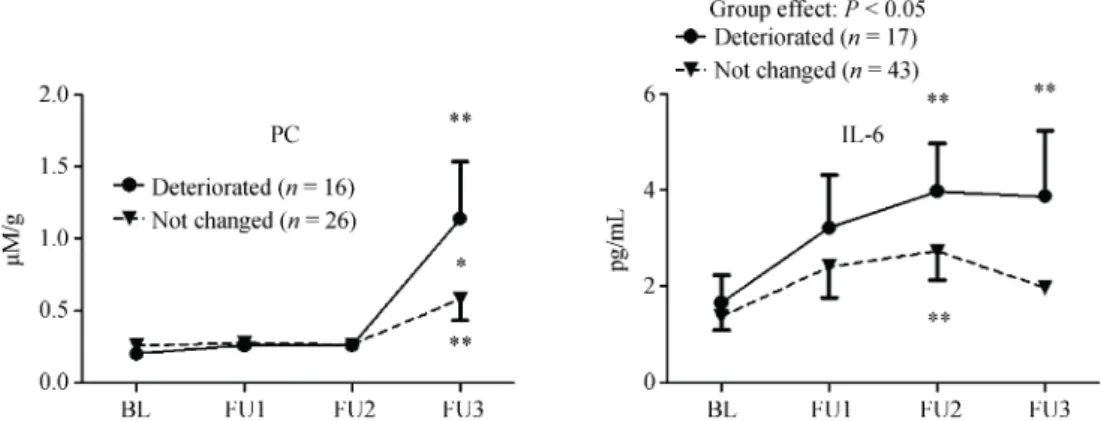
3.6 The relation of LV diastolic function to the bio- chemical parameters during follow-up
During follow-up, we found no change in LV diastolic function in case of 89 patients. However, in case of 19 pa- tients LV diastolic function deteriorated, and in case of four patients LV diastolic function improved with at least one grade. As the number of patients with improved LV dia- stolic function was limited, the data was not sufficient for statistical analysis. In case of patients whose LV diastolic function deteriorated during the follow-up, we found in- creased PC and IL-6 levels compared to the patients’ own baseline values (P < 0.01 for both PC and IL-6) and to the respective values of those patients whose LV diastolic func- tion remained unchanged (P < 0.05 for IL-6; and at the time of the 3rd follow-up examination, P < 0.05 for PC) (Figure 1).
During the follow-up, there was no difference in any other biochemical parameters between the two groups of patients whose LV diastolic function deteriorated and remained un- changed.
3.7 PWV and carotid score
The PWV increased in the HTDD+ group compared to the control group (P < 0.05), indicating the presence of atherosclerosis in the great arteries (Figure 2). The PWV of both patient groups combined was also greater than that of the control group (P < 0.05). The carotid score was greater in the HTDD+ group versus both the control and the HTDD− groups (P < 0.05 for both) (Figure 2).
3.8 Relevant correlations among the investigated pa- rameters
Table 4 highlights only the most important and relevant correlations.
BH4 and PAI-I levels showed an inverse correlation with the absolute values of longitudinal LV systolic and early diastolic myocardial deformation parameters.
The TNF-α and IL-6 levels also showed an inverse cor- relation with the absolute values of longitudinal LV systolic myocardial deformation parameters. Similarly, IL-6 level
http://www.jgc301.com; jgc@mail.sciencep.com | Journal of Geriatric Cardiology Figure 1. Comparison of protein carbonylation and IL-6 levels during follow-up in patients whose LV diastolic function remained unchanged or deteriorated. *P < 0.05, **P < 0.01. The table includes the results of only those patients who had at least three measurements of the investigated parameters during the follow-up. BL: baseline; IL-6: interleukin-6; FU: follow-up; LV: left ventricular; PC: protein car- bonylation.
Figure 2. Pulse wave velocity and carotid score results. *P <
0.05 versus the control group, #P < 0.05 versus the HTDD−group.
HTDD−: hypertensive patients without left ventricular diastolic dysfunction; HTDD+: hypertensive patients with left ventricular diastolic dysfunction; PWV: pulse wave velocity.
correlated inversely with the absolute values of longitudinal LV early diastolic myocardial deformation (SR).
cGA levels showed a positive correlation with the atrial conduction time estimated from the [(P wave-LA contrac- tion) − (P wave-right atrial contraction)] interval and the carotid score. Plasma BNP level showed a negative correla- tion with the absolute values of atrial myocardial deforma- tion parameters (Table 3) and with some more traditional parameters of LV systolic and diastolic function, such as mitral annulus M-mode excursion, mitral annulus peak sys- tolic velocity, mean E’. Plasma BNP level also showed a negative correlation with some recently proposed parame- ters of LV systolic dysfunction such as EF Simpson/LVM and EF Simpson/LVM/BSA.[25] Plasma BNP level showed a positive correlation with LAV, LAV/BSA, LVM/BSA and mean E/E’.
Table 4. The most relevant correlations.
Correlated parameters P r
BH4 with mean longitudinal LV peak S 0.02 0.251 With mean longitudinal LV peak systolic SR 0.002 0.329 With mean longitudinal LV peak early diastolic wave SR 0.008 −0.285 PAI-I with mean longitudinal LV peak S 0.014 0.232
With mean longitudinal LV peak early diastolic wave SR 0.009 −0.246 IL-6 with mean longitudinal LV peak S 0.008 0.249
With mean longitudinal LV peak early diastolic wave SR 0.009 −0.285 TNF-α with mean longitudinal LV peak S 0.025 0.213 cGA with (P wave-LAcontr int.) − (P wave-RAcontr int.) 0.026 0.22
With carotid score 0.018 0.254
BNP with mean atrial contraction period peak SR 0.004 0.274 With mean LA reservoir period peak S 0.016 −0.23 With mean LA reservoir period peak SR 0.004 −0.272 With mean mitral annulus M-mode peak excursion 0.036 −0.21 With mean mitral annulus peak systolic velocity < 0.001−0.352
With mean E’ 0.001 −0.301
With mean E/E’ 0.022 0.218
With LVM/BSA 0.028 0.257
With EF Simpson/LVM 0.03 −0.207
With EF Simpson/LVM/BSA 0.013 −0.243
With LAV 0.001 0.309
With LAV/BSA < 0.001 0.35
PWV with BNP 0.035 0.239
With LVM 0.041 0.23
With EF Simpson 0.009 −0.294
With ESV 0.01 0.293
With mean longitudinal LV peak S < 0.001 0.535 With mean longitudinal LV peak systolic SR < 0.001 0.51 With mean longitudinal LV peak early diastolic wave SR < 0.001−0.496 With mean atrial reservoir period peak S 0.012 −0.282 With mean atrial reservoir period peak SR < 0.001−0.389 BH4: tetrahydrobiopterin; BNP: B-type natriuretic peptide; BSA: body surface area; cGA: chromogranin A; contr: contraction; E: transmitral flow peak early diastolic filling velocity; E’: mitral annular peak early diastolic filling velocity; EF: ejection fraction; ESV: left ventricular end-systolic volume; IL-6: interleukin-6; Int.: interval; LA: left atrium; LAV: left atrial volume; LV: left ventricle; LVM: left ventricular mass; PAI-I: plasminogen activator inhibitor type I; S: strain; SR: strain rate; RA: right atrium; TNF-α:
tumor necrosis factor-α.
The PWV showed a strong inverse correlation with the absolute values of LV systolic and LV early diastolic myo- cardial deformation parameters and with EF Simpson. The PWV showed a negative correlation with the mean atrial reservoir period peak S and SR and a positive correlation with ESV, LVM and BNP.
4 Discussion
4.1 LV dysfunction and transition to HFPEF are due to oxidative stress and inflammation in hypertension
The increased PC and plasma BH4 levels in both patient groups versus the control group indicates the presence of oxidative stress in patients with hypertension and normal EF.
The markedly increased PAI-I levels in both patient groups compared to the control group are consistent with the pres- ence of increased oxidative stress, as it has been proved that PAI-I levels increase in parallel with oxidative stress.[26,27]
There is some evidence that increased plasma BH4 levels are associated with decreased tissue BH4 levels leading to nitric oxide NOS uncoupling, and as a corollary, increased oxidative stress.[28,29] The increased TNF-α levels in both patient groups (HTDD+ and HTDD−) and the increased CRP level in the HTDD+ group compared with the control group verifies the presence of inflammation in our patients.
Hypertension is the most common underlying cause and precursor condition of HFPEF. The transition of hyperten- sive heart disease to HFPEF is characterized by progressive LV hypertrophy and the deterioration of LV diastolic and atrial functions.[30] Our results demonstrated that in patients whose LV diastolic function deteriorated during follow-up, PC and IL-6 levels increased compared to their own base- line values and to those patients’ values whose LV diastolic function remained unchanged during follow-up. LVM in- creased in line with the progressive LV diastolic dysfunc- tion. Increased plasma BH4 levels have been shown to be associated with decreased endothelial and possibly with decreased tissue BH4 levels.[28,29] Thus, it is likely that the increased plasma BH4 levels in our patients can be associ- ated with decreased NOS cofactor myocardial BH4 levels.
This leads to myocardial NOS uncoupling and causes myo- cardial oxidative stress. In hypertensive mouse HFPEF models,[13,14,31] it was elegantly shown that it is myocardial oxidative stress due to myocardial NOS uncoupling that is responsible for HFPEF, not oxidative stress in general or hypertension in itself. Thus, our results demonstrate that inflammation, oxidative stress and decreased tissue BH4
levels–particularly myocardial oxidative stress due to myo- cardial NOS uncoupling–promote unfavorable changes that might accelerate the transition of hypertensive heart disease to HFPEF.
Plasma BH4, PAI-I, TNF-α and IL-6 levels showed an inverse correlation with the absolute values of longitudinal LV systolic and, with the exception of TNF-α, with the lon- gitudinal early diastolic myocardial deformation parameters as well. This further reinforces the hypothesis that increased oxidative stress and inflammation may not only play a ma- jor role in the deterioration of LV diastolic function, but may have a potential pathogenetic role in LV systolic dys- function as well.
4.2 Increased atherosclerosis in line with progressive LV diastolic dysfunction
The increased PWV and the increased carotid score in the HTDD+ group versus the control and HTDD− groups indicate the presence of advanced atherosclerosis in the great arteries in line with the deterioration of LV diastolic function. Based on the evidence for a pathogenetic role of oxidative stress and inflammation in atherosclerosis,[32,33] it can be assumed that increased oxidative stress and inflam- mation contribute to the transition of hypertensive heart disease to HFPEF and LV systolic and diastolic dysfunction in patients with hypertension, and at the same time result in increased atherosclerosis of great arteries.
4.3 Possible causes of atrial dysfunction in patients with hypertension and normal EF
Our findings that cGA levels increased in the HTDD+
group versus the controls, showed a positive correlation with the atrial conduction time, showed an inverse correla- tion with the absolute values of atrial myocardial deforma- tion parameters and a positive correlation with LA volume and LA volume/BSA, indicate that neuroendocrine activa- tion occurring as a sequela of LV systolic and diastolic dys- function may significantly contribute to the development of atrial dysfunction in hypertensive patients. Atrial dysfunc- tion might be also an important determinant of the transition of hypertensive heart disease to HFPEF.[30] BNP levels cor- relate inversely with some more traditional markers of LV systolic and diastolic dysfunction, and it suggests that neu- roendocrine activation contributes to the deterioration of LV systolic and diastolic function in these patients.
4.4 Clinical implications
We believe that our results have significant clinical ap- plications. To the best of our knowledge, currently there is no evidence-based treatment for HFPEF. In line with the results of other authors,[13,14,28,31] our findings also support the observation that administrating BH4 to inhibit myo- cardial NOS uncoupling might prevent the underlying con-
http://www.jgc301.com; jgc@mail.sciencep.com | Journal of Geriatric Cardiology
ditions from developing into HFPEF, or might be able to reverse manifestations of HFPEF.
4.5 Limitations
An important limitation of our study is that we were not in the position to perform biochemical measurements from myocardial samples for ethical reasons. Therefore, we could not measure myocardial BH4 levels and thus could not pro- vide direct evidence for myocardial NOS uncoupling in our patients. Moreover, while at the start of the study none of our patients had HFPEF, during the follow-up only two pa- tients developed this condition, which is a further limitation.
Thus we could only verify that in case of patients with hypertension and normal EF (the most common precursor of HFPE) oxidative stress and inflammation can be linked to the deterioration of LV diastolic function, atrial dysfunction and progression of LV hypertrophy. All of these are impor- tant determinants of the transition of hypertensive heart dis- ease to HFPEF.
As it was difficult to find ≥ 60-year-old healthy controls in a hospital environment who met all the selection criteria, the number of control patients was also relatively small.
4.6 Conclusions
Our results suggest that increased oxidative stress (par- ticularly myocardial oxidative stress due to myocardial NOS uncoupling) and inflammation are not just epiphenomena in patients with hypertension and normal EF, but it is more likely that they play a pathogenetic role in subtle LV sys- tolic dysfunction and deterioration of LV diastolic function and contribute to progressive atherosclerosis in the great arteries. Subtle LV systolic dysfunction and the deteriora- tion of LV diastolic function are associated with progressive LV hypertrophy, neuroendocrine activation and atrial dys- function, and all these factors are considered to be important determinants of the transition of hypertensive heart disease to HFPEF.
Acknowledgements
Vereckei A received the K 67971 grant from the Hun- garian National Scientific Research Fund (OTKA). The authors declare no conflict of interest.
References
1 Borlaug BA, Paulus WJ. Heart failure with preserved ejection fraction: pathophysiology, diagnosis and treatment. Eur Hear J 2011; 32: 670–679
2 Paulus WJ, Tschöpe C. A novel paradigm for heart failure
with preserved ejection fraction. J Am Coll Cardiol 2013; 62:
263–271.
3 van Heerebeck L, Franssen CPM, Hamdani N, et al. Molecu- lar and cellular basis for diastolic dysfunction. Curr Heart Fail Rep 2012; 9: 293–302.
4 Kalogeropoulos A, Georgiopoulou V, Psaty BM, et al. In- flammatory markers and incident heart failure risk in older adults. The health ABC (Health, Aging and Body Composi- tion) Study. J Am Coll Cardiol 2010; 55: 2129–2137.
5 Collier P, Watson CJ, Voon V, et al. Can emerging bio- markers of myocardial remodelling identify asymptomatic hypertensive patients at risk for diastolic dysfunction and dia- stolic heart failure? Eur J Heart Fail 2011; 13: 1087–1095.
6 Westermann D, Lindner D, Kasner M, et al. Cardiac inflam- mation contributes to changes in the extracellular matrix in patients with heart failure and normal ejection fraction. Circ Heart Fail 2011; 4: 44–52.
7 van Heerebeck L, Hamdani N, Handoko ML, et al. Diastolic stiffness of the failing diabetic heart: importance of fibrosis, advanced glycation end products and myocyte resting tension.
Circulation 2008; 117: 43–51.
8 Griendling KK, Sorescu D, Ushio-Fukai M. NAD(P)H oxi- dase: role in cardiovascular biology and disease. Circ Res 2000; 86: 494–501.
9 van Heerebeck L, Hamdani N, Falcao-Pires I, et al. Low myocardial protein kinase G activity in heart failure with pre- served ejection fraction. Circulation 2012; 126: 830–839.
10 Akiyama E, Sugiyama S Matsuzawa Y, et al. Incremental prognostic significance of peripheral endothelial dysfunction in patients with heart failure and normal left ventricular ejec- tion fraction. J Am Coll Cardiol 2012; 60: 1778–1786.
11 Schulz E, Jansen T, Wenzel P, et al. Nitric oxide, tetrahydro- biopterin, oxidative stress and endothelial dysfunction in hy- pertension. Antioxid Redox Signal 2008; 10: 1115–1126.
12 Cunnington C, Channon KM. Tetrahydrobiopterin: pleiotropic roles in cardiovascular pathophysiology. Heart 2010; 96:
1872–177.
13 Silberman GA, Fan T-HM, Liu H, et al. Uncoupled cardiac nitric oxide synthase mediates diastolic dysfunction. Circula- tion 2010; 121: 519–528.
14 Moens AL, Takimoto E, Tocchetti CG, et al. Reversal of car- diac hypertrophy and fibrosis from pressure overload by tet- rahydrobiopterin. Efficacy of recoupling nitric oxide synthase as a therapeutic strategy. Circulation 2008; 117: 2626–2636.
15 Levine RL, Williams JA, Stadtman ER, et al. Carbonyl assays for determination of oxidatively modified proteins. Methods Enzymol 1994, 233: 346–573.
16 Fukushima T, Nixon JC. Analysis of reduced forms of biop- terin in biological tissues and fluids. Anal Biochem 1980; 102:
176–188.
17 Fekkes D, Voskuilen-Kooijman A. Quantitation of total biop- terin and tetrahydrobiopterin in plasma. Clin Biochem 2007;
40: 411–413.
18 Szabo G, Molvarec A, Stenczer B, et al. Natriuretic peptide
precursor B gene (TTTC)(n) microsatellite polymorphism in pre-eclampsia. Clinica Chimica Acta 2011; 412: 1371–1375.
19 Szabo G, Molvarec A, Nagy B, et al. Increased B-type natri- uretic peptide levels in early-onset versus late-onset pree- clampsia. Clin Chem Lab Med 2014; 52: 281–288.
20 Salvi P, Lio G, Labat C, et al. Validation of a new non-inva- sive tonometer for determining arterial pressure wave and pulse wave velocity: the PulsePen device. J Hypertens 2004;
22: 285–293.
21 Othmane TEH, Nemcsik J, Fekete BC, et al. Arterial stiffness in hemodialysis: Which parameter to measure to predict cardiovascular mortality? Kidney Blood Press Res 2009; 32:
250–257.
22 Lang RM, Bierig M, Devereux RB, et al. Recommendations for chamber quantification: A report from the American Soci- ety of Echocardiography’s Guidelines and Standards Com- mittee and the Chamber Quantification Writing Group, de- veloped in conjunction with the European Association of Echocardiography, a branch of the European Society of Car- diology. J Am Soc Echocardiogr 2005; 18: 1440–1463.
23 Devereux RB, Alonso DR, Lutas EM, et al. Echocardio- graphic assessment of left ventricular hypertrophy: compari- son to necropsy findings. Am J Cardiol 1988; 57: 450–458.
24 Nishimura R, Tajik AJ. Evaluation of diastolic filling of left ventricle in health and disease: Doppler echocardiography is the clinician’s rosetta stone. J Am Coll Cardiol 1997; 30:
8–18.
25 MacIver DH. Current controversies in heart failure with a preserved ejection fraction. Future Cardiol 2010; 6: 97–111.
26 Nakayama N, Nakamura T, Okada H, et al. Modulators of
induction of plasminogen activator inhibitor type-1 in HepG2 cells by transforming growth factor. Coron Artery Dis 2011;
22: 468–478.
27 Rui-Ming L. Oxidative stress, plasminogen activator inhibi- tor 1, and lung fibrosis. Antioxid Redox Signal 2008; 10:
303–319.
28 Antoniades C, Shirodaria C, Crabtree M, et al. Altered plasma versus vascular biopterins in human atherosclerosis reveal re- lationships between endothelial nitric oxide synthase coupling, endothelial function and inflammation. Circulation 2007; 116:
2851–2859.
29 Katusic ZS, d’Uscio L, Nath KA. Vascular protection by tet- rahydrobiopterin: Progress and therapeutic prospects. Trends Pharmacol Sci 2009; 30: 48–54.
30 Melenovsky V, Borlaug BA, Rosen B, et al. Cardiovascular features of heart failure with preserved ejection fraction versus nonfailing hypertensive left ventricular hypertrophy in the ur- ban Baltimore community. J Am Coll Cardiol 2007; 49:
198–207.
31 Takimoto E, Champion HC, Li M, et al. Oxidant stress from nitric oxide synthase-3 uncoupling stimulates cardiac patho- logic remodeling from chronic pressure load. J Clin Invest 2005; 115: 1221–1231.
32 Peluso I, Morabito G, Urban L, et al. Oxidative stress in atherosclerosis development: the central role of LDL and oxidative burst. Endocr Metab Immune Disord Drug Targets 2012; 12: 351–360.
33 Violi F, Pignatelli P, Pignata C, et al. Reduced atherosclerotic burden in subjects with genetically determined low oxidative stress. Arterioscler Thromb Vasc Biol 2013; 33: 406–412.