1
Atomistic Origins of Fracture Toughness of Bioactive Glass Cement During Setting
Ph.D thesis
Tian Kun
Doctoral School of Clinical Medicine Semmelweis University
Supervisor: Dr. Dobó Nagy, Csaba, professor, Ph.D Head of doctoral school of
clinical medicine:
Dr. Varga, Gábor, professor, doctor of the HAS, Ph.D
Official reviewers: Dr. Turzó, Kinga, associate professor, Ph.D Dr. Kellermayer, Miklós, professor, doctor of the HAS, Ph.D
Head of the final examination
committee: Dr. Hermann, Péter, professor, Ph.D
Members of the final examination committee:
Dr. Hegedűs, Csaba, professor, Ph.D Dr. Fábián, Gábor, associate professor, Ph.D
Budapest
2014
2
1 Introduction
1.1 Background
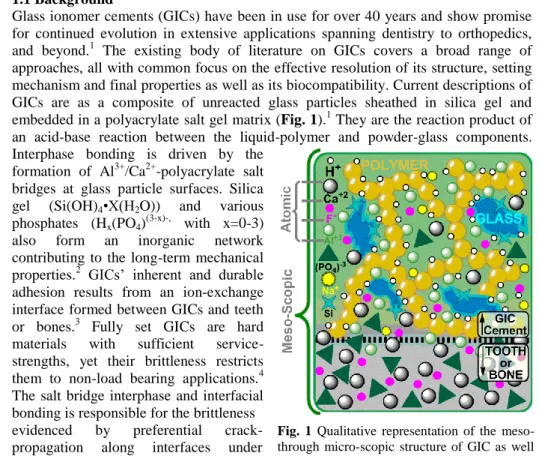
Glass ionomer cements (GICs) have been in use for over 40 years and show promise for continued evolution in extensive applications spanning dentistry to orthopedics, and beyond.1 The existing body of literature on GICs covers a broad range of approaches, all with common focus on the effective resolution of its structure, setting mechanism and final properties as well as its biocompatibility. Current descriptions of GICs are as a composite of unreacted glass particles sheathed in silica gel and embedded in a polyacrylate salt gel matrix (Fig. 1).1 They are the reaction product of an acid-base reaction between the liquid-polymer and powder-glass components.
Interphase bonding is driven by the formation of Al3+/Ca2+-polyacrylate salt bridges at glass particle surfaces. Silica gel (Si(OH)4•X(H2O)) and various phosphates (Hx(PO4)(3-x)-, with x=0-3) also form an inorganic network contributing to the long-term mechanical properties.2 GICs’ inherent and durable adhesion results from an ion-exchange interface formed between GICs and teeth or bones.3 Fully set GICs are hard materials with sufficient service- strengths, yet their brittleness restricts them to non-load bearing applications.4 The salt bridge interphase and interfacial bonding is responsible for the brittleness evidenced by preferential crack- propagation along interfaces under material failure.5
Extensive characterisation of the Al-
polyacrylate salt bridge using differing techniques (IR, NMR, etc.) has led to the conclusion that a portion of the Al coordination evolves from IV→V→VI during cementation, driving relevant time-dependent property changes of GICs. Specifically, maximising Al(VI) coordination and cross-linking was thought to be most desirable for increasing strength.6,7 However, several recent works evidence GICs as being over-crosslinked, and potentially the underlying aspect of their observed low fracture toughness (i.e. brittleness);4 increase of strength at the detriment of toughness is well established in materials science.8
DS/ISO/R 1565:1978 - directed mandates have orphaned material and mechanical characterisations of GICs to the post-setting domain (i.e. > 24 hours), whilst atomistic descriptions are severely lacking or entirely absent.
European Union's strategy for reducing global exposure to mercury9 has highlighted alternatives to dental silver-mercury amalgams, led by GICs. The continued drive to optimise GICs shows promise as posterior filling materials if the current shortcomings, e.g. brittleness, can be overcome.
Fig. 1 Qualitative representation of the meso- through micro-scopic structure of GIC as well as the interface between GIC and tooth/bone.
3 1.2 Challenges
Although much has been done on modifications to GICs and their components towards improved material properties, progress is incremental. Unfortunately most approaches to optimising material performance rely on combinatorial (trial-and-error) or serendipitous means.
Lacking fundamental understanding of the structure and dynamics of set (hardened) GICs, or of the setting process itself, leaves the rational optimisation and design of GICs in its infancy.
Timing is optimal for introducing novel approach towards rational characterisation and design for optimised material performance.
1.3 Novel techniques 1.3.1 Neutron Spectroscopy
Use of neutrons in spectroscopy has significant advantages over other forms of radiation in the study of microscopic structure and dynamics of materials. The interaction of a neutron with the nucleus of an atom is element specific and mediated by the strong nuclear force, while also being insensitive to the electronic environment, making them a highly penetrating non-destructive probe.10
At a spallation source, production of neutrons is achieved by neutron spallation reaction (Fig. 2). It produces neutrons of much higher energies than those produced in nuclear reactors and higher neutron
flux (average ~2×10¹³ n/cm2/s, peak flux ~8×10¹⁵ n/cm2/s).
Another advantage is the temporal control of neutrons departure from the target, and their energies can be derived from their time of flight (TOF) from the moderator to the detectors.11
1.3.1.1 Neutron Compton Scattering (NCS)
Also called Deep Inelastic Neutron Scattering (DINS) (Fig. 3) is the only effective technique at present for deriving the single-particle (atomic and molecular) momentum distributions, n(p), in condensed matter systems.12
1.3.1.2 Neutron diffraction
Neutron diffraction uses neutron
scattering to obtain a diffraction pattern that provides information on the structure of a Fig. 2 Illustration of neutron spallation reaction.
Fig. 3 Schematic of VESUVIO instrument.
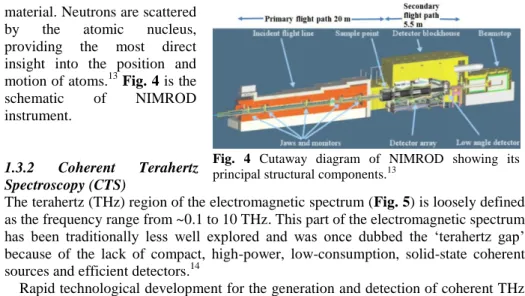
4 material. Neutrons are scattered
by the atomic nucleus, providing the most direct insight into the position and motion of atoms.13 Fig. 4 is the schematic of NIMROD instrument.
1.3.2 Coherent Terahertz Spectroscopy (CTS)
The terahertz (THz) region of the electromagnetic spectrum (Fig. 5) is loosely defined as the frequency range from ~0.1 to 10 THz. This part of the electromagnetic spectrum has been traditionally less well explored and was once dubbed the ‘terahertz gap’
because of the lack of compact, high-power, low-consumption, solid-state coherent sources and efficient detectors.14
Rapid technological development for the generation and detection of coherent THz radiation over the past ~20 years has allowed this (relatively) unexplored region - traditionally relegated to the preserves of physicists and engineers - to become a useful analytical tool accessible to users in many areas spanning the physical, materials and biological sciences.
CTS is unique in that it is able to characterise extremely low energy phenomena (i.e. ~10-1 to 102 meV), including elusive vibrational modes involving whole molecule collective motions and interfacial dynamics (Fig. 5). In addition, the time-gated radiations sources can easily be adjusted to the femtosecond (fms, 10-15 s) timescale, facilitating ultra-short time resolved measurements of dynamic phenomena.14
Fig. 5 Illustration of the THz region (blue shadow) on the electromagnetic spectrum.
Fig. 4 Cutaway diagram of NIMROD showing its principal structural components.13
5 1.3.3 Computational Modeling
The intention of a scientific inquiry is to obtain an understanding and control of some parts of the universe. However, the universe is not so simple that it can be grasped and controlled without abstraction. Abstraction consists in replacing the parts of the universe by a model of similar but simpler structure. Abstract models can be considered as the starting point of theory.
The importance of molecular modeling is represented by two of the Nobel Prizes:
1. The 1998 Chemistry Nobel Prize was awarded to Pople and Kohn for their
‘development of computational methods’ and ‘density functional theory.’
2. The 2013 Chemistry Nobel Prize was awarded to Karplus, Levitt and Warshel for the ‘Development of multiscale models.’
With the emergence of supercomputers and ever-more economical computing, ab initio and especially DFT computations15,16 have become a viable alternative to characterising (bio)molecular and material systems, advancing our understanding of the universe and allowing rational design of novel materials to help us meet the challenges of tomorrow.
2 Dissertation objectives
Based on the current state and challenges on GIC research, the objectives of this dissertation are as follows:
1. To undertake an exhaustive survey of all relevant literature on GICs and dental materials towards formulation of an agenda-changing research program;
2. To rationally characterise the microscopic structure, setting dynamics in commercially available GICs;
3. To resolve atomistic origin of fracture toughness towards rational characterisation and design of such materials for optimised clinical performance;
4. To pioneer the application of novel experimental techniques affording structural, energetic and temporal resolution not previously attained for GICs.
6
3 Materials and Methods
Conventional acid-base setting GICs were investigated in this trans-disciplinary work.
This work is composed of three series of studies:
1. Mechanical testing and fractography;
2. Neutron experiments;
3. Complementary experiments.
3.1 Mechanical testing and fractography Commercial GIC (Fuji IX capsule) was used to prepare 10 pieces each of normal (2×10 mm) and miniature samples (0.2×1 mm) in purpose-made aluminium moulds.
The miniature samples were scanned before and after Hertzian indentation testing (Fig. 6) with X-ray micro tomography (µCT) (SkyScan 1172, Kontich, Belgium). Two of the broken samples were scanned with nanoCT (SkyScan 2011, Kontich, Belgium).
Samples were tested resting freely on a 30%
glass fibre-reinforced polyamide (elastic modulus
10 GPa) substrate of 5 mm thickness×10 mm diameter, using a universal testing machine (Z005, 121-001609, Zwick, Germany). Loading was applied centrally on the sample through a 100Cr6 steel ball bearing of 20 mm diameter (2 mm for the miniature samples) at a crosshead speed of 0.2 mm/min till failure.5
The larger samples were examined after mechanical testing with an optical stereo microscope (Meiji, China), as well as with a scanning electron microscope (Hitachi S- 2460N, Tokyo, Japan), under vacuum.
3.2 Neutron experiments
Commercial G338 glass powder and Chemflex liquid, the basis of commercial GIC powders and liquid, were used in neutron experiments. Each of these two components as well as the composite produced by mixing these two at ratio of ~2.5 powder/liquid were measured with both techniques at 3000.1K at the ISIS pulsed neutron and muon source at the Rutherford Appleton Laboratory (RAL, Harwell, Oxfordshire, UK). GIC composite cement was also measured with NCS at 280 K and 300 K. Data treatment was done using data analysis packages provided by ISIS.
3.3 Complementary experiments
G338 glass powder and Chemflex liquid and composite GIC produced by mixing these two at ratio of ~2.5 powder/liquid were used in complementary TEM, DSC and CTS experiments.
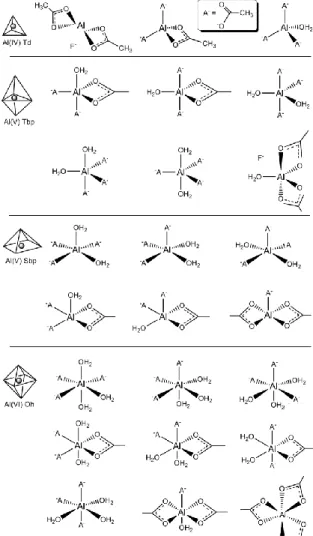
Quantum chemical computations were undertaken with the Gaussian 09 program package (G09).17 Preliminary Al-coordination permutation models (Fig. 7) were constructed to characterise the influence of axial and equatorial ligands on 27Al-NMR shifts relative to the experimental standard (AlCl3•6H2O). These models and the NMR Fig. 6 Hertzian indentation test geometry.
7
standard were geometry-optimised using the DFT Becke-3-Lee-Yang-Parr correlation (B3LYP) method,18 employing the all-electron DGDZVP basis set. NMR shifts were determined on the optimised structures using the well-established Gauge-Independent Atomic Orbital (GIAO) method19 and compared to the shift of the standard. Secondary computations on these models were subsequently completed using the MP2(full) method and DGDZVP basis set, with trends mirroring those emerging from the DFT
computations.
In order to study the collective vibrational interaction between PAA and glass particles we have assembled many-atom organic- inorganic clusters based on the geometry-optimised ab initio model. Representative cement models were built with PAA oligomers attached via a Al(V) to a glass substrate with the composition of anorthite (CaAl2Si2O8), modelled as a hydrated 8-unit molecular cluster (Ca8Al16Si16O64H40, 164 atoms). A 78-atom, 396- electron, top-slice of this model characterised interfacial Al-coordination changes through stretching and compression of COO- ligatures, resulting in Td and Oh Al-coordination, respectively. Relative contributions to free-energy of each normal mode of vibration were plotted as a function of frequency and grouped by motion-types.
Fig. 7 Preliminary Al-coordination permutation models.
8
4 Results
4.1 Mechanical testing and fractography A representative force-displacement plot is shown in Fig. 8.The scale of scatter in failure load for normal size samples was relatively high, yet is typical of the variability expected in practical and clinical applications.
Fracture processes cannot be treated as 2-D phenomena, but instead as 3-D systems; µCT imaging in 3-D facilitates imaging of such material failure. The nanoCT image in Fig. 9
presents the spatial relationship between the microcracks and the glass cores, as well as the microcracks propagated along the edges and sides of the glass cores (glass core-matrix interface).5
4.2 Neutron experiments
This work represents the 1st inelastic neutron scattering reported on dental composites. Although neutron diffraction has been employed to study structure in static systems, our work pioneers the application of neutron scattering in the characterisation of cementation dynamics in a dental composite.
4.2.1 NCS results
The calculated NCS width values of all the 9 elements were weighted with stoichiometry to obtain the GIC NCS width over setting time.
In terms of single particle scattering NCS peak width is a measure of atomic potential and cohesion. The calculated
mean kinetic energy (KE) is proportional to the amount of energy needed to put an atom in recoil state. In terms of atomic fracture, this KE will be proportional to the amount of energy needed to break the bonds, which resembles fracture toughness.
Therefore, NCS widths and intrinsic fracture toughness KC are expected to be related. Indeed it was found that NCS width values for GICs and its related groups (Fig. 10) vary inversely with reported values of KC.
Fig. 8 Typical force-displacement plot, presented as % of failure load as a function of % displacement at failure.5
Fig. 9 Nano CT image showing that microcracks propagating along the interface of the matrix and glass cores (arrow and oval).5
Fig. 10 Calibrated NCS peak widths vs fracture toughness for relevent materials.
9
The breadth of the KC data for each material increases between silica glass and the polymers. This related to the statistical nature inherent in fracture mechanics methods (~10%) and sample-to-sample variability, governed, for example, by glass particle sizes in GICs, and by molecular weight in polymers. Nevertheless the dashed curve provides a practical look-up-table to calibrate NCS widths in Å-1 with fracture toughness in MPa m0.5. It has been used to convert the overall NCS widths of GIC into overall GIC fracture toughness in Fig. 11.
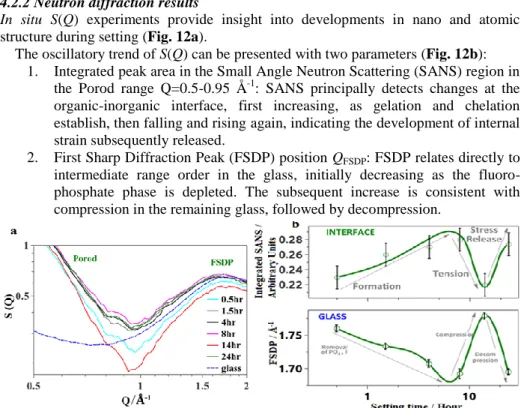
4.2.2 Neutron diffraction results
In situ S(Q) experiments provide insight into developments in nano and atomic structure during setting (Fig. 12a).
The oscillatory trend of S(Q) can be presented with two parameters (Fig. 12b):
1. Integrated peak area in the Small Angle Neutron Scattering (SANS) region in the Porod range Q=0.5-0.95 Å-1: SANS principally detects changes at the organic-inorganic interface, first increasing, as gelation and chelation establish, then falling and rising again, indicating the development of internal strain subsequently released.
2. First Sharp Diffraction Peak (FSDP) position QFSDP: FSDP relates directly to intermediate range order in the glass, initially decreasing as the fluoro- phosphate phase is depleted. The subsequent increase is consistent with compression in the remaining glass, followed by decompression.
Fig. 12 a, S(Q) of the GIC time series and glass (blue dashed line). Porod range and FSDP are marked; b, integrated peak area under the S(Q) curves (top) and First sharp diffraction peak position FSDP (bottom).
Fig. 11 Calibrated fracture toughness of GIC with representative error bar. The assigned coupling point, setting point and interfacial stress zone are also marked.
10
Fig. 13 Δg(r) between 14 h and 8 h, 24 h and 14 h cements with the major atomic bond changes marked with arrows.
The total pair distribution functions g(r) differentiated for the three time points of interest (Fig. 13) shows that at
~14 h Al(IV) dominates, aligning with the unexpected KC recovery observed with NCS.
4.3 Complementary experiments 4.3.1 DSC results
The large exothermic peak at 316-460 °C (Fig. 14) is the manifestation of typical energy release in a hyper-quenched (>104
°C/s) glass upon thermal excitation. The two marked glass transition temperatures (Tg1 = 425 °C, Tg2 = 513 °C) show that G338 is a phase-separated glass.
The 60-h GIC cement has similar features as the upscan-2 plot of G338. It seems cementation has the same effect as heat annealing in allowing the glass to release the stress created in the glass by hyper-quenching.
4.3.2 TEM results
TEM image (Fig. 15) shows obvious phase separation of 50 nm globules within a matrix, attributed to apatite and aluminosilicate respectively. Finer structure within the globules may relate to hierarchical scaling or to a third glass phase, evidence for this coming from the shoulder between Tg1 and Tg2 in Fig. 14.
4.3.3 CTS results
The time-dependent features as the sum of all of the 2001 frequency points from 220 to 325 GHz collected over the course of the experiment is plotted in Fig. l6. GIC plots being in the middle of those of glass and polymer is expected as GIC is the mixture of these two components and setting features are the results of their reactions. Indeed the minimum at 3 hours setting, where this starts, aligns with the first feature in the elemental
Fig. 14 DSC output.
Fig. 15 TEM image of a single particle, revealing complex phase separation.
11
Fig. 16 The green trace of GIC spectral response at frequencies 220-325 GHz.
toughness of hydrogen and oxygen, elements which dominate the composition of GIC. Furthermore the inflection point in THz absorbance ~10 h coincides with the setting point in KC (Fig. 11). Low frequency collective vibrations clearly influence the setting of cement.
4.3.4 Computational Modeling results NMR predictions (Fig. 17) for 27Al- chemical shifts for multiple Al-polymer models (Fig. 7) show results basically in good agreement with experiment,6 except for that theory predicts shifts for Al(IV) and Al(VI) to extend further up- and down-field, respectively, than the experimental assignments. The experimental-theoretical agreement validates the preliminary models accuracy. However, a pronounced amount of region-overlap (i.e. Al(IV) upfield of V and VI coordinates) leads to the conclusion that further and more-extensive modeling is required. Thus the bigger model (Fig. 18) was constructed.
Examples of model polymer-glass linkages computed for the commercial GIC are illustrated in Fig. 19, and are characterised by differing degrees of aluminium coordination.
The most stable structure is the Al(V)- coordinate square-based pyramidal (SBP) featuring two equatorial carboxylate links to the polymer with one bridging oxygen linking with the glass. This SBP configuration is dynamically linked to tetrahedral and octahedral arrangements.
These frequencies influence the molecular conformations resulting in Al configurations. Interestingly transferring between aluminium coordinations involves local stress; expansion and compression of the Al(V) SBP structure yields tetrahedral Al(IV) and strained octahedral Al(VI) Fig. 17 27Al NMR predictions.
Fig. 18 Collective organic-inorganic vibrations of a PAA strand attached to an alumina-silicate glass cluster.
12
structures, respectively (Fig. 19a). The former occurs through a reduction of one carboxylate group, the latter via the formation of a new Al-carboxylate interaction, with concurrent twisting and
weakening of the two carboxylate ligatures.
This emphasis show changes in the number of oxygen coordinated to aluminium are dictated more widely by conformational changes in the polysalt complex.
Considering the compressive stresses that build up within the organic matrix during hardening through the formation of octahedral complexes, and the shrinkage of the glass particles, both should result in tension at the interface, which would explain the observation of the Al(IV) Td structure as the toughness maximum is approached.
Thereafter, the restoration of the octahedral Al(VI) structure concurs with internal interfacial stress being released (Fig. 19a).
This is consistent in turn with the development of interfacial flaws,
ultimately reducing strength σY, propagating when compressive stress is applied externally observed in the mechanical testing section.
The majority of the numerous vibrational modes determined for these multi-atom models show a distinct red-shifting with increasing Al(IV) structures (Fig. 4.19b), indicating flexible sites consistent with increased deformability of the interface.
Conversely, the majority of the modes blue-shift with increasing Al(VI) structures (Fig. 4.19b), indicative of a more rigid connection which would explain the increasing brittleness observed at later setting times. The difference in the relative contributions of the vibrational modes and zero point energies to the overall Gibbs Free-energies for these related models show the clear dominance of low-energy (<15 THz) collective modes. The predictions highlight the relationship between Al-coordination and overall flexibility or rigidity. Moreover, these coordination changes are reversible due to their being effected through changes in carboxylate ligatures, and mimic the Al(VI) – Al(V) – Al(IV) conversions found from this in situ structure factor experiments (Fig. 13).
Fig. 19 a, Cartoons of the Al-coordination changes;
b, difference in the relative contributions to Gibbs free-energy as a function of frequency for the V- vs.
IV-coordinate (left) and V- vs. VI-coordinate (right) Al structures. Vibrational modes have been grouped to address statistical dispersion.
13
5 Conclusions
An unexpected oscillatory setting profile has been observed both in high-energy neutron scattering, small and wide-angle neutron diffraction and low-energy CTS experiments, with complementary results provided by computational models using density functional theory.
The initial expectations and beliefs that setting is monotonic or ‘1st order’ and thus that the oscillatory trends observed were somehow flawed or ‘unphysical’ in nature.
However, exhaustive literature searches turned up several works showing an oscillatory trend over setting time in GICs, measured with differing techniques and spanning several decades, including cation-precipitation, extrinsic fracture toughness and NMR characterisations of changing coordination ratios Al(VI)/Al(V) +Al(IV) (Fig. 20).1,6,20 This further supported the possibility that cementation in these glassy cementitous systems may in fact not be monotonic, as previously thought. In each of these works, these trends occurred in the ~1-16 hour time period, mirroring the pre-24 hour times highlighted in this dissertation.
The explanation for this observation is discussed in detail in the previous sections, and may be summarised in the following key conclusive points:
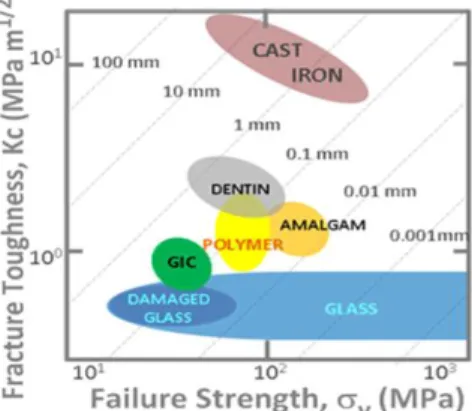
1. Mechanical yield strength
Y and fracture toughness KC of materials generally form groups (Fig. 21)8, ranging from soft to hard and with brittle to ductile behaviour. Within this scheme GICs and their components cluster around dentin and amalgam, the conventional restorative, in the zone occupied by industrial polymers. Although the plastic-zone size of dental materials is comparable with the geometry of caries in the initial stage, GICs clearly have less toughness and strength than dentin.2. While strength
Y lies extrinsically in existing defects, such as cracks and voids, fracture toughness KC, or damage tolerance, is intrinsic to the material.For composites like GICs both
Y and KC clearly develop during the setting process from a deformable incompressible slurry to a compressible gel, then rigid cement. Usually, the more rigid a material is, the higher its shear modulus G, the lower the toughness KC and the more brittle it is. Conversely Fig. 20 Time-dependent ordinating trends adopted from the literature. 1,6,2014 deformability correlates with toughness and ductility.
Atomistically, compressibility
relates directly to the shape of the interatomic or Morse potential,21 the narrower this is, the stronger and more rigid the chemical bond and vice versa. In particular, Poisson’s ratio
, a function of 1/G, reveals a sharp demarcation around
=1/3 between brittleness and ductility when this is expressed through the Fracture Energy GC. As setting advances,
falls from around 0.5 to 0.3 leaving GICs marginally more
brittle than dentin or amalgam. During this process inter-component bonding in GICs develops as the rigid
m size glass particles come into contact with the deformable aqueous polyacrylic acid. Macroscopically, these organic- inorganic interfaces are where mechanical failure eventually occurs with the generation of extrinsic faults which affects
Y.3. At the molecular level water leaches into the glass, as for other tetrahedral oxide glasses, rupturing bridging oxygens to form SiOH and AlOH groups, and initially creating an alumina-siliceous gel at the surface. Ca2+ and Na+ ions, that charge-compensate AlO4 polyhedra in the glass powder, are released ahead of Al3+ ions, the latter predominately cross-linking the polymer acid to form a strong polysalt matrix. Al-chelation accompanies the conversion of Al-O4 to high coordinate sites and appears pivotal in the resulting mechanical properties of GICs. Hydration has two effects: 1.
weakens the glass network and facilitate ion leaching; 2. promotes ionisation of the polymeric carboxylic acid, formation of salt bridges to a stronger Al network. Hydration is accompanied by increase in strength and decrease of plasticity (toughness).22 So the origin of brittleness is the bonding at the matrix-filler interface, especially the higher Al-coordination at the later setting stage (stronger but more brittle, proved from DFT results) and loss of water from the matrix.
Fig. 21 Toughness KC vs. Strength F for dental materials, plastic zones KC2/F2 shown by dotted lines, values taken from literature.1
15
By juxtaposing in situ neutron methods with CTS and DSC, underpinned by computational models, it has been shown how complexities occurring during the setting of GIC dental composites can be unravelled structurally, energetically and dynamically. The unexpected non-linear/non-monotonic setting reveals repeated toughness episodes where atomic cohesion is reduced, with evidence of the circumstances promoting micro-cracking at the glass-matrix interface. Toughness has been monitored non-destructively in situ, during GIC setting and the source of evolving brittleness uncovered.
It is believed that this battery of techniques will also offer advantages for studying mechanical toughness in other types of cement non-destructively during setting. It is envisioned that chemical or physical termination of cementation at an early stage (i.e.
pre-24 hours) may allow for retention of the composites fracture toughness intrinsic to its gel-phase. With elevated fracture toughness GICs may be subjected to extended applications including load-bearing applications.
It is expected that the insight afforded by these in situ non-destructive techniques will assist in improving the performance and rational design of cementitious materials generally by quantifying the incipient atomistic processes during setting that dictate long-term mechanical toughness.
16
6 References
1. Prosser HJ, Wilson AD. (1979) Litho-ionomer cements and their technological applications. J Chem Technol Biotechnol, 29: 69-87.
2. Wilson AD. (1996) Secondary reactions in glass-ionomer cements. J Mater Sci Lett, 15: 275-276.
3. Wilson AD, Prosser HJ, Powis DM. (1983) Mechanism of adhesion of polyelectrolyte cements to hydroxyapatite. J Dent Res, 62: 590-592.
4. Hill RG, Wilson AD, Warrens CP. (1989) The influence of poly(acylic acid) molecular weight on the fracture toughness of glass-ionomer cements. J Mater Sci, 24:
363-371.
5. Tian KV, Nagy PM, Chass GA, Fejerdy P, Nicholson JW, Csizmadia IG, Dobó- Nagy C. (2012) Qualitative assessment of microstructure and Hertzian indentation failure in biocompatible glass ionomer cements. J Mater Sci Mater Med, 23: 677-685.
6. Zainuddin N, Karpukhina N, Hill RG, Law RV. (2009) A long-term study on the setting reaction of glass ionomer cements by 27Al MAS-NMR spectroscopy. Dent Mater, 25: 290-295.
7. Matsuya S, Maeda T, Ohta M. (1996) IR and NMR analysis of hardening and materuration of glass-ionomer cement. J Dent Res, 75: 1920-1927.
8. Ritchie RO. (2011) The conflict between strength and toughness. Nature Mater, 10:
817-822.
9. BIO Intelligence Service (2012), Study on the potential for reducing mercury pollution from dental amalgam and batteries, Final report prepared for the European Commission - DG ENV.
10. Sears VF. (1992) Neutron scattering lengths and cross sections. Neutron News, 3:
26-37.
11. Mayers J, Abdul-Redah T. (2004) The measurement of anomalous neutron inelastic cross-sections at electronvolt energy transfers. J Phys Condens Matter, 16:
4811-4832.
12. Andreani C, Colognesi D, Mayers J, Reiter GF, Senesi R. (2005) Measurement of momentum distribution of light atoms and molecules in condensed matter systems using inelastic neutron scattering. Adv Phys, 54: 377-469.
13. Bowron DT, Soper AK, Jones K, Ansell S, Birch S, Norris J, Perrott L, Riedel D, Rhodes NJ, Wakefield SR, Botti, A, Ricci MA, Grazzi F, Zoppi M. (2010) NIMROD:
the near and intermediate range order diffractometer of the ISIS second target station.
Rev Sci Instru, 81: 033905.
14. McIntosh AI, Yang B, Goldup SM, Watkinson M, Donnan RS. (2012) Terahertz spectroscopy: a powerful new tool for the chemical sciences? Chem Soc Rev, 41:
2072-2082.
15. Simons S. Introduction to the principles of quantum mechanics. Logos Press Limited, London, 1968: 1-30.
16. Engel T, Reid P. Physical chemistry. Pearson, Benjamin Cummings, San- Francisco, 2005: 614-615.
17. Frisch MJ, Trucks GW, Schlegel HB, Scuseria GE, Robb MA, Cheeseman JR, Scalmani G, Barone V, Mennucci B, Petersson GA, Nakatsuji H, Caricato M., Li X, Hratchian HP, Izmaylov AF, Bloino J, Zheng G, Sonnenberg JL, Hada M., Ehara M,
17
Toyota K, Fukuda R, Hasegawa J, Ishida M, Nakajima T, Honda Y, Kitao O, Nakai H, Vreven T, Montgomery JA Jr, Peralta JE, Ogliaro F, Bearpark M., Heyd JJ, Brothers E, Kudin KN, Staroverov VN, Kobayashi R, Normand J, Raghavachari K, Rendell A, Burant JC, Iyengar SS, Tomasi J, Cossi M, Rega N, Millam NJ, Klene M, Knox JE, Cross JB, Bakken V, Adamo C, Jaramillo J, Gomperts R, Stratmann RE, Yazyev O, Austin AJ, Cammi R, Pomelli C, Ochterski JW, Martin RL, Morokuma K, Zakrzewski VG, Voth GA, Salvador P, Dannenberg JJ, Dapprich S, Daniels AD, Farkas Ö, Foresman JB, Ortiz JV, Cioslowski J, Fox DJ. Gaussian 09, Revision A.01, Gaussian, Inc., Wallingford CT, 2009.
18. Becke AD. (1993) Density-functional thermochemistry. III. The role of exact exchange. J Chem Phys, 98: 5648-5652.
19. Wolinski K, Hinton JF, Pulay P. (1990) Efficient implementation of the Gauge- Independent Atomic Orbital method for NMR chemical shift calculations. J Am Chem Soc, 112: 8251-8260.
20. Goldman M. (1985) Fracture properties of composite and glass ionomer dental restorative materials. J Biomed Mater Res, 19: 771-783.
21. Greaves GN, Greer AL, Lakes RS, Rouxel T. (2011) Poisson’s ratio and modern materials. Nature Mater, 10: 823-837.
22. Wilson AD, Crisp S, Paddon JM. (1981) The hydration of a glass-ionomer (ASPA) cement. Brit Polym J, 13: 66-70.
18 7
List of Publications
The candidate’s publications related to the content of this dissertation:
1. Tian KV, Nagy PM, Chass GA, Fejerdy P, Nicholson JW, Csizmadia IG, Dobó- Nagy C. (2012) Qualitative assessment of microstructure and Hertzian indentation failure in biocompatible glass ionomer cements. J Mater Sci Mater Med, 23: 677-685
.
[IF = 2.141]
2. Davies RA, Ardalan S, Mu WH, Tian K, Farsaikiya F, Darvell BW, Chass GA.
(2010) Geometric, electronic and elastic properties of dental silver amalgam γ- (Ag3Sn), γ1-(Ag2Hg3), γ2-(Sn8Hg) phases, comparison of experiment and theory.
Intermetallics, 18: 756-760. [IF = 2.327]
The candidate’s other publications :
1. Tian K, Darvell BW. (2010) Determination of flexural modulus of elasticity of orthodontic archwires. Dent Mater, 26: 821-829. [IF = 2.920]