Increased prefrontal cortex connectivity
during cognitive challenge assessed by fNIRS imaging
F
RIGYESS
AMUELR
ACZ,
1,2P
ETERM
UKLI,
1,2Z
OLTANN
AGY,
1ANDA
NDRASE
KE1,2,*1Institute of Clinical Experimental Research, Semmelweis University, 37-43 Tűzoltó Street, Budapest 1094, Hungary
2Department of Physiology, 37-43 Tűzoltó Street, Budapest 1094, Hungary
*eke.andras@med.semmelweis-univ.hu
Abstract: In this study, functional near-infrared spectroscopy (fNIRS) and the graph theory approach were used to access the functional connectivity (FC) of the prefrontal cortex (PFC) in a resting state and during increased mental workload. For this very purpose, a pattern recognition-based test was developed, which elicited a strong response throughout the PFC during the test condition. FC parameters obtained during stimulation were found increased compared to those in a resting state after correlation based signal improvement (CBSI), which can attenuate those components of fNIRS signals which are unrelated to neural activity. These results indicate that the cognitive challenge increased the FC in the PFC and suggests a great potential in investigating FC in various cognitive states.
© 2017 Optical Society of America
OCIS codes: (170.2655) Functional monitoring and imaging; (170.5380) Physiology; (170.3880) Medical and biological imaging.
References and links
1. D. Attwell and C. Iadecola, “The neural basis of functional brain imaging signals,” Trends Neurosci. 25(12), 621–625 (2002).
2. M. D. Fox and M. E. Raichle, “Spontaneous fluctuations in brain activity observed with functional magnetic resonance imaging,” Nat. Rev. Neurosci. 8(9), 700–711 (2007).
3. M. Ferrari and V. Quaresima, “A brief review on the history of human functional near-infrared spectroscopy (fNIRS) development and fields of application,” Neuroimage 63(2), 921–935 (2012).
4. A. Maki, Y. Yamashita, Y. Ito, E. Watanabe, Y. Mayanagi, and H. Koizumi, “Spatial and temporal analysis of human motor activity using noninvasive NIR topography,” Med. Phys. 22(12), 1997–2005 (1995).
5. D. A. Boas, T. Gaudette, G. Strangman, X. Cheng, J. J. Marota, and J. B. Mandeville, “The accuracy of near infrared spectroscopy and imaging during focal changes in cerebral hemodynamics,” Neuroimage 13(1), 76–90 (2001).
6. H. Obrig and A. Villringer, “Beyond the visible--imaging the human brain with light,” J. Cereb. Blood Flow Metab. 23(1), 1–18 (2003).
7. G. Taga, K. Asakawa, A. Maki, Y. Konishi, and H. Koizumi, “Brain imaging in awake infants by near-infrared optical topography,” Proc. Natl. Acad. Sci. U.S.A. 100(19), 10722–10727 (2003).
8. A. C. Dieler, S. V. Tupak, and A. J. Fallgatter, “Functional near-infrared spectroscopy for the assessment of speech related tasks,” Brain Lang. 121(2), 90–109 (2012).
9. S. Basso Moro, S. Bisconti, M. Muthalib, M. Spezialetti, S. Cutini, M. Ferrari, G. Placidi, and V. Quaresima, “A semi-immersive virtual reality incremental swing balance task activates prefrontal cortex: a functional near- infrared spectroscopy study,” Neuroimage 85(Pt 1), 451–460 (2014).
10. F. Tian, B. Chance, and H. Liu, “Investigation of the prefrontal cortex in response to duration-variable anagram tasks using functional near-infrared spectroscopy,” J. Biomed. Opt. 14(5), 054016 (2009).
11. C. Herff, D. Heger, O. Fortmann, J. Hennrich, F. Putze, and T. Schultz, “Mental workload during n-back task- quantified in the prefrontal cortex using fNIRS,” Front. Hum. Neurosci. 7, 7935 (2013).
12. Y. Hoshi, “Functional near-infrared optical imaging: utility and limitations in human brain mapping,”
Psychophysiology 40(4), 511–520 (2003).
13. M. Izzetoglu, S. Nioka, B. Chance, and B. Onaral, “Single trial hemodynamic response estimation in a block anagram solution study using fNIR spectroscopy,” 2005 Ieee International Conference on Acoustics, Speech, and Signal Processing, 1–5 633–636 (2005).
#291147
Journal © 2017 https://doi.org/10.1364/BOE.8.003842
Received 21 Mar 2017; revised 5 May 2017; accepted 30 May 2017; published 25 Jul 2017
14. I. Tachtsidis, T. S. Leung, M. . Tisdall, P. Devendra, M. Smith, D. T. Delpy, and C. E. Elwell, “Investigation of frontal cortex, motor cortex and systemic haemodynamic changes during anagram solving,” Adv. Exp. Med.
Biol. 614, 21–28 (2008).
15. A. Villringer and B. Chance, “Non-invasive optical spectroscopy and imaging of human brain function,” Trends Neurosci. 20(10), 435–442 (1997).
16. Q. Luo, S. Zeng, B. Chance, S. Nioka, and V. V. Tuchin, Handbook of Optical Biomedical Diagnostics, Second Edition (SPIE Press, 2002), Chap. 8.
17. E. Bullmore and O. Sporns, “Complex brain networks: graph theoretical analysis of structural and functional systems,” Nat. Rev. Neurosci. 10(3), 186–198 (2009).
18. O. Sporns, “The human connectome: a complex network,” Ann. N. Y. Acad. Sci. 1224(1), 109–125 (2011).
19. M. D. Greicius, B. Krasnow, A. L. Reiss, and V. Menon, “Functional connectivity in the resting brain: a network analysis of the default mode hypothesis,” Proc. Natl. Acad. Sci. U.S.A. 100(1), 253–258 (2003).
20. K. J. Friston, C. D. Frith, P. F. Liddle, and R. S. Frackowiak, “Functional connectivity: the principal-component analysis of large (PET) data sets,” J. Cereb. Blood Flow Metab. 13(1), 5–14 (1993).
21. B. Biswal, F. Z. Yetkin, V. M. Haughton, and J. S. Hyde, “Functional connectivity in the motor cortex of resting human brain using echo-planar MRI,” Magn. Reson. Med. 34(4), 537–541 (1995).
22. S. L. Novi, R. B. Rodrigues, and R. C. Mesquita, “Resting state connectivity patterns with near-infrared spectroscopy data of the whole head,” Biomed. Opt. Express 7(7), 2524–2537 (2016).
23. H. Niu and Y. He, “Resting-state functional brain connectivity: lessons from functional near-infrared spectroscopy,” Neuroscientist 20(2), 173–188 (2014).
24. C. C. Chuang and C. W. Sun, “Gender-related effects of prefrontal cortex connectivity: a resting-state functional optical tomography study,” Biomed. Opt. Express 5(8), 2503–2516 (2014).
25. L. Duan, Y. J. Zhang, and C. Z. Zhu, “Quantitative comparison of resting-state functional connectivity derived from fNIRS and fMRI: a simultaneous recording study,” Neuroimage 60(4), 2008–2018 (2012).
26. R. C. Mesquita, M. A. Franceschini, and D. A. Boas, “Resting state functional connectivity of the whole head with near-infrared spectroscopy,” Biomed. Opt. Express 1(1), 324–336 (2010).
27. J. Li and L. Qiu, “Temporal correlation of spontaneous hemodynamic activity in language areas measured with functional near-infrared spectroscopy,” Biomed. Opt. Express 5(2), 587–595 (2014).
28. S. Sasai, F. Homae, H. Watanabe, A. T. Sasaki, H. C. Tanabe, N. Sadato, and G. Taga, “A NIRS-fMRI study of resting state network,” Neuroimage 63(1), 179–193 (2012).
29. C. S. Silva, M. K. Hazrati, A. Keil, and J. C. Principe, “Quantification of neural functional connectivity during an active avoidance task,” Conf. Proc. IEEE Eng. Med. Biol. Soc. 2016, 708–711 (2016).
30. E. S. Dørum, T. Kaufmann, D. Alnæs, O. A. Andreassen, G. Richard, K. K. Kolskår, J. E. Nordvik, and L. T.
Westlye, “Increased sensitivity to age-related differences in brain functional connectivity during continuous multiple object tracking compared to resting-state,” Neuroimage 148, 364–372 (2017).
31. L. Kocsis, P. Herman, and A. Eke, “The modified Beer-Lambert law revisited,” Phys. Med. Biol. 51(5), N91–
N98 (2006).
32. M. Cope, D. T. Delpy, E. O. Reynolds, S. Wray, J. Wyatt, and P. van der Zee, “Methods of quantitating cerebral near infrared spectroscopy data,” Adv. Exp. Med. Biol. 222, 183–189 (1988).
33. B. Chance, S. Nioka, and Z. Zhao, “A wearable brain imager,” IEEE Eng. Med. Biol. Mag. 26(4), 30–37 (2007).
34. X. Cui, S. Bray, and A. L. Reiss, “Functional near infrared spectroscopy (NIRS) signal improvement based on negative correlation between oxygenated and deoxygenated hemoglobin dynamics,” Neuroimage 49(4), 3039–
3046 (2010).
35. R. B. Buxton, E. C. Wong, and L. R. Frank, “Dynamics of blood flow and oxygenation changes during brain activation: the balloon model,” Magn. Reson. Med. 39(6), 855–864 (1998).
36. T. Mildner, D. G. Norris, C. Schwarzbauer, and C. J. Wiggins, “A qualitative test of the balloon model for BOLD-based MR signal changes at 3T,” Magn. Reson. Med. 46(5), 891–899 (2001).
37. F. Scholkmann, S. Kleiser, A. J. Metz, R. Zimmermann, J. Mata Pavia, U. Wolf, and M. Wolf, “A review on continuous wave functional near-infrared spectroscopy and imaging instrumentation and methodology,”
Neuroimage 85(Pt 1), 6–27 (2014).
38. M. Rubinov and O. Sporns, “Complex network measures of brain connectivity: uses and interpretations,”
Neuroimage 52(3), 1059–1069 (2010).
39. D. J. Watts and S. H. Strogatz, “Collective dynamics of ‘small-world’ networks,” Nature 393(6684), 440–442 (1998).
40. V. Latora and M. Marchiori, “Efficient behavior of small-world networks,” Phys. Rev. Lett. 87(19), 198701 (2001).
41. A. K. Barbey, M. Koenigs, and J. Grafman, “Dorsolateral prefrontal contributions to human working memory,”
Cortex 49(5), 1195–1205 (2013).
42. G. E. Dawson and K. W. Fischer, Human behavior and the developing brain. (Guilford Press, New York, 1994).
43. A. Baddeley, “Working memory,” Science 255(5044), 556–559 (1992).
44. M. A. Goodale and A. D. Milner, “Separate visual pathways for perception and action,” Trends Neurosci. 15(1), 20–25 (1992).
45. E. R. Kandel, Principles of neural science, 5th ed. (McGraw-Hill, New York, 2013), pp. l, 1709
46. I. Tachtsidis, T. S. Leung, L. Devoto, D. T. Delpy, and C. E. Elwell, “Measurement of frontal lobe functional activation and related systemic effects: a near-infrared spectroscopy investigation,” Adv. Exp. Med. Biol. 614, 397–403 (2008).
47. A. C. Ruocco, A. H. Rodrigo, J. Lam, S. I. Di Domenico, B. Graves, and H. Ayaz, “A problem-solving task specialized for functional neuroimaging: validation of the Scarborough adaptation of the Tower of London (S- TOL) using near-infrared spectroscopy,” Front. Hum. Neurosci. 8, 185 (2014).
48. M. Firbank, E. Okada, and D. T. Delpy, “A theoretical study of the signal contribution of regions of the adult head to near-infrared spectroscopy studies of visual evoked responses,” Neuroimage 8(1), 69–78 (1998).
49. J. Xu, X. Liu, J. Zhang, Z. Li, X. Wang, F. Fang, and H. Niu, “FC-NIRS: A Functional Connectivity Analysis Tool for Near-Infrared Spectroscopy Data,” BioMed Res. Int. 2015, 248724 (2015).
50. R. J. Cooper, J. Selb, L. Gagnon, D. Phillip, H. W. Schytz, H. K. Iversen, M. Ashina, and D. A. Boas, “A systematic comparison of motion artifact correction techniques for functional near-infrared spectroscopy,” Front.
Neurosci. 6, 147 (2012).
51. T. Yamada, S. Umeyama, and K. Matsuda, “Separation of fNIRS signals into functional and systemic components based on differences in hemodynamic modalities,” PLoS One 7(11), e50271 (2012).
52. I. Szirmai, I. Amrein, L. Pálvölgyi, R. Debreczeni, and A. Kamondi, “Correlation between blood flow velocity in the middle cerebral artery and EEG during cognitive effort,” Brain Res. Cogn. Brain Res. 24(1), 33–40 (2005).
53. R. Debreczeni, I. Amrein, A. Kamondi, and I. Szirmai, “Hypocapnia induced by involuntary hyperventilation during mental arithmetic reduces cerebral blood flow velocity,” Tohoku J. Exp. Med. 217(2), 147–154 (2009).
54. F. Scholkmann, U. Gerber, M. Wolf, and U. Wolf, “End-tidal CO2: an important parameter for a correct interpretation in functional brain studies using speech tasks,” Neuroimage 66, 71–79 (2013).
55. T. S. Leung, C. E. Elwell, J. R. Henty, and D. T. Delpy, “Simultaneous measurement of cerebral tissue oxygenation over the adult frontal and motor cortex during rest and functional activation,” Adv. Exp. Med. Biol.
510, 385–389 (2003).
56. I. Tachtsidis and F. Scholkmann, “False positives and false negatives in functional near-infrared spectroscopy:
issues, challenges, and the way forward,” Neurophotonics 3(3), 031405 (2016).
57. C. J. Stam, “Modern network science of neurological disorders,” Nat. Rev. Neurosci. 15(10), 683–695 (2014).
58. Y. Liu, M. Liang, Y. Zhou, Y. He, Y. Hao, M. Song, C. Yu, H. Liu, Z. Liu, and T. Jiang, “Disrupted small-world networks in schizophrenia,” Brain 131(Pt 4), 945–961 (2008).
59. M. Rubinov, S. A. Knock, C. J. Stam, S. Micheloyannis, A. W. Harris, L. M. Williams, and M. Breakspear,
“Small-world properties of nonlinear brain activity in schizophrenia,” Hum. Brain Mapp. 30(2), 403–416 (2009).
60. Y. He, A. Dagher, Z. Chen, A. Charil, A. Zijdenbos, K. Worsley, and A. Evans, “Impaired small-world efficiency in structural cortical networks in multiple sclerosis associated with white matter lesion load,” Brain 132(Pt 12), 3366–3379 (2009).
61. N. Shu, Y. Liu, K. Li, Y. Duan, J. Wang, C. Yu, H. Dong, J. Ye, and Y. He, “Diffusion tensor tractography reveals disrupted topological efficiency in white matter structural networks in multiple sclerosis,” Cereb. Cortex 21(11), 2565–2577 (2011).
62. F. Skidmore, D. Korenkevych, Y. Liu, G. He, E. Bullmore, and P. M. Pardalos, “Connectivity brain networks based on wavelet correlation analysis in Parkinson fMRI data,” Neurosci. Lett. 499(1), 47–51 (2011).
63. F. Agosta, S. Sala, P. Valsasina, A. Meani, E. Canu, G. Magnani, S. F. Cappa, E. Scola, P. Quatto, M. A.
Horsfield, A. Falini, G. Comi, and M. Filippi, “Brain network connectivity assessed using graph theory in frontotemporal dementia,” Neurology 81(2), 134–143 (2013).
64. M. P. van den Heuvel and O. Sporns, “Network hubs in the human brain,” Trends Cogn. Sci. (Regul. Ed.) 17(12), 683–696 (2013).
65. M. Pievani, W. de Haan, T. Wu, W. W. Seeley, and G. B. Frisoni, “Functional network disruption in the degenerative dementias,” Lancet Neurol. 10(9), 829–843 (2011).
66. L. Wang, H. Li, Y. Liang, J. Zhang, X. Li, N. Shu, Y. Y. Wang, and Z. Zhang, “Amnestic mild cognitive impairment: topological reorganization of the default-mode network,” Radiology 268(2), 501–514 (2013).
67. B. M. Tijms, A. M. Wink, W. de Haan, W. M. van der Flier, C. J. Stam, P. Scheltens, and F. Barkhof,
“Alzheimer’s disease: connecting findings from graph theoretical studies of brain networks,” Neurobiol. Aging 34(8), 2023–2036 (2013).
68. X. Delbeuck, M. Van der Linden, and F. Collette, “Alzheimer’s disease as a disconnection syndrome?”
Neuropsychol. Rev. 13(2), 79–92 (2003).
69. A. Gazzaley, J. Rissman, and M. D’Esposito, “Functional connectivity during working memory maintenance,”
Cogn. Affect. Behav. Neurosci. 4(4), 580–599 (2004).
70. J. Rissman, A. Gazzaley, and M. D’Esposito, “Measuring functional connectivity during distinct stages of a cognitive task,” Neuroimage 23(2), 752–763 (2004).
71. M. De Marco, F. Meneghello, D. Duzzi, J. Rigon, C. Pilosio, and A. Venneri, “Cognitive stimulation of the default-mode network modulates functional connectivity in healthy aging,” Brain Res. Bull. 121, 12126–12141 (2015).
1. Introduction
Neural activity elicits a local hemodynamic response through neurovascular coupling, which results in regional blood influx [1]. The latter is associated with changes in oxygenated (HbO)
and deoxygenated (HbR) hemoglobin concentrations that can be detected with continuous wave functional near-infrared spectroscopy (fNIRS). Therefore, by monitoring regional chromophore concentration changes in the brain, neural activity can be investigated.
Functional magnetic resonance imaging (fMRI) – despite of its moderate temporal resolution, high-expense and need for delicate measurement conditions – mainly due to its high spatial resolution became the gold standard in non-invasive functional brain imaging. In contrast, fNIRS is a portable, low-cost method offering excellent temporal and moderate spatial resolution, which makes it an emerging brain imaging technology [2, 3]. Despite the good penetration of near-infrared light, remittance mode fNIRS is suitable to monitor cortical regions only. Nevertheless, fNIRS is a useful tool in a wide array of applications such as bedside monitoring of cerebral oxygenation or in studies characterizing rest-to-task transients in processes involving the brain cortex.
A bulk of earlier studies using fNIRS imaging investigated the neural response to specific stimuli over various regions of the brain [4–9]. Given its easy access and significance in cognitive functions, the prefrontal cortex (PFC) was often the choice for fNIRS measurement.
Among the experimental paradigms are commonly found the n-back or anagram based tasks [10–14] and visual tests, which require intensive concentration and effort [15, 16]. Pattern recognition is also a type of visual tests, in which the procedure requires complex problem solving thus beyond the visual cortex involving the PFC, too. While pattern recognition is not yet a widely used method in PFC studies, its simplicity and no need for verbal communication favors its acceptance.
The fact that the brain is an immensely complex network of spatially distinct but functionally cooperating subunits was recognized in the past decades. Accordingly, graph theory and connectivity became leading concepts in neuroscience to reveal its network properties [17–19]. The tenet underlying this advance of the graph theory approach is that in various network metrics, it offers a quantitative description of the complex, holistic qualities of functional brain organization. Since the pioneering work of Friston et al. [20] and Biswal et al. [21], functional connectivity between regions of the brain can be captured as the temporal correlation of pair-wisely recorded fluctuating neurophysiological events, or in between the hemodynamic fluctuations they elicit.
Despite of the wide-spread use of fMRI-BOLD in investigating functional connectivity, a number of recent studies demonstrated that fNIRS can be considered as one of its reasonable alternatives in this capacity [22–28]. The fNIRS technique - due to its high temporal resolution - appears as an adequate choice to assess not only resting state functional connectivity, but also to map changes in these networks related to task; the latter which has been recently receiving increasing attention [29, 30].
For this very purpose, we developed a new approach based on fNIRS imaging, pattern recognition and graph theory to study complex problem solving as manifested in the prefrontal cortex (PFC). We hypothesized, that functional connectivity associated with cognitive stimulation differs from those in resting state. Therefore, we compared graph theory-based connectivity metrics obtained in the resting state to those during pattern recognition task to determine if network metrics were significantly elevated during cognitive stimulation than at rest, which would indicate that the increased mental workload required denser intraregional functional connectivity in the prefrontal cortex.
2. Materials and methods 2.1 Participants
For this study, fifteen young, healthy adults (8 female) with no reported history of neurological diseases were recruited. The average age was 23 ± 2 years. The subjects were split into control (n = 8) and test (n = 7) groups. Three of them were later excluded from further analysis due to poor probe contact or signal quality, resulting in a final number of 6-6 subjects in the two groups (3-3 female). The study was approved by the Semmelweis
University Regional and Institutional Committee of Science and Research Ethics. All participants provided written informed consent.
2.2 Experimental protocol
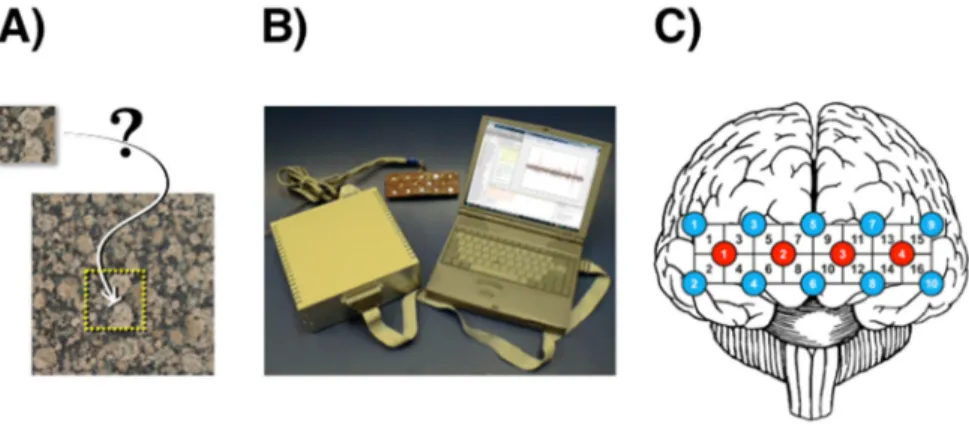
During the experiment, subjects were seated in a dark room in a comfortable armchair facing a computer display and were instructed to stay still. Subjects in the control group (i.e. resting state) were gazing at a blank grey screen for thirty minutes. Experiments in the test group started with three minutes of resting-state measurement to acquire baseline activity, and then the subjects performed the pattern recognition test requiring identifying a small piece of a larger random-pattern image (Fig. 1(A)). Task presentation (‘trial’) lasted 10 seconds, during which the subjects were asked to put maximal effort into solving the task. To avoid habituation, a set of very different visual patterns was used taken from a wide array of natural phenomena. Trials were followed by 30 second inter-trial intervals, during which subjects were shown a blank grey screen and were asked to relax. This design yielding a 40 second long ‘stimulation block’ allowed for the functional hyperemia to complete with a return to baseline level. To acquire an adequate signal-to-noise ratio (SNR), each subject had to perform the task eighteen times. This number of stimulation blocks was determined by numerical simulation, where signals representing the expected response were mixed with resting state fNIRS data, and then regained through averaging over different number of repetitions. The minimum number of stimulation blocks needed to recover the embedded response turned out to be 18.
2.3 Experimental setup
In this study, measurements were performed by a continuous-wave fNIRS system designed by Prof. Britton Chance (NIM Inc., University of Pennsylvania, USA). The system consisted of 4 LED diodes emitting light at three different wavelengths (730, 805 and 850 nm [31]) and 10 photodiodes, all arranged in an imaging roster with 8 x 2 = 16 channels in total (Fig. 1(B)).
The probe was kept on the forehead by Velcro, covering approximately the anterior PFC, as well as parts of the dorsolateral and ventrolateral PFC (Fig. 1(C)). The source-detector distance for each channel was 2.5 cm, providing an approximate 1.25 cm penetration depth, and the sampling frequency was set to 3 Hz. Concentration changes of HbO and HbR were obtained, according to the modified Beer-Lambert law [31, 32]. Total hemoglobin (HbT) was calculated as the sum of HbO and HbR. Detailed specifications and testing of this instrument can be found elsewhere [33].
Fig. 1. Concept and experimental design. The cognitive task consists of locating a subset within a larger visual pattern (A). View of the 16-channel fNIRS imaging setup with optode in the middle, control box on the left, and laptop computer on the right (B). Position of the 16- channel fNIRS optode over the frontal lobe with red and blue circles indicating light sources and detectors respectively (C).
2.4 Data preprocessing
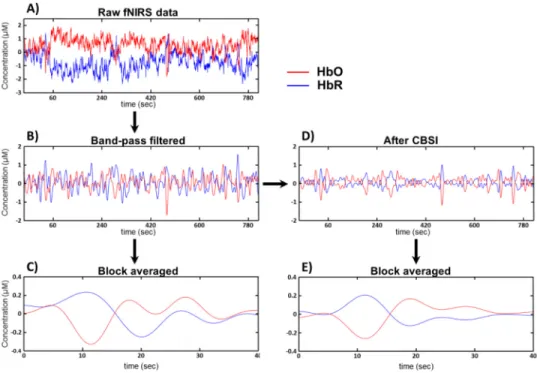
Systemic spontaneous oscillations, such as heart pulsation were decomposed by a continuous wavelet transformation performed on the raw data with the fourth derivative of the Gaussian function. If these oscillations could be seen clearly across all channels, the contact of the probe to the forehead was regarded firm, assuming the proper detection of the reflected light from the PFC. Subjects with asynchronous oscillations were excluded from further analysis due to poor probe contact [10]. The remaining raw time courses (Fig. 2(A)) were band-pass filtered between 0.02 and 0.4 Hz [10] to remove long-term baseline drifts and high frequency cardiac pulsations (Fig. 2(B)). Furthermore, for the connectivity analysis, correlation based signal improvement (CBSI) [34] was applied to the HbO and HbR time series (Fig. 2(D)).
While some hemodynamic effects (i.e. motion artefacts, venous outflow perturbed by coughing, etc.) are positively correlated as they change both HbO and HbR concentrations in the same direction, hemodynamic response induced by neuronal activity affects the HbO and HbR compartments in an anticorrelated way, as predicted by the so called Balloon model and also demonstrated on experimental data [34–36]. On this ground, CBSI can enhance the representation of neural activity in the fNIRS signal by suppressing maximally correlated changes in HbO and HbR in the registered hemodynamic fluctuations as being unrelated to neuronal activity [37].
Fig. 2. fNIRS data preprocessing. Raw HbO and HbR time series (A) were bandpass filtered with cutoff frequencies 0.02 and 0.4 (B), then averaged over the stimulation blocks to increase signal-to-noise ratio (C). For the connectivity analysis, CBSI was performed on the band-pass filtered data first (D), and then the acquired data was averaged over the stimulation blocks (E).
2.5 Data analysis
To reduce the disturbance of physiological oscillations, thus increase signal-to-noise ratio, data averaging was done along the stimulation blocks for each individual subjects, while for the control subjects 18 randomly selected data sets with a length of 40 seconds were selected and averaged (Fig. 2(C, E)). Then group level analyses were performed to (i) describe the hemodynamic response evoked by the pattern recognition task, (ii) to assess the effect of
altered neuronal activity on the correlation of the HbO and HbR compartments (rHb), and (iii) to investigate the differences in functional connectivity measures between the two states.
For each subject, HbO and HbR data sets were grand averaged across channels and time points, and significantly different values from the baseline were identified. For spatial characterization, the maximum amplitude defined as the difference between the minimal and maximal relative HbO concentrations in each channels were mapped [10].
A sliding window correlation analysis [34] of the HbO and HbR signals were performed with a window length of 6 seconds on all channels. The Pearson correlation coefficient of the HbO and HbR data in all given windows were calculated, yielding a 34 second long data set of cross correlation coefficients (rHb) for each channel, where also time points with significantly different rHb values from the baseline were identified after grand averaging.
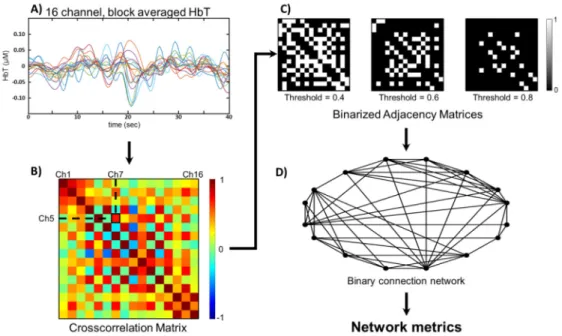
Network analysis were performed on HbT time series [22, 26], both before and after CBSI treatment of the signals (Fig. 3(A)). The strength of functional connection between pairs of brain regions were characterized in terms of temporal correlation of regional hemodynamics.
Thus symmetric correlation matrices were obtained from the Pearson correlation coefficients of all pairwise combinations of the channels, for each subject (Fig. 3(B)). The rows and columns of these matrices represent the channels, while cells of the matrix contain the correlation coefficient of the corresponding channels. Weak and non-significant links can represent spurious connections, so they should be discarded by weight thresholding [38]. This way, only coefficients greater or equal to the chosen threshold value are kept as connections to consider with a value of 1 assigned. Otherwise the coefficient is replaced with a 0, thus creating a binary adjacency matrix. To avoid the arbitrary determination of the threshold value, all networks were characterized across a range from 0.05 to 0.85, with increments of 0.05, and graph theory parameters were analyzed as the function of threshold (Fig. 3(C)).
According to matrix representation of graphs, each matrix exactly defines a binary, undirected graph (Fig. 3(D)).
Fig. 3. Constructing a binary functional connection network from fNIRS-data. 16 channel total hemoglobin (HbT) time series - before and after CBSI (not shown) as well - were token as the sum of HbO and HbR data (A). Pearson correlation coefficients were calculated for all pairwise combination of channels, resulting in a symmetrical crosscorrelation matrix (B).
Binary adjacency matrices were obtained by weight-thresholding along 17 different threshold values (C). Network metrics density, clustering coefficient and efficiency were calculated on the functional connection networks described by the adjacency matrices (D).
For the characterization of networks, the most commonly used global network metrics were calculated: the connection density (D), the global clustering coefficient (C) and the global efficiency (E). The connection density of a network is the fraction of the existing edges to all possible edges, and it calculates as
(
1)
2 1 i n j n ij
D a
n n ∈ ∈
= −
(1)where n is the number of nodes in the network, and aij equals 1 if there is a link between nodes i and j, 0 otherwise. Density mainly refers to the overall ’wiring cost’ of the given network. For an individual node, the clustering coefficient defines the fraction of its neighbors which are also neighbors of each other [39], or in other terms the number of triangles around the given node [38]. The global/mean clustering coefficient therefore can be calculated as
( )
,1 1
1 ij ih jh
i N i i j h n
C a a a
n∈ k k ∈
=
−
(2)where ki is the degree of node i, hence C reflects, how the neighboring nodes in the network form connected groups. Another important measure of network structure is the average shortest path length [39]. The efficiency is the average inverse shortest path length between all pairs of nodes [40], which is primarily influenced by short paths, thus much more efficient in describing smaller networks [38]. Global efficiency can be calculated by the equation
1
,
1
1
ij i n j n i j
E d
n n
−
∈ ∈ ≠
=
− (3)where dij is the shortest path between nodes i and j. Efficiency describe the effectiveness of information transfer between distinct nodes of the given network, thus can reflect the quality of communication and information processing in the network.
Data preprocessing and data analysis were performed with MATLAB 2012a (Mathworks, Inc., Natick, MA). Functions for calculating the graph theory metrics were obtained from the Brain Connectivity Toolbox [36]. Statistics were performed with StatSoft Statistica 13.2 with differences considered significant in case of p<0.05.
3. Results
3.1 Hemodynamic response
For each group, average of the HbO and HbR data were taken channel-wise to analyze the overall response of the prefrontal cortex. Repeated measures ANOVA tests were performed to identify if there were any time, when the HbO and HbR concentrations differed significantly from the baseline level, with Dunnett post-hoc tests performed to identify the precise moments. A decrease in HbO concentration and increase in the HbR concentration appeared in the test subjects shortly after the onset of the task, while neither the HbO or HbR levels differed significantly from the baseline in the control group (Fig. 4(A, B)). In fact, the observed changes in the test group suggest a neural deactivation response in the presumably stimulated regions [10]. The rHb time series were analyzed in the same fashion as the HbO and HbR data, and showed a significant decrease from the baseline (with a tendency towards
−1) in a time period approximately coincident with HbO and HbR changes, while no significant change occurred in resting state (Fig. 4(A, B)). The implication is that local neural activity altered in response to the cognitive challenge as the changes in HbO and HbR concentrations became more anticorrelated. On the topographical maps of the maximal HbO amplitudes (Fig. 4(C, D)), large-amplitude perturbations in HbO are seen in contrast with the small-amplitude random fluctuations across the PFC found in resting state)). The most affected areas during cognitive stimulation include the lateral areas of the PFC (channels 1,
14 and 16), although a clearly visible and equally strong response also appeared in the central regions (channels 6 and 8).
Fig. 4. The grand-averaged temporal profiles of ΔHbR (blue curves), ΔHbO (red curves) and rHb (black curves) time series with the topographic projection of the maximal HbO amplitudes. Resting state data shows only random fluctuations with no significant deviation from baseline (A). On the other hand, an increase in HbR, and decrease in HbO and rHb can be seen during and after task performing (indicated by the grey area) with * symbols marking significant difference from the baseline. Topographical projection of the maximal HbO amplitudes shows only small-amplitude random fluctuation in resting-state (C), while it shows increased activity throughout the whole PFC with maximal amplitude in the lateral and central regions (D).
3.2 Graph theory analysis
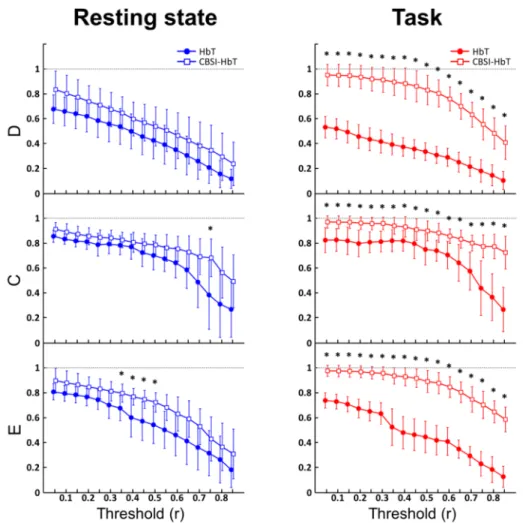
Graph theory metrics were calculated on HbT signals at 17 different threshold values, describing the behavior of the parameters as a function of threshold. The results for each threshold value were treated individually as independent cases, and two sample t-tests or Mann-Whitney U-tests (depending on the normality of the data) were performed to distinguish the two states. Power analysis was performed to justify sample size. Statistical power exceeded 0.9 in 71%, while 0.6 in 93% of all cases. As expected and reported in previous studies [20], there was an inverse relationship between the parameters and the threshold: an increase in the threshold decreased the number of existing edges in the network.
Interestingly, D was significantly higher in the resting state for 4 threshold values, but was seen only under a threshold of 0.2, which could be the result of persisting ’connection noise’
in the lower coefficients caused by false connections. Apart from this, the two conditions did not differ significantly in any of the variables (Fig. 5, left).
Based on the hypothesis that removing fluctuation events unrelated to neuronal activity should improve the performance of functional connectivity metrics, we performed correlation based signal improvement on the HbO and HbR time series, and repeated the analysis on the resulting CBSI-HbT signals obtained as the sum of CBSI-HbO and CBSI-HbR. The CBSI
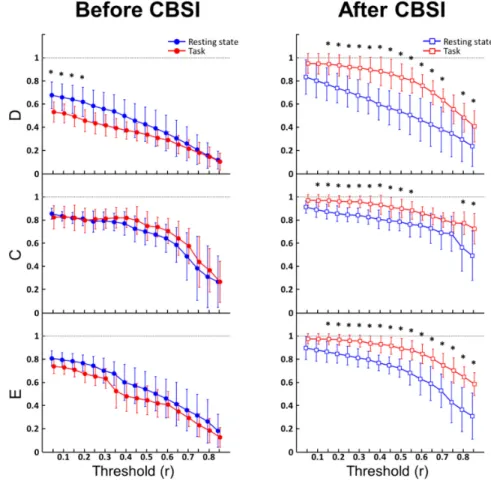
method had marked effect on the network parameters, increasing them in both groups, especially those in the test group (Fig. 5, right). D and E became significantly higher in the test group at almost all thresholds mostly above 0.1. This is in further support of the hypothesis that there was a significant amount of spurious connections in the low correlation range. D was significantly higher in stimulated networks over 0.1 in all cases except for threshold equal to 0.7. Above that, D was still significantly higher in the test group, but the difference was only marginal (p = 0.0411, p = 0.0384), mainly because the networks in both groups became too sparse and thus hard to differentiate in the high threshold range. E kept being higher in the test group from threshold of 0.2 all the way up to 0.85. This implies that the network topology in the two states were still different regarding short connections, even when the differences in node degrees became indistinguishable. C proved to be less sensitive in distinguishing the two conditions, as it only showed significant difference between thresholds of 0.05 and 0.5, and over 0.75, though these differences were also of marginal significance (p = 0.0470, p = 0.0489). C was higher, although insignificantly, in the remaining cases indicating that the clustered connection structure of the network got strengthened. The size of the network (which largely limits the maximum number of possible triangles around an individual node) and the relatively high density – even in resting state – could have contributed to the slightly weaker performance of C.
Fig. 5. Results of density (D), clustering coefficient (C) and efficiency (E) as a function of threshold. Before CBSI was applied (left, circle markers) the only significant differences between the control (blue) and test (red) groups occurred in D between threshold 0.05 and 0.2 (marked by * symbols). Connectivity analysis performed on data after CBSI (right, square markers) revealed robust increase in D, C and E due to cognitive stimulation, along most of the threshold values (significant differences marked by * symbols).
3.3 The effect of CBSI
We found that the CBSI method greatly improved the sensitivity of the connectivity analysis.
To quantify this effect, we investigated the influence of CBSI on the network parameters both on resting-state and stimulation data. We compared the network parameters calculated before and after CBSI was performed for both states with similar statistical methods as described before. Statistical power exceeded 0.9 in 90%, while 0.6 in 96% of all cases. Although CBSI slightly increased D in the resting state (Fig. 6, left), this effect was not significant at neither threshold. However, CBSI had a very prominent effect on D calculated on test data, as it markedly increased the values of D excessively for all threshold values. This effect on C is slightly less prominent, as C increased in resting state at threshold of 0.7, and did so on stimulation data for all threshold values except that of 0.4. As for stimulation data (Fig. 6, right), CBSI had the same effect on E dramatically increasing it for all threshold values. In resting state, the CBSI method was able to increase E between threshold 0.3 and 0.5.
Fig. 6. The effect of CBSI. The effect of CBSI was marginal on resting-state data (left, blue lines), significantly increasing C and E for only a few threshold values (marked by * symbols).
The method had an extensive effect on data registered during task performing (right, red curves), as it increased D, C and E significantly in every case (marked by * symbols)
4. Discussion
In this study, we investigated the effect of cognitive stimulation on functional connectivity in the prefrontal cortex. For this purpose, we developed a simple but effective visual cognitive
test that affected wide areas of PFC. These areas corresponded mainly to Brodmann area 46 with functions including working memory and maintenance of attention [41]. Damage of this region impairs the ability of comparing two visual items recalled from short-time memory [42], which was the main challenge in our pattern recognition test, i.e. finding a part of an image within the whole. The anterior PFC sampled by the central optode channels mainly corresponds to Brodmann area 10. The exact functions of this region are still not fully understood. Baddeley’s model of working memory [43] suggests its involvement in synchronizing engagements in multiple tasks or subtasks. The involvement of central regions implicates that the pattern recognition test indeed required complex problem solving and synchronization of multiple cognitive functions as they emerge from lower-level processing along the dorsal and ventral visual pathways dealing with the „where?” and „what?” aspects of the observed object, respectively [44, 45]. Interestingly, in this study instead of the activation response expectable for the aforementioned PFC areas, we observed deactivation.
Previous studies using the same anagram solving tests found both activation as reported by Tachtsidis et al. [46] and deactivation of the PFC as shown by Tian et al. [10], employing an interoptode distance (IoD) of 4 and 2.5 cm, respectively. Prefrontal cortex deactivation was also shown by Ruocco et al. [47] during complex problem solving at an IoD of 2.5 cm. It is the differing interoptode distances, which could offer an explanation for the opposite effects, since a device with a smaller IoD samples more superficial layers of the brain cortex: as demonstrated by Firbank et al. [48] over the occipital region of the human head, a 2 cm interoptode distance can be regarded the smallest at which the superficial layer of the brain cortex can be reached, while at 4 cm both superficial and deeper layers do contribute to the fNIRS signal. The 2.5 cm IoD was deliberately chosen as a design principle of the fNIRS instrument used in this study to achieve a needed spatial resolution of 16 channels for the human forehead with the acceptable compromise of a shallower penetration depth thus over representing the contribution of superficial layers of the cortex in the fNIRS signal. Although this question requires a more in depth investigation, it is presumable, that the observed superficial deactivation signal is in fact concomitant with the activation of deeper layers within a given region. Nevertheless, it should be noted that the nature of this device/layer- specific cognitive response does not invalidate our observations on increased connectivity as the network analyses applied depend only on temporal coincidence in the fluctuating fNIRS signals, not on their functional character (i.e. deactivation vs. activation).
When the functional connection networks in the PFC were reconstructed from only bandpass-filtered fNIRS signals, in most of the cases connectivity parameters did not show significant difference between the two experimental conditions. Moreover the results showed a tendency of the resting-state network density and inverse shortest path length being even higher. However when the component unrelated to neural activity was removed from the bandpass-filtered signal by CBSI, an increase of PFC network connectivity was robustly demonstrated in response to the cognitive challenge. This implies that increased mental workload is associated with significantly higher network metrics, however, several other important aspects of increased cognitive load must be considered.
Originally, correlation based signal improvement was introduced by Cui et al. [34] to eliminate motion artifacts remaining in the signal after basic filtering, and still this remains the main application of the method [49, 50]. A different approach with a very similar purpose presented by Yamada et al. [51] aims at a direct separation of the fNIRS signal into its functional and systemic components. This approach along with CBSI are mentioned by Scholkmann et al. [37] as methods simultaneously reducing motion artifacts as well as separating the ’functional’ part of the signal from the systemic component. In our study – where head movement was minimized –, CBSI proved even more effective in eliminating hemodynamic components with a correlating impact on HbO and HbR signals. However, it has been shown that various means of cognitive stimulation, such as mental arithmetic [52, 53] or anagram based tests [46], speech tasks [54]– but in fact, even simple motor tasks such
as finger opposition [55]– can elicit not only regional but systemic response as well. These changes in heart rate, mean arterial pressure or partial pressure of CO2, by altering cerebral blood flow, can affect HbO and HbR concentrations in an anticorrelating manner albeit with smaller amplitude [14]. The brief task presentation time, the block average design and the smaller amplitude in aforementioned fluctuations of systemic origin however make it unlikely that the systemic signal component would be dominant in the HbO and HbR responses enhanced by CBSI. The decrease in rHb and the increase in connectivity metrics indicate that the ‘functional’ signal component acquired by CBSI is indeed more closely related to neural activity than the raw band-pass filtered data. Nevertheless, as the relative contribution of true functional and systemic influences of regional HbO and HbR levels is a matter of continuing debate in the fNIRS field [56], excessive caution in the interpretation is called for. Although CBSI is not yet an established component of signal preprocessing in fNIRS studies investigating functional connectivity, our results suggest that it should be considered as a valuable tool of signal enhancement in future fNIRS studies.
The network metrics used in this study were chosen as to reflect upon the three basic aspects of functional network organization [38, 39]: D for the mean node degree, which refers to the overall wiring cost of the network, C for the segregation of the network, which mainly describes the ability of the network to form subunits to facilitate performing parts of the task separately, and E for the integration of the network, which characterizes the overall effectiveness of rapid information transfer between nodes of the network. These three parameters – with larger networks, the average shortest path length, L being used instead of E – are the most commonly used graph theory metrics to describe functional connectivity in the brain. The size of the networks investigated in this study did not allow for a more in-depth analysis of network structure, where parameters such as centrality or modularity could have been assessed as well. Nevertheless the information in the network metrics we obtained could be enhanced by their topological distribution. Accordingly, we concluded that not only the number of interregional connections increased as captured in D, but the test elicited the new connections in such a way that they shortened the connection paths between different regions, while contributing to forming local clusters, too.
The most important and promising perspective of graph theory-based functional connectivity studies – apart from the deeper understanding of brain function – is that they could provide new biomarkers in basic and clinical studies as well. Despite their relatively short past as part of neuroscience, these studies already showed promising results and findings [57]. The most promising fields of interest of connectivity approach are psychiatric disorders [58, 59], neurodegenerative disorders [60, 61] and different types of dementias [62–
64], especially Alzheimer’s Disease [65–67], which is often mentioned in the literature as a
’disconnection syndrome’ as it causes a massive decrease in density and clustering coefficient [68]. These studies proved that functional connectivity parameters can be used as valid biomarkers not just in basic research but in the clinical field as well, although they mostly focused only on resting state functional connectivity. It has also been shown in previous studies, that functional connectivity alters during task performing [29, 30, 69, 70], and that sustaining increased cognitive load can lead to permanent alterations in resting state connectivity [71]. However, no previous study investigated the acute effects of cognitive stimulation in a quantitative manner, using graph theory metrics. The network metrics selected in our study – D, C and E – proved to be sensitive in discriminating states of resting state from that of cognitive stimulation, even in relatively small networks.
5. Conclusions
Our results demonstrated that functional connectivity properties of the prefrontal cortex under cognitive stimulation differ from those of resting-state. Our new, pattern recognition-based test elicited strong response throughout the PFC as captured by fNIRS. Thus it can be a valuable tool of future studies focusing on prefrontal cortex activity. We described functional
connectivity through the most widely used network metrics – density, clustering coefficient and efficiency – to get a basic but comprehensive description of PFC connectivity. These metrics proved to be effective and sensitive even on small networks in distinguishing resting state from increased mental workload, as all three metrics increased during acute cognitive stimulation indicating increased functional connectivity in the PFC. In this study, we also demonstrated that CBSI can be an effective tool in separating components of hemodynamic signals unrelated to neural activity, offering needed means for signal enhancement in fNIRS- based studies investigating dynamics in brain function. As the vast majority of functional connectivity studies focus only on resting-state connectivity or its alterations due to long-time effects, it is essential to emphasize that network metrics are also effective in distinguishing acutely altered mental conditions as well thus providing a new tool and set of biomarkers. Our findings can open new perspectives in – either basic or clinical – connectivity studies, shifting the focus from resting-state connectivity to investigate the change in connection patterns or even network response to cognitive stimulation in different physiological and pathological conditions.
Acknowledgments
The authors sincerely acknowledge the invaluable and generous contribution of Professor Britton Chance (University of Pennsylvania, Philadelphia, USA) by providing the NIRS- LEDI instrument used in this study.