1
ENERGISE ENERGIA ÉLŐ LABOR JELENTÉS - MAGYARORSZÁG
Vadovics Edina és Pap-Szuromi Orsolya GreenDependent Intézet
A jelentés készítésében közreműködtek:
Fülöp Eszter, Király Andrea, Szőllőssy Anita, Vadovics Kristóf, Varga Éva GreenDependent Intézet
2019. június
Hivatkozás:
Vadovics, E. és Pap-Szuromi, O. (2019) ENERGISE Energia Élő Labor jelentés - Magyarország.
ENERGISE , Background study to Deliverable 5.2. GreenDependent Intézet, Magyarország
2
CONTENTS / TARTALOM
ENERGISE ENERGIA ÉLŐ LABOROK MAGYARORSZÁGON ... 4
Összefoglaló ... 4
A résztvevők visszajelzései az Energia Élő Laborokról ... 7
Következtetések és észrevételek ... 9
Summary ... 13
1. ELL description ... 14
1.1 Sociodemographic and Socioeconomic characteristics of the ELL participants ... 14
1.2 reasons for participating and prior experience of energy initiatives ... 15
1.3 Building characteristics of ELL participants ... 17
1.4 Tools and approaches used for ELL1 and ELL2 outreach and communication .... 21
2. Practices before the challenge (from the deliberation phase) ... 24
2.1 Practices related to thermal comfort ... 24
2.2 Practices related to laundry ... 28
3. Practices during and directly after the challenges ... 33
3.1 The challenges ... 33
3.2 Changes in heating practices ... 36
3.3 Changes in laundry practices ... 43
3.4 Potential ruptures and sufficiency potential ... 49
3.4.1 Ruptures ... 49
3.4.2 Sufficiency potential ... 52
4. Practices three months after the Living Lab ... 54
4.1 Persistence of changes in heating practiceS ... 54
4.2 Persistence of changes in laundry practices ... 57
4.3 Potential effects: spillover effects, rebound effects, calculated CO
2and energy savings, potential for scaling up ... 60
4.3.1 Spillover effects ... 60
4.3.2 Rebound effects ... 62
4.3.3 Calculated CO
2and energy savings ... 64
4.3.4 The potential for scaling up ... 67
5. Feedback from participants and implementation team on ELL implementation ... 70
6. Conclusions and reflection ... 72
Acknowledgments... 73
References ... 74
3
Annexes ... 75 Annex 1. A selection of photographs taken during ell implementation ... 75 Annex 2: The EnergyNeighbourhoods methodology used to calculate energy savings ... 86 Annex 3: The methodology used for calculating laundry-related avoided CO
2emissions ... 90
4
ENERGISE ENERGIA ÉLŐ LABOROK MAGYARORSZÁGON ÖSSZEFOGLALÓ
Az ENERGISE Energia Élő Laborok megvalósítása során gyakorlat-alapú módszereket alkalmaztunk a háztartások energiafelhasználásának csökkentésére, miközben közösen ismereteket szereztünk arról, miért is folytatnak a háztartások energia-intenzív gyakorlatokat, illetve miként befolyásolja ezeket a környezet. Az ENERGISE projekt keretében nyolc európai országban összesen 16 Élő Labor valósult meg 2018-ban.
Magyarországon az Élő Laborokat Gödöllő városában szerveztük meg. Azt, hogy ugyanazt a helyszínt választottuk a két - egyéni és csoportos - Élő Labornak az indokolta, hogy jobban össze lehessen hasonlítani az egyéni és csoportos formát. Magyarországon összesen 41 háztartás vett részt az Élő Laborokban, melyből 21 az egyéni (ELL1), 20 pedig a csoportos (ELL2) változatban.
Figyelemreméltó, hogy mind a 41 háztartás elejétől végéig részt vett a programban, vagyis nem volt lemorzsolódás menet közben.
Az Energia Élő Laborok megvalósításának folyamatát az alábbi ábra szemlélteti:
Az Élő Laborokban a választott beavatkozási módszer a kihívás volt. A résztvevő háztartások számára a következő kihívásokat fogalmaztuk meg mind a nyolc országban:
felezzék meg heti mosásaik számát; valamint
csökkentsék 18 °C-ra a nappali beltéri hőmérsékletet.
Abban az esetben, ha a résztvevők úgy érezték, ezeket a kihívásokat nem tudják vállalni, választhattak saját kihívást is, amely igazodott saját élethelyzetükhöz (pl. kisgyermekes családok esetén némileg magasabb beltéri hőmérséklet, vagy eleve kevés mosás esetén a mosásra fordított energia más módon történő csökkentése).
Magyarországon a résztvevők 54%-a vállalta a közös mosási kihívást, azaz a heti mosások számának felére történő csökkentését. A több résztvevő egyéni, saját kihívás megfogalmazása mellett döntött. A közös fűtési kihívást, mely a nappali beltéri hőmérséklet 18 C-ra történő csökkentését jelentette, a résztvevők csupán 33%-a vállalta. Ennek részben az volt az oka, hogy a magyar lakosság jellemzően melegebbre fűti otthonát télen.
5
A mosási naplók adatai szerint az összes résztvevőt tekintve a mosások átlagos száma 21%-kal csökkent, és egyúttal az átlagos mosási hőmérséklet is alacsonyabb lett. Ennek következtében a mosáshoz kapcsolódó átlagos heti energiafogyasztás 22%-kal csökkent.
Az adatrögzítő hőmérők adatai alapján a beltéri hőmérséklet átlagosan 1 C-kal csökkent.
Mindemellett érdemes megjegyezni, hogy több résztvevőnek is sikerült mosásainak számát 50%- kal csökkentenie, és olyanok is voltak (a résztvevők 15%-a), akiknél a belső nappali átlaghőmérséklet 19 C alá csökkent.
A változás annak köszönhető, hogy a résztvevő háztartások nagyobb figyelmet fordítottak mosási és fűtési gyakorlatukra, illetve annak, hogy segítségükre álltak a kihívások megvalósítását segítő eszközök (ld. kihívás dobozok), tippek, mérőeszközök (fogyasztásmérő, hőmérő). A program során elsajátított tudás segítségével sokféle olyan gyakorlatot és szokást vezettek be (vagy elevenítettek fel), amelyekkel kevesebb mosás mellett is tisztán, és a fűtés feljebb vétele nélkül is komfortosan érezték magukat. Az alapállapot és záró kérdőívek adatai alapján egyértelmű bővülés figyelhető meg az ilyen jellegű gyakorlatok alkalmazása terén, illetve nőtt azon résztvevők száma is, akik egyszerre több gyakorlatot alkalmaztak (a mosás elkerülése érdekében pl. csak a foltok kimosása, a ruhák szellőztetése, kötény viselése, a fűtési hőmérséklet csökkentése kapcsán pedig pl. pulóver és meleg zokni viselés, meleg italok fogyasztása, pokróc használata stb.).
Különösen biztató, hogy az Energia Élő Laborok zárása után három hónappal kitöltött felkövető kérdőívek eredményei, valamint a mérőóra leolvasások adatai alapján azt láthatjuk, hogy a változások az Élő Laborok lezárása után is folytatódtak mind a megváltozott gyakorlatok (ld. ábra:
alacsony hőfokon történő mosások gyakorisága), mint a megtakarított energia mennyiségét illetően. Ez utóbbi tekintetében elmondhatjuk, hogy előző évi fogyasztásukhoz képest az Élő Labor résztvevői az Élő Labor végéig átlagosan 10 %-kal csökkentették összes energiafogyasztásukat, amely értéke a 3 hónappal később végzett felmérés alapján 15%-ra emelkedett.
Habár még folyamatban van az egyéni és csoportos Energia Élő Laborok közti különbségeket feltáró elemzés, az már most is jól látható, hogy a csoportos forma motiválóbb a résztvevők számára. Ezt több tényező is alátámasztja, pl. az emberek hangulatváltozása a folyamat során, a csoportos résztvevők magasabb szintű elköteleződése, és a megannyi személyes visszajelzés a csoporttalálkozón való részvétel előnyeiről. Utóbbiak között említhetjük a már létező fenntartható gyakorlatok csoporttagok által történő megerősítését, az egymástól való tanulás lehetőségét, valamint a hasonló gondolkodású emberek közösségéhez való tartozás élményét.
6
A program szakmapolitikai vonatkozásait illetően a magyar Élő Laborokkal arra szeretnénk rámutatni, hogy a háztartások nagy felelősséggel bírnak, és fontos szerepet töltenek be az energiarendszer átalakítása terén. Nagyon fontos látni azt, hogy a mindennapi szokásokban bekövetkező, látszólag kis változásoknak – pl. a hőmérséklet vagy a mosások számának csökkentése – is milyen nagy hatása lehetne akkor, ha minden háztartás alkalmazná ezeket a gyakorlatokat (ld. például táblázat). Ehhez kapcsolódóan és a módszertant illetően elmondhatjuk, hogy a kvalitatív és kvantitatív módszerek és programelemek ötvözése nagyon hatékony módja annak, hogy segítsük a résztvevőket szokásaik megváltoztatásában.
Végezetül, nagyon fontos annak biztosítása, hogy az Energia Élő Laborokhoz hasonló kezdeményezéseket a megvalósítás helyszínén beágyazottan valósítsuk meg, hogy ezzel is hozzájáruljunk a hosszú távú hatásokhoz. Az a tény, hogy a helyi közösség ismerte a GreenDependent Intézetet, könnyebbé tette a háztartások bevonását, elősegítette, hogy a résztvevők végig a programban maradjanak, valamint ahhoz is hozzájárult, hogy további változások történjenek, mégpedig egy természetes folyamat részeként.
CO2 (tonna)
Hány átlagos magyar éves CO2kibocsátásával
egyenlő?
Élő Labor résztvevők (38 házt.) 0,025 -
Gödöllői háztartások (12 015 házt.) 8 2
Magyar háztartások (4 105 708 házt.) 2742 566
Magyar háztartások 1 év alatt 32908
6788
kb. Mogyoród vagy Zirc nagyságú település*
7
A RÉSZTVEVŐK VISSZAJELZÉSEI AZ ENERGIA ÉLŐ LABOROKRÓL
A résztvevők visszajelzéseit három információforrás alapján vizsgáltuk meg: (1) az egyéni záró interjúk során megfogalmazott visszajelzések; (2) a csoportos záró találkozón adott visszajelzések;
valamint (3) azok a válaszok, melyek az Energia Élő Laborok lezárása után három hónappal kitöltött felkövető kérdőívekben szerepeltek.
Az egyéni interjúk végén az egyéni formában résztvevők arról számoltak be, hogy milyen élmény volt az Élő Laborokban való részvétel számukra. Általában véve örömüket fejezték ki, hogy részt vettek a kihívásokban, és elmondásuk szerint új gyakorlatokra és készségekre tettek szert, továbbá új információkat kaptak az otthoni energiafogyasztásról.
"Érdekes volt részt venni a programban; azért csatlakoztam, hogy többet megtudja az energiahasználatról és megtakarításról. Megéri odafigyelni ezekre a dolgokra, sokat tanultam, és felkeltette az érdeklődésemet, hogy a napi viselkedésem
megváltoztatásával takarítsak meg. Elképesztő, hogy mindig találok még valami megtakarítási lehetőséget." (egy hölgy résztvevő)
"Jó érzéssel töltött el a részvétel, legközelebb is csatlakoznék. Jó volt a kihívás, mert nem volt túl sok; nem volt az, hogy már alig várjuk, hogy vége legyen. Azért nem mondom, hogy hiányozni fog a naplóírás. De, ha jól belegondolok, még a napló írása sem volt túl megerőltető." (egy hölgy résztvevő)
Azt is el kell mondani, hogy habár az észrevételek többsége pozitív hangvételű volt, néhány résztvevő szerint időnként megerőltető volt a részvétel, főként a sok “adminisztráció” (pl. a mosási és fűtési naplók, heti kérdőívek kitöltése) miatt. Az alábbi idézetek is ezt a véleményt tükrözik:
"[A részvétel kapcsán] több tennivalónk volt, megnőtt az otthoni munka mennyisége.
De kihívás is volt. És cserébe új gondolatokat, tippeket és tapasztalatokat kaptunk.
Érdekes volt. " (egy hölgy résztvevő)
"Fárasztó volt. Örültem, hogy végre hazaérek, de még le kellett olvasnom a
mérőórákat, mérőket. Néha az kívántam, bárcsak ne jelentkeztem volna. " (egy hölgy résztvevő)
A csoportos formában résztvevők a részvételt illetően hasonló észrevételeket tettek a záró fókuszcsoportos találkozón. Általában nagyon szívesen vettek részt a csoportos Élő Laborokban, senki nem bánta meg, hogy csatlakozott a programhoz. Mindenki úgy nyilatkozott, hogy nagyon jó volt a csoport része lenni, és élvezték a találkozókat.
A résztvevőknek nagyon tetszett a kihívás dobozok tartalma (ld. képek) és a különböző mérő eszközök, valamint az, hogy a program alaposan átgondolt és megtervezett volt. Azt is előnyként említették, hogy a közös kihívás ellenére választhattak saját kihívást is. Úgy érezték, hogy az Energia Élő Laborok program olyan volt, mint egy társasjáték.
8
Az egyik legfontosabb észrevétel, melyre sokan rámutattak, arra vonatkozott, hogy a csoportos Élő Laborok résztvevői megerősítést, támogatást és inspirációt kaptak mind a környezetbarát életmóddal, mint a fogyasztáscsökkentéssel kapcsolatban. Többen közülük azt is kifejezték, hogy szeretnék folytatni az ez irányú erőfeszítéseket; ennek alátámasztására sokan feliratkoztak a GreenDependent által szervezett, helyi és országos fenntartható életmóddal kapcsolatos programokban való részvételre (pl. helyi klíma-klub, országos E.ON EnergiaKözösségek program).
Emellett a résztvevők örültek a lehetőségnek, pozitív energiát és ösztönzést kaptak az Energia Élő Labor csoportban való részvétel során.
A felkövető kérdőív végén 14 résztvevő osztotta meg észrevételeit az Energia Élő Laborokban való részvétel kapcsán. Ezek a megjegyzések túlnyomóan pozitívak, néhányan még a programban való részvétel lehetőségét is megköszönték. Alább olvasható néhány idézet a résztvevőktől:
"Számomra nagy élmény volt részt venni a projektben, nagyon inspiratív volt, hatással volt más környezetvédelmi dologra is az életemben, a GreenDependent pedig
rendkívül profin rendezte meg, szívből gratulálok!!!" (HU99)
"Szuper kezdeményezés! Határozottan volt benne kihívás. Remekek és minőségiek az ajándékok. :)" (HU106)
"Nagyon jól éreztem magam az összejöveteleken, jók a kérdések, mert így összeszedve tudatosabban tudtam figyelni az elfogyasztott energiára. Azt hiszem beépült a figyelem a mindennapjaimba, köszönöm." (HU39)
"Érdekes volt, akár más tevékenységre is szívesen végigcsinálnám." (HU21)
"Köszönjük a részvétel lehetőségét, igazán sokat tanultunk, tapasztalatunk!' (HU32)
9
KÖVETKEZTETÉSEK ÉS ÉSZREVÉTELEK
Az Energia Élő Laborok során és a lezárást követő időszakban sokféle módon történt változás, melyek a fenntarthatóbb energiahasználat és –fogyasztás irányába hatottak. A változásnak mennyiségi és minőségi aspektusai is voltak.
A mosás és ruhák tisztántartása kapcsán az alábbi mennyiségi, kvantitatív változások történtek:
csökkent a heti mosások száma
(az Élő Labor résztvevők csoportjában átlagos csökkenést figyeltünk meg);
csökkent az átlagos mosási hőmérséklet; és
csökkent a mosással kapcsolatos energiafogyasztás.
10
A fűtés kapcsán az alábbiakban történt mennyiségi változás:
csökkent a beltéri hőmérséklet; és
csökkent a fűtéshez kapcsolódó energiafogyasztás is.
Minőségi, kvalitatív változás szintén sok területen történt. A mosási kihívás során az alábbi változások történtek:
megváltozott a mosógép használatának módja (például a programok kiválasztása, a programok beállítása, telepakolás módja stb.);
változott az, hogy miért döntenek úgy a résztvevők, hogy kimosnak egy-egy ruhadarabot: a hordás hosszáról (ami nem feltétlen jelent koszos ruhát) a hangsúly a kellemetlen szagra és a foltokra tevődött át;
változott az is, hogy milyen és hány módszert alkalmaznak arra, hogy elkerüljék a ruhák mosását; valamint
11
végül változott a tudatosság szintje a mosás energiafogyasztásával, a mosáshoz kötődő társadalmi normákkal, valamint a mosás és a ruhatár mérete és minősége közti
összefüggésekkel kapcsolatban.
A fűtés kapcsán szintén többféle változás történt:
változott a tudatosság szintje a hőmérséklettel valamint a beltéri komfortérzést befolyásoló sokféle tényezővel kapcsolatban;
változott a termosztátok, termosztatikus szelepek és a nyílászárók használata az
otthonokban, illetve, hogy ezek használata miképpen hat a hőérzetre és a felhasznált fűtési energia mennyiségére;
változott annak a megítélése, hogy mi az ideális beltéri hőmérséklet az egyes helyiségekben (ld. csökkent az ideálisnak tartott hőmérséklet);
illetve változott, hogy milyen és párhuzamosan hány praktikát alkalmaznak a háztartások arra, hogy a fűtés feljebbvétele nélkül is melegen tudják tartani magukat.
Fontos megjegyezni, hogy a mennyiségi és minőségi változások az Élő Laborok lezárását követő időszakban is folytatódtak, ez derült ki ugyanis az Energia Élő Laborok lezárása után három hónappal készült felkövető kérdőívekben adott válaszok elemzése alapján. Mindez nagyon
12
biztató, viszont érdemes lenne megvizsgálni azt is, mi történik hosszabb távon, például egy évvel azután, hogy véget értek az Élő Laborok.
Ami az egyéni és csoportos Élő Laborok közti különbségeket illeti, az elemzések még folyamatban vannak. Mindazonáltal az eddigi eredményeink alapján megállapítható, hogy a csoportos forma a legtöbb résztvevők számára motiválóbb részvételi forma. Mindez alátámasztja a "Szokásaink megváltoztatása" (Changing Behaviour) című, a GreenDependent egy korábbi kutatási projektje eredményeit is (Heiskanen et al., 2010), amelyben hasonló következtetésre jutott a kutatói csapat. A csoportos forma előnyei tehát:
a résztvevők hangulatának változása a folyamat során, mely szerint a csoportos résztvevők kevesebbet aggódtak, és gyakrabban mutatták a lelkesedés jeleit;
a csoportos résztvevőknél erősebb volt az elköteleződés, ezt mutatta a kitöltött heti kérdőívek száma is (az egyéni háztartások kevesebb kérdőívet töltöttek ki);
a résztvevők a csoporttalálkozókkal kapcsolatban sok pozitívumot említettek, pl. a fenntartható gyakorlatok megerősítése, egymástól új módszerek tanulása, valamint a hasonló gondolkodású emberek közösségéhez való tartozás élménye.
Emellett fontos megemlíteni, hogy a csoportalapú élő laborok szervezése kevésbé erőforrás- igényes, mint az egyéni élő laboroké, így a program esetleges kiterjesztésének költsége aránylag alacsonyabb.
Itt kell megjegyeznünk, hogy viszonylag sok résztvevő mutatott érdeklődést aziránt, hogy tovább csökkentse energiafogyasztását otthona energiahatékonysági felújítása, valamint megújuló energiák hasznosítása által.
További információk az ENERGISE Energia Élő Laborokról magyarul:
www.energise.hu
13
SUMMARY
ENERGISE Living Labs (ELLs) employ practice-based approaches to reduce energy use in households while co-creating knowledge on why energy-intensive practices are performed and how they depend on the context in which they are performed. Altogether 16 living labs were implemented in eight European countries in 2018.
The Hungarian ELLs were located in the town of Gödöllő in Central Hungary in order to provide a better opportunity to make comparisons between the individual (ELL1) and the community or group approach (ELL2). The final number of households participating in the ENERGISE Living Labs in Hungary was 41. Out of this number 21 participated in ELL1 and 20 in ELL2. It is notable that all 41 households remained engaged in the ELLs up until the end.
In Hungary, about 50% of the participants took on the common laundry challenge of reducing the weekly number of washing cycles by half; the rest formulated an individual challenge. The common heating challenge of reducing daytime indoor temperature to 18 C - which was exceptionally challenging in Hungary where indoor temperatures are generally considerably warmer - was undertaken by 30% of the participants.
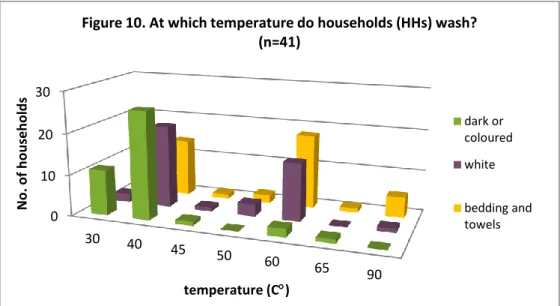
Based on laundry diary data, the average number of laundry cycles was reduced by 21%, and was also accompanied by a reduction in washing temperature. This lead to a 22% reduction in average weekly laundry-related energy consumption in participating households.
Based on data from temperature loggers, indoor temperatures were reduced by 1 C on average.
These changes occurred as a result of participating households paying careful attention to their washing and heating practices, and with inspiration gained from challenge kits, tips and metering equipment, learning to apply various practices to keep clean or warm without washing and turning on the heating, respectively. With information collected through before (baseline) and after (closing) surveys we can see a definite rise both in the number of such practices applied by participants, and the number of participants applying several of them parallel.
What is especially encouraging is that based on information gathered through a follow-up survey administered three months after the ENERGISE Living Labs ended as well as meter readings, changes appear to have continued even after the conclusion of the labs both in terms of changed practices and energy saved.
As for differences between the individual (ELL1) and the group format (ELL2), although our analysis is still ongoing, based on the results that we already have the group format seems to be more motivating for participants. This is supported by various factors, for example how their mood changed during the process, the higher level of commitment by ELL2 participants, and the many reported positive aspects of participating in group meetings such as confirmation of sustainable practices, learning opportunities as well as a sense of belonging to a group of like-minded individuals.
In terms of policy implications, the Hungarian ELLs point to the importance of drawing attention to the role and responsibility of households in the energy transition, including the fact that even seemingly small changes in daily practices like reducing the temperature or the number of weekly washes can have big effects if each and every household makes them. Related to this and regarding methodology, combining qualitative and quantitative programme elements is a very effective way of helping participants change their practices.
To conclude, we should also underlie the significance of embedding initiatives like the ENERGISE Living Labs locally in order to contribute to their longer-term impact. The fact that GDI was known in the local community made recruitment easier, helped to keep participants involved in the programme, and will also make their continued change and engagement part of a natural process.
14
1. ELL DESCRIPTION
The Hungarian ELLs were both located in the town of Gödöllő (35.000 inhabitants) in Central Hungary in order to provide a better opportunity to make comparisons between the individual (ELL1) and the community or group approach (ELL2). At the same time, the local partner, GreenDependent (GDI), took great care to keep the two groups separate, which was successful as even until the common celebratory event held after the final focus group, ELL1 participants were left guessing who the other households participating in the living labs were. Thus, GreenDependent is satisfied that no interaction took place between the two ELL groups.
The recruitment process in Hungary started in June 2018 and was completed in August. More than 90 households started to fill in the recruitment survey and about 70 of them completed it. Out of these households about 55 satisfied the requirements for participation, thus 45 were selected to potentially allow for people to withdraw for various reasons. This indeed happened, so the final number of households participating in the ENERGISE Living Labs in Hungary is 41. Out of this number 21 participated in ELL1 and 20 in ELL2. It is notable that all 41 households remained engaged in the ELLs up until the end.
In the sections below we first present the socioeconomic and demographic characteristics of the Hungarian ELL participants. Then the characteristics of their dwellings and living environments are presented, and finally, their prior engagement with energy initiatives. These data are based on a survey used when recruiting participants and complemented with observations made when visiting the households for the first time. For these data we only present the data of those households that started the ELLs (n=41).
1.1 SOCIODEMOGRAPHIC AND SOCIOECONOMIC CHARACTERISTICS OF THE ELL PARTICIPANTS
During the recruitment process GDI strived to have a diverse composition of participant households as much as possible.
At this point, it is important to mention that Gödöllő has a more favourable social and economic situation than the Hungarian average. This occurs for various reasons, among them the fact that the town is situated in Central Hungary, and it is host to a well-known university as well as several prestigious secondary education institutions.
As for the number of households the proportion of single households is 33% in Hungary (HCSO, 2017), by comparison the ratio of one-person households in the Hungarian ELLs was 10%. Two- member households include almost entirely couples and only one single parent with an adult child.
Most of the ELL households were with two adults and more than one child, the proportion of four member households is more than 50% among the participants. Besides, there were some three generation households participating in the project as well. (Table 1)
In terms of the age of the contact person, among Hungarian ELLs the share of the age groups is the following: most of the contact persons (59%) were between 30-49 years old, and the ones in the 50-69 age bracket were making up the remaining 41% (Table 1).
There were no contact people in the other two categories (29 or younger and 70 or older), but, naturally, there were participating household members who belonged to these groups.
Table 1 shows the employment status of participating households. The contact persons in most of the households are employed (full-time or self-employed: 68%, part-time: 5%); besides, the proportion of the unemployed was 0% and economically inactive people made up all in all 27%.
15
As for the educational level of participants, they all have qualifications higher than primary. Most of the households’ contact persons (83%) had completed tertiary education as well, which a lot higher than the national average, 22% (HCSO, 2016). 17% of the participants had secondary or vocational education.
Table 1. Socio-demographic and socioeconomic characteristics of participating households Source: recruitment survey (n=41)
Household size (n=41)
1 member 2 members 3 members 4 members
or more
% 10 20 15 56
Age of contact person (n=41)
29 or younger 30-49 50-69 70 or older
% 0 59 41 0
Employment status of contact person (n=41)
Full-time employed or entrepreneurs
Part-time Student//Unemployed Retired
% 68 5 15 12
Educational level of contact person (n=41)
Tertiary Secondary/vocational Primary Other or unknown
% 83 17 0 0
1.2 REASONS FOR PARTICIPATING AND PRIOR EXPERIENCE OF ENERGY INITIATIVES
The main methods used for recruitment in Hungary were the following:
1. Advertisements in the 2 local papers:
one of the papers is delivered to every household in Gödöllő for free,
the other paper is available online as well as in a paper-based format, but it is not free in its printed format)
2. Advertisement on social media (Facebook)
3. Advertisement using the NGO network mailing lists available in the town
The advertisements were carefully written and designed to target people with different messages, highlighting different aspects of the benefits of participating in the ELLs (e.g. being able to participate in European research and contributing to climate policy making, learning about energy consumption, doing something to reverse climate change, receiving energy advice, becoming part of a group, etc.).
In the second part of July 2018 GDI reviewed the people answering the advertisements (and filling in the recruitment survey). The plan was to continue recruitment in August to make sure that there are cc. 45 households selected for participation (and thus allow for some households to withdraw during the process), and to make sure that a varied group of households are selected in terms of
16
socio-economic status. However, there was no need for this second stage of recruitment as a sufficient number and variety of households applied to participate. As stated in the introduction, the final number of households participating in the ENERGISE Living Labs in Hungary is 41: 21 participating in ELL1 and 20 in ELL2. It is notable that all 41 households remained engaged in the ELLs up until the end.
The hard-to-reach group in the case of Hungary comes from the upper-middle-class in the country, whose members rarely participate in similar programmes (see also Table 2), but were recruited successfully for the ELLs. The socioeconomic, demographic and building characteristics data presented here show that the households selected in Hungary are better educated than the Hungarian average, live in newer and larger homes, in the majority of cases in detached homes.
Although we did not directly ask participants why they decided to apply to participate, during the various meetings with them at household visits, interviews, focus group meetings, etc., they mentioned various reasons. Among these reasons were
the wish and to some extent, curiosity, to actively participate in a European research project;
the wish to learn about energy use and to save energy;
motivation to get to know the local partner, GDI more as several of them had heard about the organization before and were interested to find out more about their work.
Participants also reported that they felt lucky and honoured to be selected to participate, and were also thankful to receive the incentives, the metering equipment to begin with (i.e. thermometers, energy meters, thermologgers) and some small accompanying presents such as cloth bag, fridge magnet to strengthen the feeling of belonging to the living lab and ENERGISE project.
As shown in Table 2, only a small share of households mentioned having been involved in information campaigns, having made use of incentives for energy investments, or having previously participated in a challenge or discussion to change everyday routines. A few participants, however, mentioned having been involved in some other type of initiative. Overall, the participants selected had a very limited prior experience with energy or sustainable lifestyles initiatives, and if they did, it was mostly with information campaigns or incentives, thus not programmes focusing on everyday practice change at home.
Table 2. Share of participants having prior experience of energy initiatives, in % Source: recruitment survey (n=41)
At home, % At work, % At school, %
Information campaign, tips for saving energy 2 7 2
Incentive to buy efficient appliances
(including light bulbs) 2 - -
Incentives to invest in renewable energy 2 - -
Incentives or support for energy efficiency 2 - -
Challenge/discussion to change habits and
everyday routines - 2 -
Other - 5 2
17
1.3 BUILDING CHARACTERISTICS OF ELL PARTICIPANTS
In terms of type of dwelling both ELL1 and ELL2 participants in Hungary mainly live in detached houses (74%), but terraced/semi-detached houses are also typical (24%). Besides, there was only one participant who lives in an apartment. As shown in Figure 1, this share is somewhat different from the national average of Hungary; people living in apartments are slightly underrepresented in the ELL households of Gödöllő. To compare, in Hungary 65% of the population live in a detached house, 7% of them live in a semi-detached house and the proportion of apartments is 27%.
Another interesting aspect is comparing the Hungarian data to the EU-28 average. The proportion of apartments (42%) and semi-detached houses (24%) is higher in the EU than in Hungary (Eurostat, 2018).
Figure 1. Distribution of population by type of dwelling, % – EU-28 (2017), Hungary (2018), ENERGISE project (2018)
Source: Eurostat (table code: ilc_lvho01); recruitment survey (n=41)
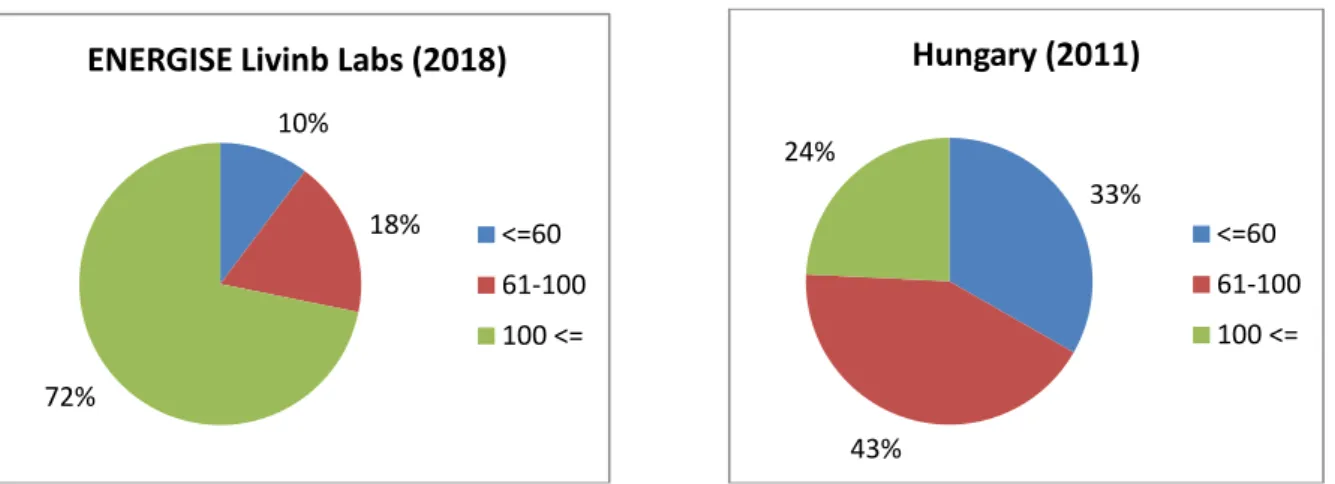
The valuable of size of dwelling is somewhat related to household size. As shown in Figure 2, the Hungarian ELL households with four or more members live in a house of at least 70 m2, and 77%
of them live in homes that are over a 100 m2.
Most of the participants (72%) live in a house that is larger than 100 m2 (39% of them live in a house with a size over 140 m2), 18% of participants have 61-100 m2 living space and 10% live in a house or apartment under 60 m2. The distribution is quite different from the national data. In Hungary 24% of the population live in a house or flat that is larger than 100 m2, the ratio of the 61- 100 m2 category is 43%, and 33% of inhabitants live in a house or apartment under 60 m2 (HCSO, 2011a). This difference underlies the fact that ELLs in Hungary managed to involve the harder-to- reach group of more well-off households.
33.6
24.0 41.9
0.6
EU-28 (2017)
Detached house
Semi-detached house Apartment
Others 6.5 64.6
27.3
1.6
Hungary (2018)
Detached house
Semi-detached house Apartment
Others
74.1 24.5
1.4
ENERGISE Living Labs - Gödöllő (2018)
Detached house Semi-detached house Apartment
18
Figure 2. Share of households by size of dwelling, ELL households (2018) and national average of Hungary (HCSO, 2011a)
Source: recruitment survey (n=41) and HCSO, 2011a
As for the age of dwellings, Figure 3 shows that most of the Hungarian participants live in a house built after 1980 (78%), which is much higher than the national average (32%). 65% of them have a house or apartment built between 1980 and 2000 and 13% of them live in a house built after 2000.
Besides, the proportion of houses built before 1970 is lower, all in all 23%, of which 20% live in a house built between 1920 and 1980, and the remaining 3% have an old house built before 1920.
Figure 3. Distribution of households by age of dwelling, ELL households (2018) and national average of Hungary (2011b)
Source: recruitment survey (n=41) and HCSO, 2011b
There is an important dimension connected to the age of dwelling that is the decade when participants’ building last underwent a major renovation (that influenced its energy consumption).
However, the proportion of households that could not answer this question is high (41%). Still, based on the responses available, the proportion of ELL participants who had a major renovation after 2000 is more than 50%. There is only one person who had his/her home renovated between 1990 and 2000.
Last but not least, the data on the energy efficiency performance of ELL participants' buildings is very incomplete. 78% of participants were not aware of having an energy certificate. There were only 9 participants who were able to provide this information. Out of these, 3 households have A or A+ class homes, and 6 participants have homes that are between the B and C classes.
10%
18%
72%
ENERGISE Livinb Labs (2018)
<=60 61-100 100 <=
33%
43%
24%
Hungary (2011)
<=60 61-100 100 <=
22%
65%
13%
ENERGISE (2018)
Before 1980 1980s-2000s After 2000
68%
23%
9%
Hungary (2011)
Before 1980 1980s-2000s After 2000
19
Table 3. Characteristics of the participants’ dwellings Source: recruitment surveyType of dwelling
(n=41) Apartment Terraced/semi-
detached Detached Other
% 2 24 73 0
Size of dwelling
(n=39) <=60 m2 61-100 m2 101-140 m2 >140 m2
% 10 18 44 28
Age of dwelling,
built (n=40) before 1920 1920s-1970s 1980s-2000s After 2000
% 3 20 65 13
Most of the Hungarian ELL households are served by a combined heating system and all of them have an individual system (mainly natural gas based). Generally people prefer to have complex heating systems in Hungary, i.e. systems that are built up of various components, preferably run on different fuels. Thus, a large share of participating households also has additional wood heating because it provides independence from the international and national energy grid (i.e.: electricity, gas, oil).
Based on 2011 data, the proportion of dwellings with central heating system was 16% in Gödöllő, which was a little higher than the national average (15.5%). (Local Agenda 21 of Gödöllő, 2013;
HCSO, 2011c)
Central heating can be divided into two main types in Hungary: central heating from a community heating centre and central heating from an installation in the building or in the dwelling.
As for the primary heating source (Table 4), gas heating is the most typical for Hungarian ELL households (78%), which reflects well the share of dwellings with a gas heating system in Gödöllő (84%). (Local Agenda 21 of Gödöllő, 2013) The second most popular is biomass heating (15%), and there were two participants (5%) with fully electronic technology (solar panels) too.
In the case of secondary heating systems, the picture is different and more diverse. Among secondary heating sources wood and gas heating are the dominant (with 10 and 9% share, respectively). They are followed by electricity – mixed source – (6%) and last but not least some households also have solar collectors (3%).
In relation to wood heating as a secondary heating source, it is interesting to mention that wood- burning tile stoves constitute one of the traditional heating methods, and are still fairly popular all over the country. It came up during interviews with ELL1 participants and at the focus group discussion with ELL2 participants that many of them still have very fond memories or positive experience about having a tile stove in their childhood, and, in fact, now in their homes. The role of the tile stove or similar stoves (see picture from the home of one of the participants) became emphasized as a result of the heating challenge as well in relation to which several participants mentioned that they would be fine with lower indoor temperatures if there was one warmer spot, i.e. a stove in their home.
20
Table 4. Heating sources of ELL participants Source: recruitment survey (n=41)Primary heating source, % Secondary heating source, %
Gas 78 9
Oil 0 0
Coal 0 1
Electricity – solar panel 5 0
Electricity – mixed system 0 6
Biomass 15 10
Solar collectors 0 3
Heat pump 0 0
District heat 0 0
Other/don’t know 2 0
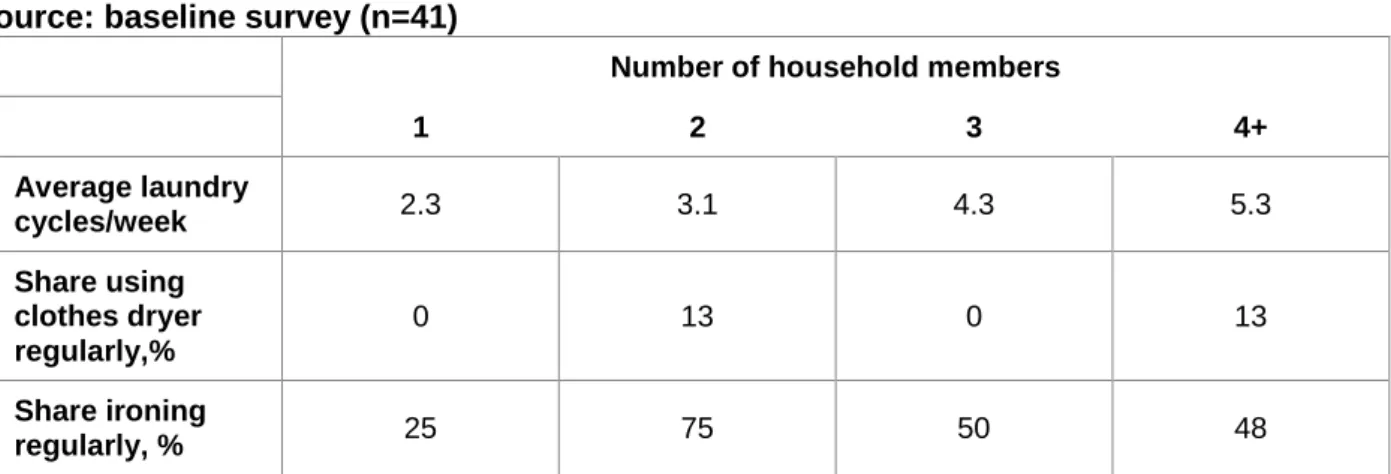
As for laundry (Table 5), there were several different criteria applied at recruitment. One of them was that in order to participate, households had to have their own washing machine. Thus, all of the participants own a washing machine, but some of them (10%) also use a shared washing machine (shared with another household) on a regular basis (more than twice per month). During the socialist regime, and when hand-washing was still the most widespread way to launder clothes, the use of common laundry rooms in housing estates was typical in Hungary. However, with washing machines becoming more available, nowadays this option almost disappeared from the social norms. Shops with several washing machines that can be used by anyone are pretty rare and rather expensive, and there are only a few even in the capital, Budapest.
73% of the ELL households have a washing machine that has an eco-programme; however, interviews and focus group discussions revealed that people are confused about the eco- programme (there was confusion in general about the eco programme: why is it eco? how is it eco?). As a consequence, most of the people were happy to have the opportunity to test their eco- button during the challenge with the energy meter.
In terms of the equipments, 29% of the households have the most energy efficient washing machine (A++ rated machines) and 15% of them have a tumble dryer or drying cabinet. There were no participants who use a shared tumbler-dryer or drying cabinet on a regular basis (more than twice per month).
Table 5. Laundry equipment owned or used by the households Source: recruitment survey (n=41) and baseline survey1 (n=41)
Households with this equipment, feature or service, %
Tumble dryer or drying cabinet (n=41) 15
A++ rated washing machine (n=41) 29
Washing machine with eco-programme(n=41) 73
Regular use of laundry room (n=41) 10
1 Data on AA+ rated washing machine and washing machine with eco-programme are from the baseline survey.
21
1.4 TOOLS AND APPROACHES USED FOR ELL1 AND ELL2 OUTREACH AND COMMUNICATION
In Hungary GDI made a special effort to implement ELL1 and ELL2 in as similar a way as possible except for using the individual or the group approach. Thus, all the materials distributed and the communication methods used were the same:
participants were recruited using the same approach and materials;
participants received the same newsletters (GDI created a newsletter for ELL participants);
the same person conducted the first visit to all ELL1 and ELL2 households to ensure that they all receive the same welcome to and information about the project;
they all received exactly the same challenge kits, tips, etc.;
as shown in Figure 4 they all had the same laundry and heating challenge periods;
etc.
Within this framework, there were some methods and actions that were different depending on whether the participant was involved in ELL1 or ELL2. Apart from conducting the deliberation and closing phases differently, i.e. participants having individual interviews in their homes in ELL1 and participants gathering in a community venue to take part in a focus group discussion in ELL2, in Hungary the following activities were undertaken to emphasize and strengthen the group approach:
an additional group meeting was held halfway through the living lab active period (see Figure 4) to provide an opportunity to meet and discuss experience, and also for GDI to facilitate group development processes;
a social media (Facebook) group was set up to allow for more exchange of information and experience.
Based on feedback from participants, the halfway meeting was really useful and provided additional motivation for people to stay involved as well as to try out some extra ideas that they heard from their peers.
Figure 4. The timeline and activities of the ELLs in Hungary
Figure 4 also highlights the activities and materials that were specific to ELLs in Hungary (see lines with grey colouring). For example, GDI created a newsletter for ELL participants to use as a means of communication. A newsletter format was selected in order to allow for creating a specific design to strengthen identification with the project. The newsletter was then used to provide all kinds of
22
information to households: reminders about challenge dates, invitation to events, provision of extra materials, useful information about participation, etc. Thus, the newsletter was used to provide extra laundry and heating tips to all participating households halfway through each challenge to ensure that each household could find some new information and thus have an opportunity to learn.
Households were also offered the chance to sign up to energy advice visits in the framework of which they could receive household-specific behaviour and practice change based saving tips. To facilitate these meetings, GDI also prepared household energy saving tips booklets that provided tips for all household areas, not only laundry and heating (e.g. lighting, cooking, maintenance and settings, mobility, involving household members in energy saving, etc.).
Finally, as part of the weekly surveys, once every month ELL participants in Hungary were asked to provide their meter readings in order to facilitate the calculation of energy saving.
As stated above, all households were visited by the same representative of GDI at the beginning of the project when consent forms were signed, meters were installed and diaries distributed. The 'welcome pack' - packed in to an ELL bag as shown in the
picture - distributed to all households included the following items:
Information about data collection and metering: consent form;
Guidelines for using the meters;
Meters (thermologger, thermometers, energy meters);
Various diaries;
Printed copy of ELL timeline with tasks, interviews, meetings, etc. Separate one for ELL1 and ELL2 participants;
Fridge magnets (3) to help display the diaries as well as facilitate identification with the project/living lab.
As evidenced by information collected at closing/exit interviews and focus group meetings, households found the metering equipment and diaries really useful for becoming more aware and conscious of their daily practices, the temperature in their homes as well as the energy use of various programmes on their washing machine and driers. Participants also commented that following their consumption with the help of energy meters and writing the diaries helped them get a bit away from their comfortable life.
While 75-80% of participants found the diaries were really useful, about 20-25% said that they were a burden, especially that they also needed to report the same data in weekly surveys.
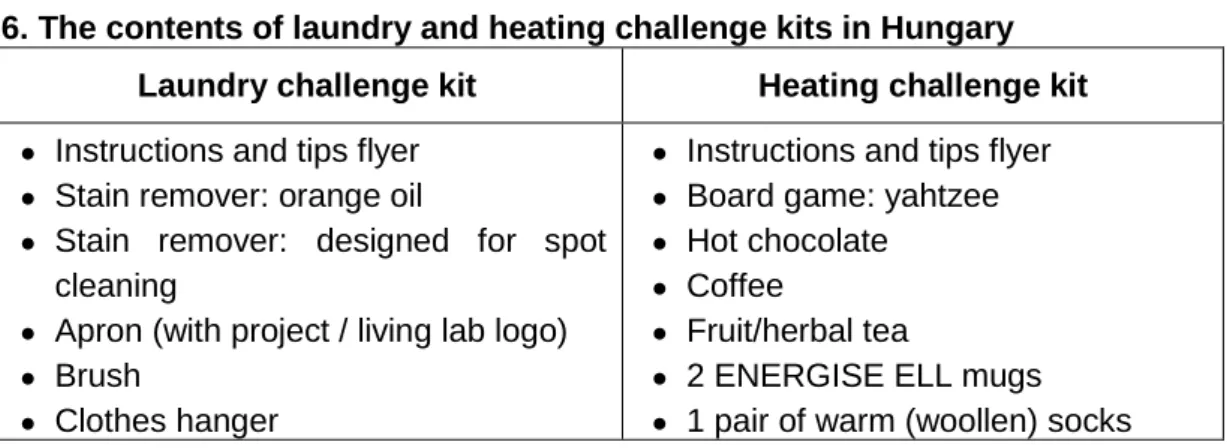
Laundry and heating challenge kits (see Table 6 and Figure 5) were received with great enthusiasm both at the end of deliberation interviews and at the focus group meeting. Participants were really excited about opening them, and then found the contents very useful (see Table 6 for the contents of the kits). From the laundry kits the most liked item, the absolute favourite was the stain remover with orange oil2, and then the other stain remover. The apron and the brush were also mentioned. And some people remarked that they were just about to get a hanger like the one GDI provided. Participants also mentioned that it was good to receive good quality items.
As for the heating challenge kit, the most favourite items were the woollen socks, the hot chocolate and the ENERGISE mugs. People liked the yahtzee as well, which one of the participants started using in teaching.
Apart from helping participants to think about alternative ways of doing laundry and heating themselves (rather than the whole space), challenge kits were also useful for increasing
2 Please note that participants received 2 different kinds of stain removers in Hungary.
23
identification with the ENERGISE ELLs and motivate participants to persevere in their efforts. In addition, because of the timing of the ELLs, the content of the challenge kits provided ideas for Christmas presents.
Table 6. The contents of laundry and heating challenge kits in Hungary Laundry challenge kit Heating challenge kit
Instructions and tips flyer
Stain remover: orange oil
Stain remover: designed for spot cleaning
Apron (with project / living lab logo)
Brush
Clothes hanger
Instructions and tips flyer
Board game: yahtzee
Hot chocolate
Coffee
Fruit/herbal tea
2 ENERGISE ELL mugs
1 pair of warm (woollen) socks Figure 5. Laundry and heating challenge kits
Laundry challenge kit (without and with the apron and info sheet):
Heating challenge kit (in and out of the challenge box):
24
2. PRACTICES BEFORE THE CHALLENGE (FROM THE DELIBERATION PHASE)
This section examines the practices existing in the households before the challenges. It is based on a survey (baseline survey) sent to all participants and on qualitative individual interviews (ELL1) or focus group discussions (ELL2) conducted before the start of the challenges. These datasets are complemented, where relevant, with observations made during home visits when metering equipment was installed and diaries distributed. In the following, we first discuss practices related to thermal comfort, and then, practices surrounding laundry patterns in the participating Hungarian ELL households.
2.1 PRACTICES RELATED TO THERMAL COMFORT
Home heating is often viewed as a gendered practice, where control of home heating systems is often ascribed as a male activity (e.g. Offenberger and Nentwich, 2013). Among the Hungarian ELL participants, however, the difference in who looks after temperature settings is not as large as one might expect. In households where both a male and a female adult were present, the male household member looked after the temperature settings in 61% of the cases. If we analyse the data for all households, we find that this number drops down to 52%, i.e. the male household member is responsible for setting the heating system in a bit more than half of the homes.
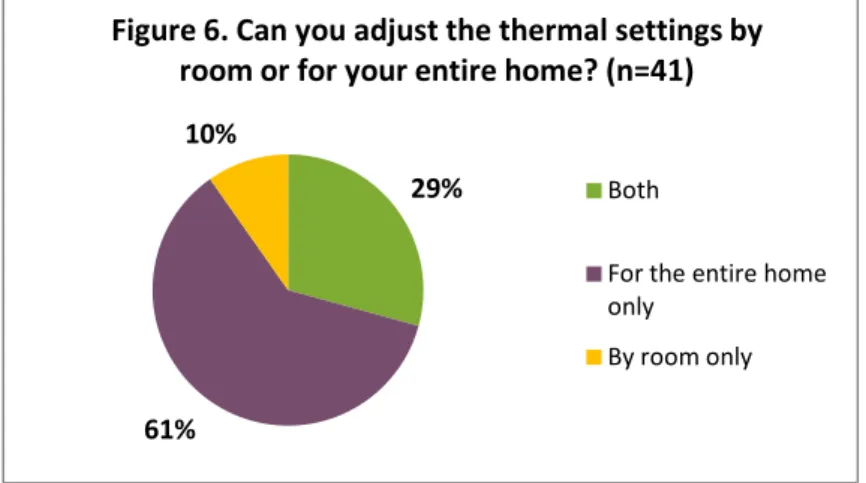
Home heating practices are different in different countries, and also depend on the heating system, for example, whether it can be easily adjusted. As shown in Figure 6, only about a third of the participants in Hungary are able to adjust the temperature for both their entire home and in their rooms. 10% of them can only adjust the temperature in the rooms, which usually means that they heat their homes with natural gas and have gas convectors in the rooms.
Figure 6. ELL participants' ability to regulate temperature in their homes Source: baseline survey (n=41)
Furthermore, on the one hand, as it was mentioned above in Chapter 1, many participants have complex and complicated heating systems. At the focus group meeting and during interviews several participants mentioned a learning process related to their heating system, especially when moving to a new home or renovating a home and installing a new heating system. This means that they need to learn to use it and also need to learn how to set the heating system so that they have the thermal comfort they wish to have. On the other hand, participants did not seem to be particularly worried about adjusting the temperature or that is it too difficult to do. Some of them seemed to be highly proficient and explained the programming of the thermostat in detail.
29%
61%
10%
Figure 6. Can you adjust the thermal settings by room or for your entire home? (n=41)
Both
For the entire home only
By room only
25
Furthermore, it is worth mentioning that quite a few participants reflected on the freedom their individual and individually adjustable heating system gives them.
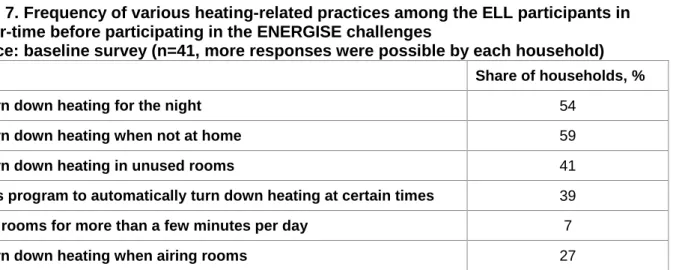
Reflecting a broader Hungarian culture where in recent years there has been a considerable move towards heating systems that could be adjusted individually even in apartment blocks, many Hungarian ELL participant households turn down their heating when they are not at home (59%), for the night (54%) or in unused rooms (41%) (Table 7). Based on the individual interviews and focus group discussion it needs to be noted that on weekdays several households like to have warmer temperature in the morning when people get up and in the evening when everyone is at home.
Table 7. Frequency of various heating-related practices among the ELL participants in winter-time before participating in the ENERGISE challenges
Source: baseline survey (n=41, more responses were possible by each household) Share of households, %
Turn down heating for the night 54
Turn down heating when not at home 59
Turn down heating in unused rooms 41
Has program to automatically turn down heating at certain times 39
Air rooms for more than a few minutes per day 7
Turn down heating when airing rooms 27
Further to the above, as revealed by the individual interviews and focus group discussions, there are big differences in how people regulate their indoor temperature. Some of the most typical approaches and methods that were mentioned are the following:
some people programme their thermostats very carefully, and program it based on their daily routines, and have different temperatures for when they are at home and when they are not, for the night, for when they are away, etc.;
others do not programme the thermostat so much, they set it to a certain temperature (e.g.
21 C), and then have it there all the time and do the fine tuning by setting the thermostatic valves on their radiators in the different rooms;
still others program their thermostats for a day and for a night temperature, and then do not worry about changing it more;
finally, in some households the way of setting temperatures is through using a portable thermostat and placing it in the room that they wish to use as the base (e.g. the room of the youngest kid or the coldest room), and do the rest of the temperature adjustment by manually changing the temperature through the thermostatic valves on radiators.
As revealed by Table 7, the airing of rooms by keeping windows open for longer than a few minutes is not very common among Hungarian ELL participants, and a little less than the third of participants (27%) turn down heating while airing.
Interviews and focus group discussions revealed that people air rooms quite differently. First of all, some people air rooms regularly, opening all windows wide for a short time. Then, others air irregularly, whenever they feel like their home needs to be aired. Still others are more careful about opening windows as they keep indoor plants there and do not want them to die as a result of too much cold air. Finally, some participants do not really air their homes as they have an automatic ventilation system.
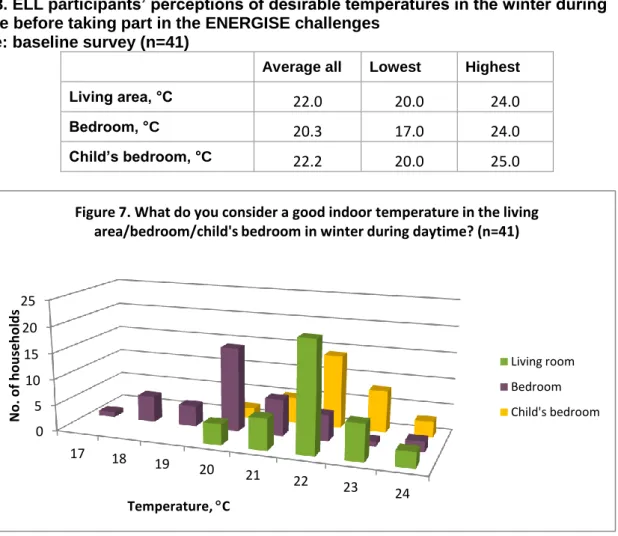
Hungarian ELL participants’ perceptions of desirable winter-time indoor temperatures are shown in Table 8, showing that people on average prefer about 22°C in the living area, 20°C in the
26
bedroom and 22°C in the child’s bedroom (Table 8), albeit with quite some variation as illustrated by the distribution of preferred temperatures for various rooms in Figure 7.
Table 8. ELL participants’ perceptions of desirable temperatures in the winter during daytime before taking part in the ENERGISE challenges
Source: baseline survey (n=41)
Average all Lowest Highest
Living area, °C 22.0 20.0 24.0
Bedroom, °C 20.3 17.0 24.0
Child’s bedroom, °C 22.2 20.0 25.0
Participants were rather satisfied with their current indoor living-room temperatures, which may or may not be the same as the ideal temperature stated by them: about 83% felt their indoor living- room temperatures were just right, while the rest felt the temperature to be too cold. Nobody reported feeling too hot in their current living-room temperature.
About 70% also felt that other household members had the same view on the indoor living-room temperature as the respondent did. Open-ended comments suggested that spouses or children - either female or male - might feel colder than the respondents did.
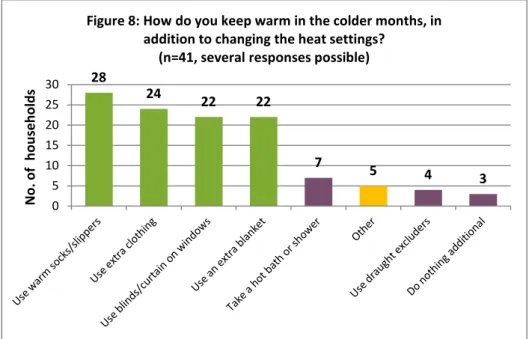
Based on responses given to the baseline survey (Figure 8), ELL participants in Hungary had several ways to keep warm without turning up the heating, even before the start of the heating challenge. The most common ways were using warm socks or slippers (68%), using extra clothing (58.5%), using extra blankets as well as blinds or curtains on windows (both 54%). In addition to these methods during individual interviews (ELL1) and focus group discussions (ELL2) participants also mentioned several other ways of keeping warm:
baking a cake or cooking more dishes;
making sure that the humidity level is appropriate (in winter it is often too low and then we experience the same temperature to be cooler);
arranging and planning the home so that they can use the passive heat from the sun;
using more rugs/carpets in winter;
doing exercises when they are cold (e.g. while watching TV);
sleeping by the tile stove in the living room (and not in their bedroom);
etc.
0 5 10 15 20 25
17 18 19 20 21 22 23 24
No. of households
Temperature, C
Figure 7. What do you consider a good indoor temperature in the living area/bedroom/child's bedroom in winter during daytime? (n=41)
Living room Bedroom Child's bedroom
27
In addition to getting information on which methods households use to keep warm, it was also interesting to see whether they use several of these methods simultaneously already before taking part in the challenges. Our analysis revealed that there are 14 households (34%) that use 3 practices simultaneously, and 24% of households use 4 or 5 practices (Figure 9).
At the same time, it is interesting to note that even though we did not include them in this calculation and figure, several households mentioned using an extra, secondary heating source (most often a wood-burning tile stove in addition to gas heating) as a practice to keep warm without turning the temperature up. Thus, it appears that there is some confusion in people's minds about what constitutes as keeping warm with or without using energy.
As for social norms around indoor comfort, at the focus group meeting with ELL2 participants there was also a lot of discussion about the changing of heating infrastructure, and how people were more often cold when they were kids as a result of not having heating in all their rooms or a central heating system. They also mentioned that kids should never have to feel cold.
Furthermore, it was discussed that in the past people did not have good insulation, good quality windows and doors, so they needed to start heating their homes earlier than now. As a result of
28
24 22 22
7 5 4 3
0 5 10 15 20 25 30
No. of households
Figure 8: How do you keep warm in the colder months, in addition to changing the heat settings?
(n=41, several responses possible)
6 7
14
5 5
4
0 2 4 6 8 10 12 14 16
1 practice 2 practices 3 practices 4 practices 5 practices no practices
No. of households
Figure 9. How do you keep warm in the colder months, in addition to changing the heat settings? (n=41)