7KH'LYHUVH5ROHRI$OSKD2VFLOODWLRQVLQ 9LVXDO2EMHFW3URFHVVLQJ
'LVVHUWDWLRQVXEPLWWHGIRUWKHGHJUHHRI 'RFWRURI3KLORVRSK\
%DOi]V.QDNNHU 6FLHQWLILFDGYLVRU
3URI=ROWiQ9LGQ\iQV]N\3K''6F
5RVND7DPiV'RFWRUDO6FKRRORI6FLHQFHVDQG7HFKQRORJ\
)DFXOW\RI,QIRUPDWLRQ7HFKQRORJ\DQG%LRQLFV 3i]PiQ\3pWHU&DWKROLF8QLYHUVLW\
%XGDSHVW
Acknowledgements
First and foremost, I would like to express my gratitude towards my supervisor, Prof. Zoltán Vidnyánszky. Without his continued support, guidance and patience, this work would not have been possible. I would also like to thank Béla Weiss, for mentoring me on the complex methods of electrophysiology, for the numerous discussions. Their guidance and support has been invaluable for me both personally and professionally.
I am indebted to the Doctoral School, with special regard to Prof. Péter Szolgay and Prof. Tamás Roska, for providing the opportunity to pursue a PhD in a multidisciplinary environment.
I am utterly grateful to Petra Hermann, for her friendship and support, and for introducing me to the subtleties of techno music. I am also thankful to my close colleagues and collaborators in the research group, Pál Vakli, Petra Kovács, Éva Bankó, Emese Maróti, Viktor Gál, István Kóbor, Vanda Nemes, Gergely Drótos, Regina Meszlényi, Ádám Kettinger, Dávid Farkas, Annamária Manga, Máté Kiss, Krisztián Buza for the opportunity to work together with them, their help, fruitful and inspiring discussions, and for enduring all the puns I told throughout the years. I also owe thanks to the Department of Cognitive Science at BME, Márta Zimmer, Kornél Németh, Ágnes Szőllősi, Bertalan Polner and Péter Pajkossy, for the help, inspiring discussions and fun we had together.
I also acknowledge the help of the administrative personnel, especially Katinka Tivadarné Vida for her supportive kindness, and I also owe thanks Anna Torma, Ágnes Bereczki and Mónika Herege.
Last but not least, I am most grateful to my Mother and Father, Zsófi, my sister and my grandparents for the love, support, and also for the roots of all the inspiration that ultimately brought me here. I am also thankful to my family and friends for keeping my chin up in hard times, and all the good times we had together through the years.
Thank you!
Contents
Acknowledgements ... i
1 Preface ... 1
2 Introduction ... 3
2.1 Attention and stimulus encoding in the visual system ... 3
2.2 Alpha oscillations: from idling through inhibition to active processing ... 7
2.3 Goals ... 13
2.4 Methods ... 15
3 Alpha oscillations in object-based attentional selection ... 20
3.1 Introduction ... 20
3.2 Materials and methods ... 21
3.2.1 Subjects ... 21
3.2.2 Stimuli and procedure ... 22
3.2.3 Electrophysiological data acquisition and processing ... 23
3.2.4 Statistical Analysis ... 24
3.2.5 Eye tracking data acquisition and analysis ... 25
3.3 Results ... 26
3.3.1 Behavior ... 26
3.3.2 Electrophysiology ... 27
3.3.3 Fixation stability ... 30
3.4 Discussion ... 31
4 Cortical mechanisms of visual expertise in word recognition ... 35
4.1 Introduction ... 35
4.2 Methods ... 40
4.2.1 Participants ... 40
4.2.2 Visual stimuli and experimental procedure ... 40
4.2.3 Recordings ... 41
4.2.4 Data analysis ... 42
4.3 Results ... 44
4.3.1 Event-related potentials ... 44
4.3.2 Parieto-occipital alpha oscillations ... 46
4.4 Discussion ... 48
5 Conclusions and future directions ... 54
6 Summary of the Theses ... 59
6.1 Thesis I. ... 59
6.2 Thesis II. ... 61
7 Bibliography ... 64
7.1 The author’s publications ... 64
7.1.1 Journal publications ... 64
7.1.2 Additional journal publication ... 64
7.1.3 Selected conference publications ... 64
7.2 References ... 65
1
1 Preface
In 1924, Hans Berger, driven by his search for the “psychic energy” of the brain [1], put together a machine called “electroencephalograph”, and managed to measure for the first time electric activity arising from the brain through the skull [2]. What he saw was a wavy activity pattern, roughly sinusoid of shape, waxing and waning, repeating itself cca. 10 times every second. After him, it is sometimes called “the Berger rhythm”, but these wave patterns today are more well-known as alpha waves, due to their primacy in the family of brain oscillations.
Figure 1.1 The electroencephalogram of man, as measured by Hans Berger in 1924.
The top trace is the EEG, the bottom trace is a reference waveform with a frequency of 10 Hz. From [2], image enhanced using Microsoft Word.
Berger did not know back then how lucky he was. It is arguably not always the case in science, but the importance of these waves that he discovered was inherently related to the mere fact that he could actually measure them. In order for neuroelectric activity to be measurable from outside the skull, two main prerequisites should be met: the spatial alignment of the electric fields and the temporal (in-phase) synchrony of their fluctuations. The spatial alignment requirement is met due to the organization of cortical tissue: the somatodendritic axes of cortical neurons – especially pyramidal cells – are perpendicular to the surface of the cortex, and the fields arising from their postsynaptic potentials (and possible other potentials, see e.g. [3]) are thus aligned appropriately to be summated into a field potential that also reaches the scalp surface. The temporal synchrony prerequisite is more interesting, because synchronization of the activity of neurons arguably requires some kind of communication between them. Of course, synchrony can arise through simple physical interactions [4], but in the last decades it has become clear that neural oscillations and their patterns of synchronization are the main governing principles of the temporal organization of information processing and communication in the brain [1, 5]. That is, oscillations in the EEG, including those in the alpha band, are not epiphenomenal fluctuations that we can measure due to their large amplitude, but they are inherently meaningful and important.
2
Ironically, though, since their discovery alpha oscillations have become a nuisance for a lot of researchers, as they had become preoccupied with another kind of synchrony: synchrony with sensory events. As measurement technology has become more advanced, EEG activity waveforms that are synchronized to external events, i.e. event-related potentials (ERPs), have become easier to measure and quantify, and alpha activity that is not time-locked to stimulation was mostly averaged out or was regarded as background noise, a sign of “idling”. Methodology that enables the efficient characterization of the diverse oscillatory signals that can be acquired by M/EEG have only become available with the advent of microcomputers (see e.g. [6]). By today, alpha activity, and oscillations in general, have come back to the focus of research: a regimen of methods to quantify oscillatory signals have become available [7], which also led to a huge body of experimental results and competing theories on the role and nature of alpha oscillations [8–13].
In this dissertation, I will first describe some principles of object encoding and attention in the visual system, then will continue with summarizing our current knowledge on the role of alpha oscillations in sensory processing and attention. Then, I will present original research that provides novel insight about how alpha oscillations contribute to visual attention and visual expertise in the case of complex natural objects.
3
2 Introduction
2.1 Attention and stimulus encoding in the visual system
The brain consists of approximately 100 billion neurons, with an estimated number of 200 trillion synapses between them [1]. Synapses, the elaborate structures of the dendrites and soma can all be regarded as minute biophysical computing units, which, working together, constitute the enormous computing power of the brain. However, to achieve adaptive behavior, the brain faces the daunting task of extracting the behaviorally relevant portion from the enormous amount of complex and structured, but also uncertain information available in the environment, which also has to be done within a limited time. With this in mind, considering brain functions as resource allocation problems is an important perspective.
Visual attention is the strategy to tackle this resource allocation problem in the case of visual perception [14–17]. It is clear that instantaneous and full analysis of a complex visual scene is not feasible, as demonstrated by everyday experiences like looking for a key on a cluttered table or a face in a crowd. This practically means that visual stimuli will compete for the representational resources of the brain, and this competition can manifest on multiple levels from visual analysis to motor output [14]. Focusing on the ventral visual stream, the chain of areas responsible for detailed shape representations and visual object recognition, receptive fields can be considered the scarce resource that stimuli compete for. Receptive fields are small and respond to simple visual features at the input stage of the ventral stream (V1), and become progressively larger and have more and more complex response properties in higher-level areas, up to the extreme of ventral temporal cortical areas representing complex natural objects like faces [18], body parts [19], animals, everyday objects or visual words [20] with spatial receptive fields that cover a large portion of the visual field (~20-25°, [14]). The key idea is that if multiple objects are present in a receptive field (which is quite probable in the case of the aforementioned large receptive fields in the ventral temporal cortex), then the processing resources available should be divided between them.
Attention, according to the biased competition theory, can resolve this competition by suppressing the processing of irrelevant stimuli, freeing up representational resources for the attended stimulus almost to a degree as if the irrelevant stimulus was not even there.
4
Both these competitive interactions and the way attention can resolve them are well captured by the more general neurocomputational principle of response normalization, which states that responses in the cortex (on multiple levels of its organization) are normalized so that overall activity across a neural population (the normalization pool) remains constant [21, 22]. This mechanism can ensure that cortical activity has an upper bound, avoiding pathological overactivation, while also optimizing the dynamic range of neural coding [21, 22]. It appears that lateral inhibitory connections have a prominent role in normalization and biased competition, but there is more and more evidence that feedback pathways also influence the process [23, 24].
Another aspect of optimal resource allocation concerns the representations (or “filters”) that the cells in the visual cortical hierarchy implement. The organization of the visual system is governed by information theoretic principles. In particular, it realizes the representational structure that is most energy efficient and adaptive given the statistical structure of the visual environment. For example, the Gabor-like receptive fields of V1 can be acquired by a computational approach applied to a large set of natural images, trying to find a basis set (“receptive fields”) that is maximally sparse (i.e., the representation of the most probably occurring images requires the least number of representational elements to be active) [25, 26].
In a slightly different formulation, the visual system (or the whole brain [27]) attempts to predict the input patterns by trying to infer the underlying cascade of hidden causes that might have created them, thereby construing itself as a generative model of the environment [28]. These models have compelling explanatory power both theoretically and practically. They apply not only to the structure of the visual system, but also its functioning and plasticity: perceiving a stimulus entails inverting this generative model as neural activity cascades up the visual hierarchy, and also modifying model parameters as manifested in the plasticity phenomena of the visual system such as perceptual learning and the formation visual expertise.
Most importantly to the subject of this dissertation, predictive coding models highlight the importance of feedback connections in the visual cortical hierarchy [29, 30]. In order for hierarchical generative models to work, each level of the hierarchy should pass a prediction to the lower level.
According to the predictive coding account of the visual system, this occurs through feedback connections. In turn, the lower level should return a prediction error, which in the visual system corresponds to feedforward connections. Based on this prediction error, the parameters on the higher level are updated so that future prediction errors would decrease, and this logic applied iteratively
5
throughout the whole hierarchy until convergence gives rise to perception and stimulus representations that are optimal in the sense laid out above. Recent research has led to important insights regarding how these principles are realized in the physiological mechanisms underlying attention and object perception, to which we return later in this section.
Several characteristics of the higher level visual system also emerge if we consider the consequences of these principles. Probably the primary parameter to describe a visual stimulus is its category – for example, human faces, buildings or visual words clearly have highly distinct “underlying causes” (basic visual components and organization) and also different implications for adaptive behavior. Reflecting these inherent discrete classes of stimuli in the visual world, the highest levels of the visual hierarchy have a modular organization, with distinct areas encoding frequently occurring and/or behaviorally relevant visual categories. For example, high-level encoding of face stimuli (supported by a broader network of visual areas) involves a circumscribed area in the ventral temporal cortex, called Fusiform Face Area (FFA) [18], while there is another region called Visual Word Form Area (VWFA) specifically involved in the processing of printed words [20, 31]. These two categories and their respective brain networks are probably among the most researched model systems in the research of object perception. The development of these areas probably builds on some innate liabilities and, relatedly, more abstract gradients in the representational space of potential high-level objects[32, 33], but experience and the acquisition of visual expertise is arguably highly important in this process.
Considering exemplars within one category, predictive coding models posit that the most probable (or frequent) ones will be recognized most effectively: after stimulus category is recognized, these stimuli will match the “first guesses”, or a priori predictions of the system, which means that the feedback loops described above will converge faster. This is in accordance with the norm-based encoding scheme faces are thought to be represented in the visual system [34, 35]. At the expense of being fast for the more frequent ones, perceiving rare, peculiar exemplars or ones presented in unusual circumstances or orientations can be substantially slower. These phenomena are used in the research of visual expertise: for example, for faces presented upside-down, both electrophysiological and behavioral responses are slower [36–38], and also, visual expertise for text during reading makes us less effective unusual formats or reading conditions [39].
Besides and despite this specialization, it is also remarkable how robust object recognition can be.
For example, partially occluded or noisy images of objects can still be recognized [40, 41]. As a
6
consequence of the coding strategies laid out above, signals that match the representational dictionary of the visual system will be amplified, and in turn, those that are orthogonal to them will be suppressed. Thus, in the case of noisy or partial input, the system will perform pattern completion and converge to the closest potential interpretation of the input. An example from daily experience for this is pareidolia, our liability to see, for example, faces on household objects or on the surface of Mars. A more extreme example is the notion that sensory deprivation can induce hallucinations, which is potentially related to the overactivation of top-down predictions due to the lack of bottom- up input [42, 43]. In a condition called Charles Bonnet syndrome, a surprisingly large number (10- 20%) of psychologically normal visually impaired people (e.g. elderly people suffering from macular degeneration) experience complex, vivid hallucinations, especially during time periods of relative inactivity [44–46].
To sum up, the brain makes use of its limited representational resources both through learning robust optimal stimulus encoding strategies especially for frequent specimens of behaviorally important stimulus categories, and also by attention that boosts behaviorally relevant stimulus representations among concurrently present competitor stimuli.
7
2.2 Alpha oscillations: from idling through inhibition to active processing
The first functional property of alpha oscillations was the so-called alpha blocking response, which was demonstrated already by Berger [2] and later confirmed by Adrian and Matthews [47]. Alpha blocking is the reduced amplitude of alpha oscillations upon the opening of the eyes, compared to large-amplitude alpha waves in the baseline, eyes-closed state. On the simple premise of associating higher alpha activity with the lack of input, one could infer that alpha oscillations could indicate a resting or idling state of the cortex. In the second half of the XX. century, when efficient and cheap computing and also multielectrode scalp measurements have become more and more available, research on alpha oscillations continued to expand from this starting point. Based on these measurements, it was established that the blocking response related to the opening of the eyes, which is measured best over the posterior scalp and originates from the visual cortex, is generalizable to other cortical areas and other functions: alpha power decreases in the visual cortex upon visual stimulation (light flashes with closed eyes, compared to pre-stimulation), drops in the auditory cortex during auditory stimulation and also over motor areas preceding movement [48].
This disappearance of oscillatory activity was named event-related desynchronization, abbreviated as ERD, and is interpreted as active processing in a local patch of the cortex that is concerned with the function investigated [6, 48].
Thus, areas which are task-relevant produce alpha ERD. Areas that are irrelevant to the task at hand remain idle, as indicated by alpha amplitude staying on high levels – or even increasing compared to baseline, which is termed event-related synchronization (ERS). ERS is observed, for example, over motor areas in a visual task, and over visual areas and non-engaged motor areas preceding and during voluntary movement onset [49, 50]. Following desynchronization, a rebound power increase is also often observed, which can surpass baseline levels [49] – this is sometimes called re- synchronization. (It should be noted that in the first 300 ms after stimulation a short phasic increase in spectral power is often present, but this corresponds to the evoked response that is phase-locked to stimulus onset, while the modulations described above are all changes in the strength of ongoing
“background” oscillations due to stimulation, which are not phase-locked to the stimulus; i.e., they are induced power modulations.)
8
Importantly, alpha ERD and ERS are not restricted to the domain of sensory stimulus processing and motor processes, and it is clear that even stimulus-induced alpha responses are profoundly influenced by top-down processes [10]. For example, in working memory (WM) tasks – in accordance with the previously mentioned results – encoding, and also the retrieval of the memory items is associated with alpha ERD. Based on the idling hypothesis, one would expect that the maintenance of sensory information in memory would also be accompanied by an ERD, but Klimesch and colleagues [51] observed that, especially if subjects have to avoid the intrusion of memory items from previous trials, i.e. high interference, alpha oscillations displayed ERS in the memory maintenance period. This, and various other results, has led to the hypothesis that ERS does not simply reflect a passive baseline state of idleness, but active, top-down inhibition [8].
How alpha oscillations are related to top-down processes most profoundly appears in the field of attention research. In particular, the alpha ERD in the cortical area corresponding to the task- relevant modality (e.g. auditory vs. visual) has been shown to occur before the stimulus, as far as the subject knows which kind of stimulation to expect [52]. The same was demonstrated within the visual modality first for the deployment of attention to either visual hemifield, that is, after a cue that indicated that a target stimulus would appear e.g. in the left visual hemifield, alpha power decreased over the visual cortex in the right hemisphere, while it increased in the left hemisphere [53]. This result has been replicated (and extended) in a huge variety of experiments. For example, it has been shown that this ERD/ERS patterning can be used to track the retinotopic locus of spatial attention beyond the binary distinction of visual hemifields with remarkable accuracy [54].
Importantly, several of these experiments specifically addressed the issue of ERS being a process related to active suppression rather than the return of baseline excitability state (e.g. [54, 55]). Only a few studies have attempted to show whether and how the suppressive role of alpha oscillations extends to non-spatial varieties of attention. Snyder and Foxe [56] have shown that attending to the color or motion direction of a moving dot field modulates alpha oscillations in the dorsal and ventral aspects of the visual system in a way that is compatible with the suppression account. More recent results indicated that the temporal dynamics of covert spatial orienting [57] and temporal expectation [58] is also closely tracked by alpha oscillations. To conclude, a huge body of research demonstrates that the inhibition account has a compelling explanatory power, especially in the case of visuospatial attention.
9
Despite all this, it has also become clear that the relation between alpha activity and inhibition is far from general, and unfortunately, the exact boundary conditions of when an alpha power modulation measured on the scalp might indicate inhibition or suppression are only subject to speculations.
Palva and Palva [11], for example, argue for the active role of alpha oscillations in general, including the working memory scenario (ERS depending on load and interference) from which the inhibition account was derived [51]. As mentioned above, WM-related ERS is interpreted in the inhibition framework as suppression of competing representations, for example those lingering from the previous trial. In contrast, the active processing account posits that alpha oscillatory network spanning the sensory and frontoparietal cortices actively organizes neural activity in a way that is essential for the maintenance of the representations of the memory items [11]. This function of alpha oscillations – and low-frequency oscillations in general – arises from the physiological mechanisms that cause the primary information processing activity of neurons – spiking – to occur at preferred phases of oscillations [59]. The timing of spikes is essential for coordinated neural computing, therefore neural oscillations are the primary organizers of brainwide dynamic neural ensembles that make complex computations underlying adaptive perception and behavior possible [1, 5, 60]. The updated version of the inhibition hypothesis, the inhibition-timing hypothesis [8] also takes this into account as a possible mechanism of selective inhibition.
Recent research has provided evidence for a computationally and neurophysiologically circumscribed role for alpha oscillations in the networks of attentional and visual areas. Buschman and Miller [61] demonstrated in macaques that the flow of information dominantly occurs in the gamma band from parietal to frontal areas during bottom-up, stimulus-driven attention, while beta oscillations convey top-down information in the direction of frontal areas from the parietal cortex.
In the visual cortical hierarchy, in supragranular layers where feedforward connections originate gamma oscillations are most common, while infragranular layers send feedback connections to lower areas and produce alpha/beta oscillations [62–64]. These observations suggest that alpha/beta and gamma oscillations would be the preferred channels for feedback and feedforward communication in the visual hierarchy, respectively. This hypothesis was tested and validated in the macaque using invasive recordings [65, 66], and also in humans using MEG [67]. These findings have profound implications on the interpretation of noninvasive recordings from human subjects.
10
To sum up, the different theories debate how the amplitude and phase dynamics of alpha oscillations affect cortical circuits. Also, other frequencies on the spectrum could be also interesting targets for investigating the neural processes of visual object perception and attention (Box 2.1). However, they do agree that alpha oscillations mark an essential component of brain function, being a main orchestrator of coordinated activity that provides the neurocomputational background for fundamental aspects of the human mind such as attention and consciousness [8, 9, 11], and therefore the alpha band is a good candidate to focus our analyses on.
Box 2.1 The oscillatory architecture of the brain
This dissertation focuses on alpha oscillations, which are usually the largest amplitude oscillations in the human brain. Of course, it is impossible to adjudicate between frequency bands, as they are equally important in forming the oscillatory architecture of the brain. Our hypotheses were nevertheless focused on alpha oscillations because they are especially prominent in the visual system which is the main subject of this work, and are frequently implicated in attentional processes. In order to be a little more comprehensive, here I promptly traverse the whole spectrum, also mentioning some possible connections to the attention and object perception. Note that the boundaries of the frequency bands are somewhat arbitrary, and may vary between individuals, species, arousal levels or cortical states.
The beta frequency band, ranging from around 12-15 Hz up to 30 Hz is the closest relative of the alpha band. Attentional effects are frequently found to extend up into the beta band, and beta also appears equally important as alpha as a channel for feedback communication in the visual hierarchy [1]. Beta oscillations are most prominent in sensorimotor cortices, their desynchronization response is observable there in preparation for limb movements [2]. Frontal beta activity is theorized to be related to reward and motivational factors [3–5]. A general theory suggests that beta-band activity might be related to the maintenance of the current sensorimotor set, or signalling the status quo [6]. Theta-band (4 Hz to 7-8 Hz) activity frequently modulates the phase and amplitude of higher frequency oscillations [7–9]. It is the most dominant frequency band in visual evoked responses. Theta oscillations most dominate the frontal cortex, especially its medial part, and the hippocampus [10]. Frontal theta is found to be important in cognitive control, conflict and error monitoring [11, 12], while hippocampal theta is implicated in long term memory and navigation [13]. The Delta band (<3 Hz) is most prevalent during sleep, and
11
is also involved in motivation-related processes and error monitoring [14, 15]. Gamma-band activity (>30-40 Hz), among LFP and EEG signals, is thought to most closely reflect neural activity, especially in the high gamma band (>100 Hz), which is directly related to multiunit activity [16]. Accordingly, unlike lower frequency oscillations, the attentional modulation of gamma activity can mostly be interpreted as an index of changing intensity of neural activity (e.g., [17]). Relatedly, the gamma band is the main frequency of feedforward communication in the visual system [18].
Also importantly, the present work focuses on the scalp-measured oscillatory power, which reflects locally synchronous neural activity in the brain. However, the phase of the oscillations is also important, and can have different functional relevance if measured relative to, a stimulus, the phase at the same frequency at a different cortical location, or the phase at a different frequency at the same or another location. As mentioned above, amplitude can be also modulated by the phase of another oscillation. Also, some researchers propose that there are other parameters that can be used to characterize oscillatory activity in the brain that might have great physiological relevance, like the slope of the power spectrum [19], or the nonsinusoid features the oscillations display [20, 21]. So, it is clear that focusing on alpha power is looking at a small slice of the potential hypothesis space that the analysis of brain oscillatory activity offers.
References
[1] G. Michalareas, J. Vezoli, S. van Pelt, J.-M. Schoffelen, H. Kennedy, and P. Fries, “Alpha-Beta and Gamma Rhythms Subserve Feedback and Feedforward Influences among Human Visual Cortical Areas,” Neuron, vol. 89, no. 2, pp. 384–397, Jan. 2016.;
[2] G. Pfurtscheller and F. H. Lopes da Silva, “Event-related EEG/MEG synchronization and desynchronization: basic principles,”
Clin. Neurophysiol., vol. 110, no. 11, pp. 1842–1857, Nov. 1999.
[3] J. Marco-Pallares, D. Cucurell, T. Cunillera, R. García, A. Andrés-Pueyo, T. F. Münte, and A. Rodríguez-Fornells, “Human oscillatory activity associated to reward processing in a gambling task,” Neuropsychologia, vol. 46, no. 1, pp. 241–248, Jan. 2008.
[4] M. X. Cohen, C. E. Elger, and C. Ranganath, “Reward expectation modulates feedback-related negativity and EEG spectra,”
NeuroImage, vol. 35, no. 2, pp. 968–978, Apr. 2007.
[5] N. Doñamayor, M. A. Schoenfeld, and T. F. Münte, “Magneto- and electroencephalographic manifestations of reward anticipation and delivery,” NeuroImage, vol. 62, no. 1, pp. 17–29, Aug. 2012.
[6] A. K. Engel and P. Fries, “Beta-band oscillations—signalling the status quo?,” Curr. Opin. Neurobiol., vol. 20, no. 2, pp. 156–
165, 2010.
[7] R. T. Canolty, E. Edwards, S. S. Dalal, M. Soltani, S. S. Nagarajan, H. E. Kirsch, M. S. Berger, N. M. Barbaro, and R. T. Knight,
“High gamma power is phase-locked to theta oscillations in human neocortex,” science, vol. 313, no. 5793, pp. 1626–1628, 2006.
[8] J. E. Lisman and O. Jensen, “The theta-gamma neural code,” Neuron, vol. 77, no. 6, pp. 1002–1016, 2013.
[9] F. Roux and P. J. Uhlhaas, “Working memory and neural oscillations: alpha–gamma versus theta–gamma codes for distinct WM information?,” Trends Cogn. Sci., vol. 18, no. 1, pp. 16–25, Jan. 2014.
[10] S. Fujisawa and G. Buzsáki, “A 4 Hz Oscillation Adaptively Synchronizes Prefrontal, VTA, and Hippocampal Activities,”
Neuron, vol. 72, no. 1, pp. 153–165, Oct. 2011.
12
[11] J. F. Cavanagh and M. J. Frank, “Frontal theta as a mechanism for cognitive control,” Trends Cogn. Sci., vol. 18, no. 8, pp.
414–421, Aug. 2014.
[12] J. F. Cavanagh, L. Zambrano-Vazquez, and J. J. B. Allen, “Theta lingua franca: A common mid-frontal substrate for action monitoring processes,” Psychophysiology, vol. 49, no. 2, pp. 220–238, Feb. 2012.
[13] G. Buzsáki and E. I. Moser, “Memory, navigation and theta rhythm in the hippocampal-entorhinal system,” Nat. Neurosci., vol.
16, no. 2, pp. 130–138, 2013.
[14] M. Steriade, D. A. McCormick, and T. J. Sejnowski, “Thalamocortical oscillations in the sleeping and aroused brain,” Sci.-N.
Y. THEN Wash.-, vol. 262, pp. 679–679, 1993.
[15] G. G. Knyazev, “Motivation, emotion, and their inhibitory control mirrored in brain oscillations,” Neurosci. Biobehav. Rev., vol. 31, no. 3, pp. 377–395, 2007.
[16] G. Buzsáki, C. A. Anastassiou, and C. Koch, “The origin of extracellular fields and currents — EEG, ECoG, LFP and spikes,”
Nat. Rev. Neurosci., vol. 13, no. 6, pp. 407–420, Jun. 2012.
[17] D. Jokisch and O. Jensen, “Modulation of Gamma and Alpha Activity during a Working Memory Task Engaging the Dorsal or Ventral Stream,” J. Neurosci., vol. 27, no. 12, pp. 3244–3251, Mar. 2007.
[18] A. M. Bastos, J. Vezoli, C. A. Bosman, J.-M. Schoffelen, R. Oostenveld, J. R. Dowdall, P. De Weerd, H. Kennedy, and P. Fries,
“Visual Areas Exert Feedforward and Feedback Influences through Distinct Frequency Channels,” Neuron, vol. 85, no. 2, pp. 390–
401, Jan. 2015.
[19] R. D. Gao, E. J. Peterson, and B. Voytek, “Inferring synaptic excitation/inhibition balance from field potentials,” NeuroImage, pp. 70–78, 2017.
[20] S. R. Cole and B. Voytek, “Brain oscillations and the importance of waveform shape,” Trends Cogn. Sci., 2017.
[21] S. R. Cole, R. van der Meij, E. J. Peterson, C. de Hemptinne, P. A. Starr, and B. Voytek, “Nonsinusoidal beta oscillations reflect cortical pathophysiology in Parkinson’s disease,” J. Neurosci., vol. 37, no. 18, pp. 4830–4840, 2017.
13
2.3 Motivations and goals
In this dissertation, I venture to show two facets of how alpha oscillations constitute an important cornerstone in the neural machinery of visual object processing in humans. The two facets correspond to the two resource allocation problems laid out in the Introduction (Section 2.1): I.
Resolving instantaneous competition for computing resources by attention; II. Optimizing the use of neural resources by specialization to frequent and important stimuli by visual expertise. Two experiments were conducted under controlled fixation conditions, but were designed so that they would provide information on how the mechanisms in question would work in real-world vision:
operating on complex visual objects in dynamic spatiotemporal context.
Attention in everyday circumstances is quite different from how it is studied in the lab. Laboratory experiments mostly involve simple, artificial stimuli separated in both space and time, while in the wild, complex stimuli in dynamic, cluttered scenes are rapidly sampled by eye movements. This scenario requires dynamic object-based attention. Given the known role of alpha oscillations in spatial and feature-based attention, we hypothesized that they would similarly contribute to object-based attention. In the first experiment, this question was investigated using complex natural stimuli (words and faces) presented in spatial overlap (as in a cluttered natural scene) in relatively fast-paced sequences (mimicking temporal context during natural vision).
At first, both the hypothesis formation and the interpretation of the object-based attention experiment was mainly based on the inhibitory account of alpha oscillations that dominates most of the literature on attention. However, simply taking alpha oscillations as a signal of attentional inhibition did not perfectly align with every aspect of the results acquired, also in agreement with several lines of more recent research pointing to the more nuanced (and less straightforward) interpretations on the possible role of alpha activity in the visual system. This led to the following question: could we relate alpha oscillations to expert object processing in the visual system?
The role of alpha oscillations in expert object processing was investigated using visual words as model stimuli. Although the main perspective on reading and word recognition has arguably been from that of neurolinguistics, understanding the visual cortical processing of printed words, the interfacing and interactions of the visual system with higher level lexico-semantic subprocesses of reading is of hallmark importance. Studying visual word recognition by comparing neural responses to words with those evoked by pseudowords or other objects has been a fruitful approach, but subtle
14
manipulations affecting mainly the visual properties of text while leaving its content and overall
“legibility” relatively unaffected has remained an important, less traversed avenue in current research. The second study included in this dissertation takes this approach: letter spacing, a key configural property of words, was manipulated to probe the neural correlates of visual expertise for orthography.
The spatial context of natural reading was mimicked by displaying flanker words around the target word. In this case, no further measures were taken towards more ecological validity within this experiment. However, another experiment was also conducted, where participants read lines of text with the same spacing manipulation in a natural way, with freely moving eyes [J2]. This natural reading experiment is not included (but is shortly described) in this dissertation, but fixation- triggered responses from it will be compared to event-related potentials acquired in the present work, and the implications will be discussed to better assess how these mechanisms might be relevant during natural reading.
Understanding the visual cortical processes underlying reading and word recognition can also provide a deeper understanding of reading disorders like dyslexia.
The goals of the dissertation can be summarized as follows:
First, I will show that in accordance with its already established role in spatial attention, alpha oscillations are also at play when attention selects complex natural objects (faces and words) in cluttered visual scenes where relevant and irrelevant visual elements overlap in space.
Second, I will demonstrate on the case of printed word stimuli that the way the visual system optimizes its processing mechanisms to frequently encountered and/or important stimulus configurations – termed visual expertise – is also reflected in alpha oscillations. I will show how visual expertise molds the ERP responses as well, and relate the modulations to those observed during natural reading
Finally, I will discuss the practical and theoretical implications of the findings. I will attempt to interpret the results from the two experiments in a common framework, and will explore the potential overlaps between the cortical network mechanisms of the two investigated phenomena, and give some examples how these issues could be addressed in further experiments.
15
2.4 Methods
The present work is based on EEG experiments with visual stimulus presentation conducted on human participants. The results were analyzed in terms of Event-Related Potentials and neural oscillations as characterized by wavelet-based methods. Statistical methods involve conventional parametric tests and mass univariate tests using Monte Carlo methods for type I error control. The methods of each experiment are also described in the respective Methods sections, but here I provide an overview of the EEG and statistical methods used and discuss some general methodological considerations and their relevance to the current work in more detail.
As already hinted at in the Preface, scalp EEG measures temporally synchronous postsynaptic potentials that are thought to originate primarily from the principal pyramidal cells with dendrites perpendicular to the cortical surface [68], besides other sources [3]. As for instrumentation, an active electrode system was used (actiCAP, Brain Products, München, Germany) to measure EEG, which has higher signal-to-noise ratio owing to the preamplification circuitry in the sensors themselves [69]. These systems, in theory, permit high impedance recording, and owing to this, a 20 kΩ impedance threshold was used during the preparation of the first experiment. However, as we learned that some noise sources (low frequency noise from sweating in particular) are stronger in high impedance recordings even in the case of active electrode systems [69], we decided to use a lower impedance threshold of 5 kΩ during the preparation phase of our newer experiments (including the experiment in Chapter 4 of this work), matching more conventional thresholds applied with passive recording systems in the literature [70]. We decided to do so because a) the noise sources of question might become particularly stronger after longer periods of recording, and our experiments are usually long, b) reaching the lower impedances also does not take too much extra time relative to the whole experiment, especially as weighed against c) the potential benefits of lower impedance recording even in the case of active electrode systems [69]; and, finally d) studying non-sensitive neurotypical populations permitted us to do so. All other measurement parameters and general preprocessing methods were conventional in the field, and are described in detail in the Methods sections of the respective chapters.
Event-Related Potentials (ERP) are also analyzed [70], but the primary focus of this work is oscillatory activity in the alpha band. While ERP is only sensitive to activity that is phase-locked to the event of interest, frequency domain analyses permit the characterization of both the former (evoked) and also non-phase-locked (induced) signal components. Time-frequency representations
16
were obtained using wavelet convolution with complex Morlet wavelets [7] as implemented in the MATLAB Wavelet Toolbox. The wavelets applied were short (the bandwidth parameter was set to 1), which favors temporal resolution at the expense of frequency resolution. Although larger frequency resolution is favorable, for example, for characterizing oscillations in the lower and upper alpha subbands, in this research we were more interested in the temporal dynamics of the alpha modulations, and also, in the object based attention experiment, the interstimulus interval was short, and longer wavelets would have made our analysis more sensitive to evoked activity, while non phase-locked modulations were of primary interest.
While temporal resolution, as compared to fMRI, is usually listed as a benefit of using EEG for cognitive neuroscience, spatial resolution is arguably a shortcoming of it. Due to volume conduction, all the electrodes pick up signals from all points of the brain, and the boundaries of the different compartments of the skull also cause further spatial smearing in the signal [68, 70]. While a plethora of more and more sophisticated source imaging methods have become available in the last decades, most of them requires individual subject MRI, and larger electrode coverage is also advisable for their effective application. Therefore, we decided to use the surface Laplacian method (also known as Scalp Current Density or Current Source Density mapping). This method, with a few assumptions and simplifications about the structure of the skull, approximates the current flowing through the dura mater, i.e. estimates an underlying configuration of current sinks and sources for a given topographic potential distribution [68, 70–72]. Practically, this means that far- field signals are suppressed, and the current density estimate at each electrode will be more sensitive to neural activity in the cortical area directly below the sensor. The surface Laplacian has been shown to improve not only the spatial resolution of EEG, but also its sensitivity to genuine temporal differences [73].
Apart from standard paired t-tests and analysis of variance, this work makes use of mass univariate testing with type I error control by cluster-based permutation tests, as laid out in [74] and implemented in the FieldTrip MATLAB toolbox [75]. Permutation tests make no assumption about the distribution of the tested quantities as parametric tests do. Owing to this, and to the fact that a multitude of tests have to be performed, these tests are more powerful than simple parametric tests.
For permutation tests, the null hypothesis is that the conditions in the experiment are exchangeable with respect to the statistic tested. In the paired one-sample case, this is practically tested by calculating the same statistic multiple times so that the signs of the individual values are reversed at each iteration. This yields a null distribution to which the observed statistic is compared – if the
17
observed statistic is more extreme than the 95% of the null distribution, the null hypothesis of exchangeability is rejected.
In the case of multiple tests, for example when multiple time and/or frequency and/or channel samples should be tested, the problem of inflated type I errors ensues. One solution for this is clustering neighboring significant results together, and calculate a cluster statistic from the individual test values. For example, the t-values for neighboring significant test can be summed, which yields the cluster statistic. Calculating the cluster sum statistics in each permutation yields a null distribution of the cluster statistic in this case, and comparing to this null distribution achieves type I error control at the desired α level.
This framework is versatile, because the analysis pipeline can be adapted to specific questions at several points (, while keeping in mind the utterly important caveats [76, 77] ). Designing an analysis pipeline always entails arbitrating several tradeoffs. Similarly to other methods, one has to decide what hypotheses should actually be tested. In the group-level analyses conducted in this work, the original input data format was subjects × channels × time × conditions. (Oscillatory frequencies and arbitrary more dimensions could be taken into account analogously to methods described here.) The most straightforward way to analyze this is to conduct repeated measures ANOVAs with respect to the condition(s, with appropriate factor structure) at each channels × time data point, wherein neighborhood in channels × time space can be used to form clusters to correct for multiple comparisons. An important limitation during interpretation of the results is that it is fallacious to rely on the contours defined by the significant clusters acquired from analyses like this. Put differently, where the significance threshold is crossed in space or time provides no statistical support for inferences about where in space or when in time the effect in question occurred.
Alternatively, any set of linear combinations can be formed from the channels × time matrix to define a constrained hypothesis set, and these can be either tested in a mass univariate framework (where. again, a neighborhood structure can be defined). These linear combinations can correspond to, for instance, channel averaged (pooled) time series, or average topographic distributions in time windows – this corresponds to a conventional Region of Interest (ROI) analysis. As another option, the linear combinations can entail contrasts. With appropriately defined contrasts, specific hypotheses about response patterns within the channels × time matrix (and their interactions with experimental conditions) can be tested (e.g. lateralization or temporal fluctuation) – this step can be also regarded as conducting a repeated measures (factorial) ANOVA on spatiotemporal regions of
18
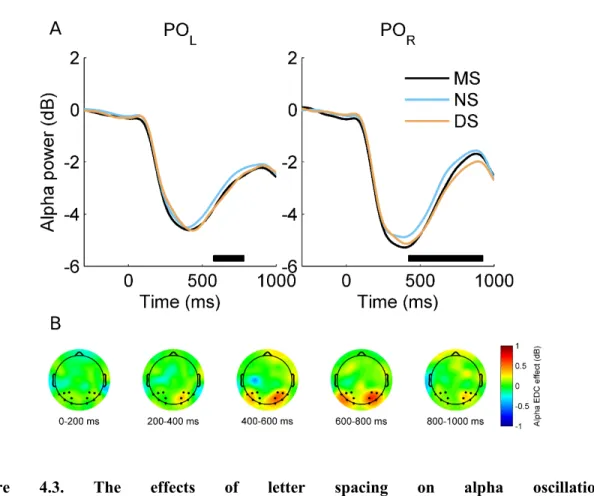
interest. For example, (as also described in Section 4.2.4,) the second study in this work focused on parieto-occipital alpha oscillations, hence spatial ROIs (electrode pools) were formed bilaterally.
Lateralization of effects were also of interest, thus a lateralization contrast was added to the spatial ROI set. Multiple tests were conducted along the temporal and the newly derived 3-element spatial dimension; temporally adjacent samples and data from the left and right electrode pools were considered neighboring, but the lateralization contrast was considered to be isolated during clustering.
Quite obviously, the more a priori constraints are imposed on the hypothesis set, the more sensitive the analysis will become for the hypothesized effect, but, in turn, it will become less sensitive or even blind to other effects. A little less obviously, even if a highly focused ROI analysis is conducted, it is not only possible but also highly advisable to “take a step back” to observe and appraise the broader context of the effect during interpretation, potentially including also that part of the data that is not covered at all by the statistical analysis [78]. Continuing the above example, Figure 4.3A displays the results of the statistical analysis that was conducted (showing significant effects on the time series of the two electrode pools, corrected for multiple testing). In addition, Figure 4.3B shows the effect on all the 64 electrodes separately as topographic distributions, to show that the effect actually conformed to our expectations, and displays a physiologically plausible topography.
As implied above, not forming ROIs but testing on each electrode leaves the stage open for arbitrary possible effects, but at the cost of reduced sensitivity. In an ideal case, this could be mitigated by defining a ROI on an independent dataset. However, data collection is usually costly, so alternative strategies are desirable, for example, under certain boundary conditions, ROIs can be defined using contrasts that are orthogonal to the effect under investigation [79, 80]. An essential prerequisite for such strategies is that they should not increase the Type I error rate – any circularity easily leads to serious Type I error inflation and consequently, false results.
In the first study described in this dissertation, a two-step analysis pipeline was used that included such a ROI definition step. The initial hypotheses to be tested were not constrained along the spatial dimension, but temporal windows of interest were defined, so multiple tests were conducted on all the channels and in each of the five time windows. The ROIs for the next analysis step are defined so that channels are selected where the number of significant time windows for the current main effect of interest are largest, and their contralateral pairs are also selected. From the resulting
19
symmetrical channel sets, one pool is defined for each hemisphere. The second step involves space (hemisphere factor: left and right) and time (sequence factor: 5 time windows of interest) as repeated measures factors in an ANOVA, and the interactions of these factors with the current main effects of interest are tested. For example, the effect of category (face vs. word) was tested on all channels in each time window separately (64×5=320 tests), with cluster-based correction. Then, a bilateral pool was defined based on this, using which the category × hemisphere, category × sequence and category × hemisphere × sequence interactions were assessed (, but not the main effect of category).
The important point to note is that the effects tested at the second step correspond to dimensions along which multiple tests were conducted independently in the first step, (and also, no effect tested at the first step is probed again in the second,) and this rule avoids circularity and type I error inflation. This intuition was tested using Monte Carlo methods. For simplicity, the data of one time window (S6) was extracted from the attentional experiment, and the above analysis was conducted with only the hemisphere factor in the second step. Using permutation of the two conditions, null data was generated (N=9999), and the same two-step pipeline was run on all the 9999 permuted datasets. From this, the empirical type I error rate was estimated: αMC=0.049, 95% CI: [0.045 0.053].
This supports that the two-step procedure used in the first study does not inflate the false alarm rate of the analysis. Here, if we consider again the limitation in the interpretation of mass univariate results on spatiotemporal data – that the spatiotemporal significance patterns are not significant spatiotemporal patterns – it appears that this strategy can be a good step to remedy this problem as well.
In summary, the two studies in this dissertation used conventional EEG methods with regard to recording and preprocessing, while the logic of statistical inference required more consideration.
Being aware of the several methodological problems that surfaced in the last decade in the field of psychology and neuroscience (e.g. [77, 81–84]), the need for statistical methods to be both powerful and strictly valid was always considered a priority during this work.
20
3 Alpha oscillations in object-based attentional selection
3.1 Introduction
A remarkable ability of the visual system is that it can deal with the clutter of visual objects in our environment. Given its limited processing capacity, this can only be achieved via attentional selection, that is, assigning priorities to parts of visual information that are relevant according to behavioral goals [14]. In neurophysiological terms, this implies that neural processes related to high- priority visual information – attended regions of space, features or objects – should be facilitated [85–87]. Conversely, it can be advantageous to suppress the neural representation of irrelevant items (distractors) [88–91]. These inhibitory processes are especially important for efficient attentional selection when several objects are simultaneously present, which frequently occurs during everyday visual experience [92, 93].
A prominent neural signature of attentional distractor suppression is enhanced oscillatory activity in the alpha frequency band [8, 12, 13], which can be measured in human subjects non-invasively by means of electroencephalography (EEG). It is well-established that during spatial attentional tasks, the representation of the unattended visual space is inhibited through enhanced alpha activity in the corresponding parts of the visual cortex [53–55, 94, 95]. More recently, it has been shown that this generalizes to feature-based attention: Snyder and Foxe [56] demonstrated that anticipatory alpha band power increases can be localized more ventrally when the motion of the presented dot field was task-relevant, as compared to more dorsal sources when attending the color of the same dots.
However, when the visual system is faced with the visual clutter of multiple objects, the units of attentional selection are whole objects [96]. On what level of the visual hierarchy object-based selection operates is an outstanding question in recent research. The findings thus far support the assumption that, besides well-established modulations in category-specific areas in the ventral temporal cortex, object-based attention relies on top-down feedback signals biasing the activity of earlier visual areas based on high-level object knowledge [97–99]. However, whether inhibitory
21
processes involving alpha oscillations are invoked in object-based attentional selection remains an important unresolved question.
To address this question, we designed a paradigm using word, face and composite word-face stimuli. In each trial, either the word or the face component was cued to be attended, the other being task-irrelevant. To maximize the engagement of object-based selection mechanisms and to minimize the involvement of spatial attention, all stimuli were presented foveally at the same location – that is, words were overlaid on faces in the case of composite stimuli. Words and faces are suitable to probe object-based attention because of the well-known, pronounced lateralization of their processing: category-selective neural activity dominantly takes place in the right and left hemisphere in the case of faces and words, respectively [18, 100]. Based on this, we predicted that object-based attention to either category in a compound word-face display will modulate the hemispheric lateralization of visual cortical alpha oscillations. In particular, attending to faces will lead to increased alpha power in the left hemisphere, which is dominantly involved in the processing of word stimuli, whereas attending to words will increase alpha power in the right hemisphere, which is dominant in face processing. We tested these predictions in the case of sustained object- based attentional selection of face or word stimuli, presented sequentially (six stimuli, each presented for 683 ms) within a trial.
3.2 Materials and methods
3.2.1 Subjects
Twenty healthy young adults participated in this study. All of them had normal or corrected-to- normal vision; none of them had any history of neurological or psychiatric diseases. All participants gave their informed consent prior to starting the experiment, the procedures of which were approved by the Ethical Committee of the Budapest University of Technology and Economics. The data of three participants was discarded because of excessively noisy EEG recordings (less than 50% of the segments were clean, mean±SEM for retained subjects: 77±3%), and one subject was discarded because of lack of response in more than 15% of the trials (mean±SEM for retained subjects:
3±0.7%). So, the data from 16 subjects was analyzed (9 female, mean±SEM age: 21.4±0.3 years).
22
3.2.2 Stimuli and procedure
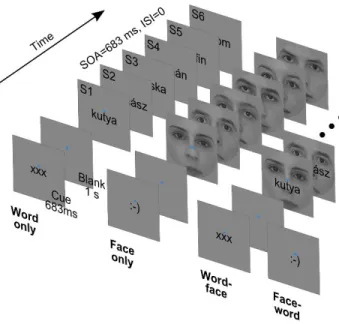
In the experiment, participants viewed short sequences of word, face and composite word-face stimuli while performing a one-back task (Fig. 3.1).
Face images were front-view grayscale photographs of 13 male and 13 female faces. The 2°×2°
square images were cropped with a circular mask with a diameter of 2° to eliminate external facial features and equated for contrast and luminance. Word stimuli were 26 Hungarian nouns (from two semantic categories: 13 fruits and 13 animals) rendered in black using a 12 point Arial font (maximal vertical extent: 0.4°). Words were 5-7 characters long, corresponding to widths falling between 0.9 to 1.5 degrees of visual angle. From the above, composite stimuli were created by overlaying words centrally on face images (Fig. 3.1, right). All of the stimuli were presented at the center of the screen, slightly (0.2°) above which a blue fixation disc with a diameter of 0.1° was always present. The background was mid-grey, matching the mean luminance of face images.
Figure 3.1 Schematic of the four trial types corresponding to the four experimental conditions.
Each trial consisted of a Cue (at the bottom) and a sequence of six stimuli (top). These trial types followed each other in randomized order during the experiment.
SOA: Stimulus Onset Asynchrony. ISI: Interstimulus Interval.
Trials started with a cue displayed for 683 ms, which was either of the strings ’xxx’ or ’:-)’ rendered in the format and position described above. The cue was followed by a blank interval of 1 s, when
23
only the fixation disc was present. Then, six stimuli of one type (word, face or composite) were presented consecutively. Each stimulus was displayed for 683 ms, immediately followed by the next one – there was no interstimulus interval. The intertrial interval, from the offset of the last stimulus to the onset of the next cue, was 2 seconds long.
Subjects had to deploy their attention and perform the task with respect to either words or faces, as indicated by the cue at the beginning of each trial – ’xxx’ and ’:-)’ referring to words and faces, respectively. For each subject, 240 attend-word and 240 attend-face trials were presented in randomized order. In both cases, for a 50% random subset of the trials (120 for attend-word and 120 for attend-face), compound stimuli were used, the non-attended stimulus serving as a distractor. In the remaining trials, only the relevant stimulus was displayed. Thus, there were four experimental conditions (Fig. 3.1): attend-word distractor-absent (word only), attend-word distractor-present (word-face), attend-face distractor-absent (face only) and attend-face distractor-present (face-word).
In one third of trials, the sub-category (male vs. female faces, animal vs. fruit words) was alternating throughout the stimulus sequence. In the remaining two thirds of trials, one or two one-back repetitions of stimulus sub-category occurred. The task of the participants was to count these one- back events and indicate how much of them they saw with a three-button mouse after each trial, during the intertrial interval. (For example, a ‘male-female-male-female-male-female’ sequence would count as no (zero) one-back repetition, ‘fruit-animal-fruit-fruit-animal-fruit’ would count as one repetition, and so on.) This task was designed to sustain the attentional state of subjects throughout the whole trial as much as possible.
Each subject completed 480 trials in 10 runs, leading to 120 trials per condition. Stimuli were presented on a 26” LG LCD monitor at a refresh rate of 60Hz, viewing distance was 56 cm. Stimulus presentation and subject response registration was implemented in MATLAB 7.1 (The Mathworks Inc., Natick, MA) using PsychToolbox 3 [101, 102].
3.2.3 Electrophysiological data acquisition and processing
EEG was acquired using BrainAmp MR amplifiers and an actiCAP system with 62 active electrodes (Brain Products, Munich, Germany) mounted on an elastic cap according to the 10/10 system. An additional lower vertical EOG electrode was placed below the right eye. All channels were
24
referenced to the right mastoid (TP10), the ground was at electrode position AFz. Impedances were kept below 20 kΩ. The sampling rate of EEG was 500 Hz.
Preprocessing and data analysis was done in Brain Vision Analyzer (Brain Products, Munich, Germany) and MATLAB (The Mathworks Inc., Natick, MA) using functions from EEGLAB [103]
and custom scripts. The signal was bandpass filtered (Butterworth zero-phase filter in Analyzer, 0.1Hz-70Hz, 24 dB/octave). Trial segments containing artefacts were marked using amplitude ([- 100 100] µV), amplitude difference (160 µV) and voltage step thresholds (20 µV per sample) and by visual inspection; these segments were not used in further analyses. Surface Laplacian approximation of the scalp current density (SCD) was calculated using the CSD Toolbox [71, 72]
(spline flexibility m=4, λ=10-5). SCD-transformed data is reference-free, and is less affected by volume conduction [68]. Modulations of alpha oscillations was of particular interest in this study, so whole-trial segments were wavelet transformed using a complex Morlet wavelet (MATLAB cwt function, ‘cmor1-1’ wavelet) with center frequencies 8 to 12 Hz with 0.5 Hz steps. Afterwards, mean log power time series were computed for segments time-locked to each stimulus onset, averaging over trials and frequency bins.
3.2.4 Statistical analysis
To investigate the modulation of anticipatory alpha oscillations during the stimulus train, mean prestimulus alpha power was extracted from [-50 -200] ms time windows before each stimulus onset from S2 to S6. This window was chosen to minimize the influence of both the previous and the next evoked response, focusing on induced modulations. The main effects of category (attend word vs.
attend face), distractor (absent vs. present) and their interaction were first assessed over the whole scalp using cluster-based permutation tests (cluster-forming threshold p=0.05, 999 permutations, adjacent stimulus windows and electrodes in less than 5 cm distance were considered neighbors, hypothesis tests were two-tailed) using functions implemented in FieldTrip [74, 75]. For the category × distractor interaction, there were no significant clusters (all p>0.1), therefore interaction effects between the main effects were not considered in further analyses. To assess anticipatory attentional modulations before S1 a similar permutation test for the category effect involving only the spatial dimension (spanning across recording channels) was performed on alpha power averaged on a longer pre-S1 time window ([-100 -600] ms before S1 onset).
25
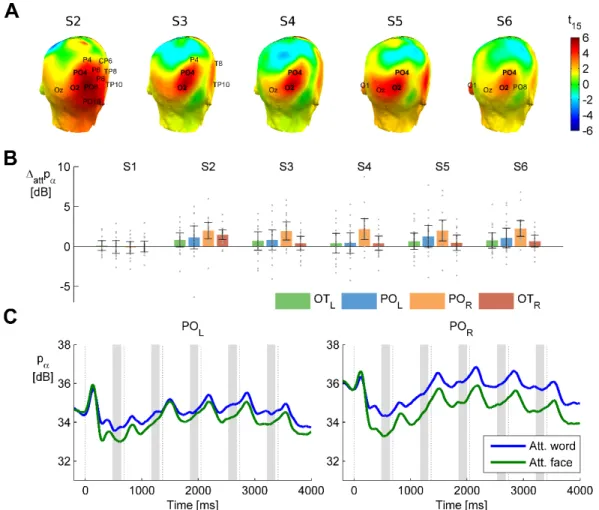
To assess the hemispheric lateralization and temporal dynamics of the two main effects, separate follow-up ANOVAs (one for the category effect, one for the distractor effects) were conducted. In these analyses, the factor ‘sequence’ represented position in the stimulus sequence (time windows from pre-S2 to pre-S6), and ‘hemisphere’ was used to capture lateralization effects. The interactions of these two factors with the current main effect of interest (category or distractor) were also assessed, but not the main effects themselves, as they were already quantified in the whole-scalp statistics stage. The electrode pools of interest for this analysis were defined using the whole-scalp results of the two main effects in the following way. First, electrodes where significant differences were consistently present across the whole temporal extent of the cluster (S2-6 for the category effect, S2-4 for the distractor effect, see Results) were selected. Second, symmetric hemispheric electrode pools were formed, assuring that the pair of each electrode is included in the contralateral pool. (For example, on PO3 the category effect was always sub-threshold, but it was added to the left pool for the category effect as a pair of PO4.) Alpha power averaged within these pools for all the 5 pre-stimulus time windows during the sequence provided the input of the two follow-up ANOVAs. The rationale behind this analysis logic and its validity is detailed in the Methods section of the Introduction chapter (Section 2.4)
Task performance was evaluated by comparing accuracies (percentage of correct responses) in all four conditions in a repeated measures ANOVA with factors ’category’ and ’distractor’.
Post-hoc comparisons were conducted using Tukey’s Honestly Significant Differences procedure.
The Huynh-Feldt correction for violation of sphericity was applied where necessary (indicated by εH-F; for the F-tests, uncorrected degrees of freedom are reported).
3.2.5 Eye tracking data acquisition and analysis
Eye movements were recorded using IView X Hi-Speed (SensoMotoric Instruments) at a sampling rate of 240 Hz. Data was cleaned of blinks and detrended, then segmented as described in the ERP processing section. To assess fixation stability, the root mean square deviation from the fixation dot across trials was calculated for each time point and then averaged within each [-200 100] ms peristimulus interval for each condition. Then, these RMS fixation stability values were compared in a repeated measures ANOVA with factors ’category’, ’distractor’ and ’sequence’.
26
3.3 Results
3.3.1 Behavior
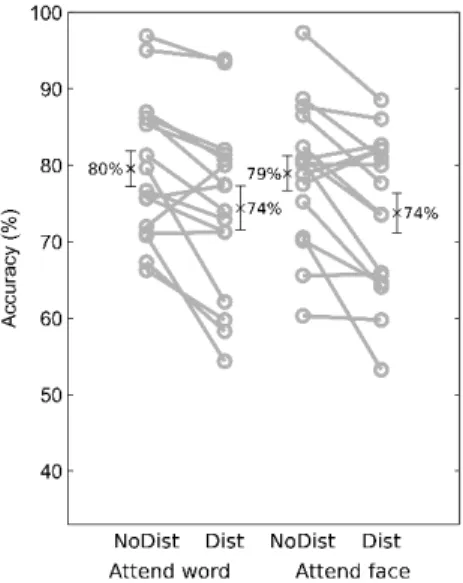
Figure 3.2 Behavioral results. Accuracies in the 4 conditions. Gray circles are individual subjects, crosses and error bars mark condition mean (see also text labels) and SEM, respectively.
The behavioral results (see also Fig. 3.2) showed that subjects' accuracy was similar in the attend- face (76±2%, mean±SEM) and attend-word (77±2%) conditions (main effect of category: F(1, 15)=0.11, p=0.74). The presence of distractors had a significant effect on performance both when faces and words were attended (distractor absent: 79±2%; distractor present: 74±3%; main effect of distractor: F(1,15)=20.43, p=0.00041; category × distractor interaction: F(1,15)=0.00005, p=0.99).
These results imply that visual category related attentional effects in the EEG results cannot be accounted for by differences in attentional load or overall task difficulty between the conditions when faces and words were attended.
27
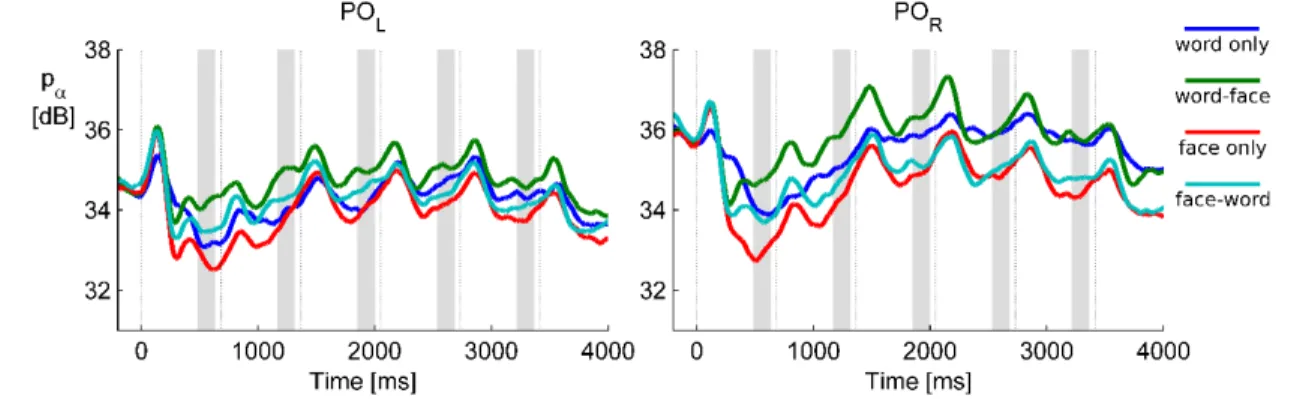
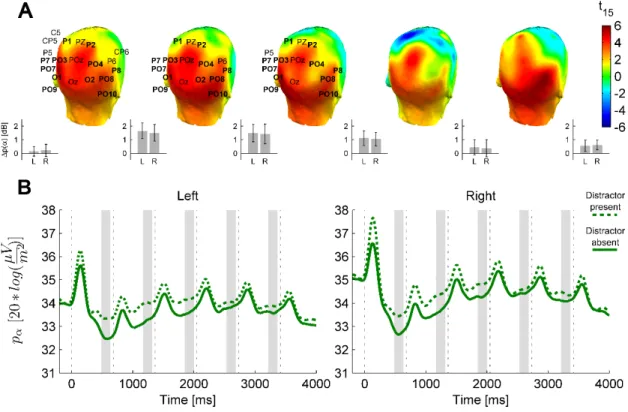
Figure 3.3. Grand average alpha power over the left (POL: O1 and PO3) and right (POR: O2 and PO3) parieto-occipital cluster. The temporal evolution of alpha power in all four conditions is shown separately. Thin vertical lines are at the times of stimulus onsets (S1 to S6), shaded areas depict pre-stimulus time windows of interest where anticipatory activity was assessed.
3.3.2 Electrophysiology
The results revealed that anticipatory alpha activity measured on parieto-occipital electrodes was modulated depending on whether participants were cued to attend to faces or words, regardless of the presence of distractors (Figs. 3.3, 3.4, 3.5). Alpha power over the parieto-occipital cortex (see topography on Fig 3.4A) was significantly higher when words were attended than when faces were task-relevant (cluster-level p=0.02). Importantly, this object category based attentional modulation of alpha power showed a hemispheric lateralization: attending to words as compared to faces led to significantly larger increase in alpha activity over the right than the left hemisphere (category × hemisphere interaction F(1,15)=6.04; p=0.027).