The generation and propagation of the human alpha rhythm
Milan Halgrena,1,2, István Ulbertb,c, Hélène Bastujid,e, Dániel Fabóf, Lorand Er}ossc,g, Marc Reyh,i,j, Orrin Devinskyk, Werner K. Doylek, Rachel Mak-McCullyl, Eric Halgrenm, Lucia Wittnerb, Patrick Chauvelh,i,j, Gary Heitn, Emad Eskandara,3, Arnold Mandello, and Sydney S. Casha
aDepartment of Neurology, Massachusetts General Hospital, Harvard Medical School, Boston, MA 02114;bInstitute of Cognitive Neuroscience and Psychology, Research Center for Natural Sciences, Hungarian Academy of Sciences, Budapest 1051, Hungary;cFaculty of Information Technology and Bionics, Péter Pázmány Catholic University, Budapest 1088, Hungary;dLyon Neuroscience Research Center, Université Claude Bernard, 69100 Villeurbanne, France;eUnité d’Hypnologie, Service de Neurologie Fonctionnelle et d’Épileptologie, Hôpital Neurologique, Hospices Civils de Lyon, 69003 Lyon, France;
fEpilepsy Centrum, National Institute of Clinical Neurosciences, 1145 Budapest, Hungary;gDepartment of Functional Neurosurgery, National Institute of Clinical Neurosciences, 1145 Budapest, Hungary;hDivision is Institut de Neurosciences des Systèmes, Aix-Marseille Université, 13007 Marseille, France;
iINSERM, Institut de Neurosciences des Systèmes, 13005 Marseille, France;jAssistance Publique–Hôpitaux de Marseille, Timone Hospital, 13005 Marseille, France;kComprehensive Epilepsy Center, New York University School of Medicine, New York, NY 10016;lDepartment of Psychology, University of California, Berkeley, CA 94720;mDepartment of Neurosciences and Radiology, University of California San Diego, La Jolla, CA 93093;nDepartment of Neurosurgery, Permanente Medical Group, Redwood City, CA 94063; andoDepartment of Psychiatry, University of California San Diego, La Jolla, CA 92093
Edited by Gyorgy Buzsáki, New York University Neuroscience Institute, New York, NY, and approved October 11, 2019 (received for review July 30, 2019) The alpha rhythm is the longest-studied brain oscillation and has
been theorized to play a key role in cognition. Still, its physiology is poorly understood. In this study, we used microelectrodes and macroelectrodes in surgical epilepsy patients to measure the intracortical and thalamic generators of the alpha rhythm during quiet wakefulness. We first found that alpha in both visual and somatosensory cortex propagates from higher-order to lower-order areas. In posterior cortex, alpha propagates from higher-order anterosuperior areas toward the occipital pole, whereas alpha in somatosensory cortex propagates from associative regions toward primary cortex. Several analyses suggest that this cortical alpha leads pulvinar alpha, complicating prevailing theories of a thalamic pacemaker. Finally, alpha is dominated by currents and firing in supragranular cortical layers. Together, these results suggest that the alpha rhythm likely reflects short-range supragranular feed- back, which propagates from higher- to lower-order cortex and cortex to thalamus. These physiological insights suggest how alpha could mediate feedback throughout the thalamocortical system.
alpha
|
oscillations|
intracranial EEG|
laminar|
thalamocorticalA
lpha oscillations (7 to 13 Hz) (1) are the most salient elec- troencephalogram (EEG) event during wakefulness and may be fundamental for top-down cognitive processes (2, 3), such as attention (4), perception (5, 6), functional inhibition (7, 8), and working memory (9). However, the underlying neural structure(s) and circuits which generate alpha are intensely controversial. Studies have pointed to the thalamus as the pri- mary alpha pacemaker, with the classic posterior alpha rhythm driven by the pulvinar and/or lateral geniculate nucleus (LGN) (4, 10–12). Within the cortex, it’s widely assumed that alpha originates from infragranular layers driven by layer V pyramidal cells (13–17). Despite the prevalence of these hypotheses, the studies used to support them are not definitive; previous elec- trophysiological literature has either used a distant reference susceptible to volume conduction (4, 13, 15), was performed in vitro (14), or relied on extracranial recordings (18) (Discussion).Crucially, none of these hypotheses have been directly tested via invasive recordings in humans. We therefore analyzed focal mi- croelectrode and macroelectrode recordings from human neo- cortex and thalamus in surgical epilepsy patients to characterize alpha’s generation during quiet wakefulness.
Results
We analyzed electrocorticographic (ECoG) recordings of spon- taneous alpha oscillations (4.54±0.87 min, mean±SD) in the occipital, posterior temporal, and posterior parietal cortices of 5
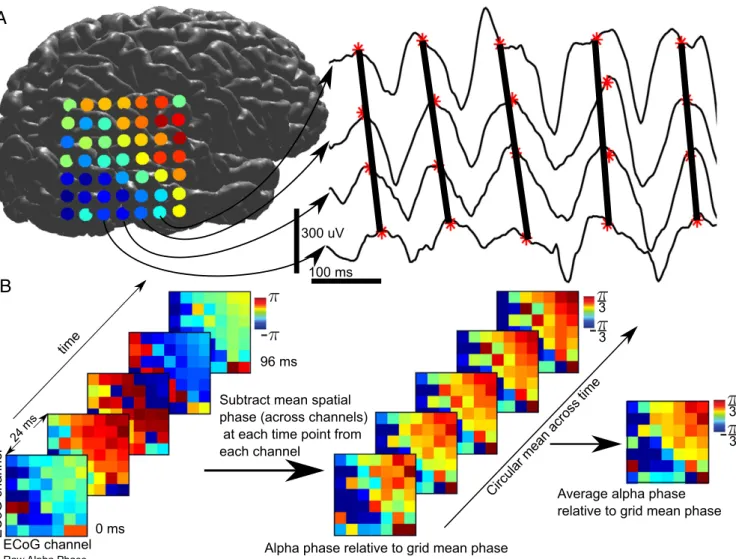
patients (SI Appendix, Fig. S1 and Table S1) (ECoG patients [Pts.] E1 to E5; E1, E3, and E4 participated in an eye-closure task, whereas E2 and E5 did not and were recorded during quiet wakefulness). Strikingly, alpha oscillations propagated as trav- eling waves from anterosuperior cortex toward posteroinferior areas (Figs. 1 and 2 andSI Appendix, Figs. S2–S4) (19). To quantify this propagation, we used a 2-pass 3rd-order 0-phase-shift Butter- worth filter between 7 and 13 Hz to extract alpha-band activity. The Hilbert transform was then applied to find the analytic signal and, from this, the instantaneous amplitude and phase of ongoing al- pha activity; only time points with the highest 20% of alpha-band amplitude (averaged across array channels at each time point) were analyzed further.
To visualize the spatial progression of alpha oscillations across the array, we found the circular difference between the mean phase across all contacts and each individual contact at each point in time (Fig. 1B). This yielded a distribution of differences of each contact’s phase from the grid’s mean phase across all
Significance
The alpha rhythm dominates the electroencephalogram during quiet wakefulness, but the brain structures which generate it are not known. Using rare intracranial recordings in epilepsy patients, we find that alpha rhythms propagate toward the back of the brain and that alpha waves in cortex (particularly superficial layers) lead alpha oscillations in the thalamus. These findings shed light on how the human alpha rhythm coordi- nates activity throughout the brain.
Author contributions: I.U., E.H., and S.S.C. designed research; I.U., H.B., D.F., L.E., M.R., O.D., W.K.D., R.M.-M., E.H., L.W., P.C., G.H., E.E., and S.S.C. performed research; M.H. and A.M. analyzed data; and M.H. and S.S.C. wrote the paper.
The authors declare no competing interest.
This article is a PNAS Direct Submission.
Published under thePNAS license.
Data deposition: The data underlying our figures have been made publicly available on figshare, DOI:10.6084/m9.figshare.9927125.v2. Custom scripts are freely available at https://github.com/mhalgren/AlphaGen. Macaque data are publicly available athttp://
neurotycho.org/data/20120813ktanesthesiaandsleepchibitoruyanagawa.
1To whom correspondence may be addressed. Email: mhalgren@mit.edu.
2Present address: Department of Brain & Cognitive Sciences, Massachusetts Institute of Technology, Cambridge, MA 02139.
3Present address: Department of Neurological Surgery, Albert Einstein College of Medi- cine, Bronx, NY 10461.
This article contains supporting information online atwww.pnas.org/lookup/suppl/doi:10.
1073/pnas.1913092116/-/DCSupplemental.
First published November 4, 2019.
time points. We then found the circular mean of this difference (across time points): If a contact is leading an oscillation, it will have a positive circular distance with respect to the grid’s spatial mean phase; if a contact is lagging, it will have a negative phase difference with the grid’s average phase. Fig. 2Bwas then generated by finding the mean circular distance between each contact’s phase and the grid’s mean phase at each time point, or the av- erage advance/delay of a given contact. This method allows one to measure traveling waves oblique to the grid’s implantation and sidestep the selection of a potentially biasing reference contact.
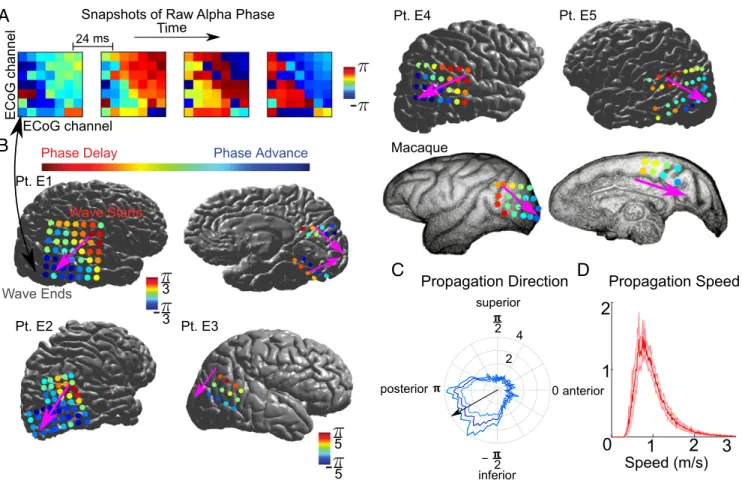
However, this analysis only yields a single, average gradient in each patient and makes it hard to assess statistical significance within subjects. We therefore performed a second test to confirm that alpha oscillations had a consistent propagation direction across time in individual patients. This was done by finding the direction of the average spatial phase gradient across the grid of electrodes at each time point, reflecting the average direction of alpha propagation at a single time point, and then determining if the distribution of gradient directions throughout time was nonuniform (20) (P≤10−17in each patient, Rayleigh test) (Fig.
2C,Materials and Methods, andSI Appendix, Fig. S4). Estimated median speeds of these waves (derived from the phase gradient) were just under 1 m/s (median speed across patients: 0.9134± 0.1563 m/s). (SI Appendix, Fig. S4 andSI Methods). Open-source
ECoG recordings in a healthy macaque during eye closure demonstrated a highly similar propagation direction and speed (21, 22) (Fig. 2B).
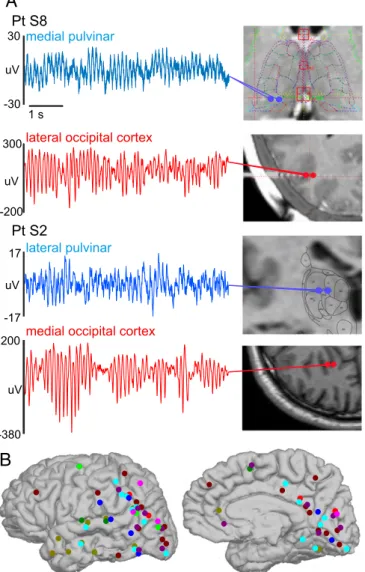
To determine if the thalamus coordinated these traveling al- pha waves, we utilized stereo EEG (SEEG) to make bipolar local-field-potential gradient (LFPg) macroelectrode depth re- cordings (n=9 patients, 36±7.5 min, mean±SD) during quiet wakefulness. Recordings were made simultaneously from the cortex and the pulvinar, a thalamic nucleus which projects broadly to posterior cortical regions (23) and postulated to drive cortical alpha (4, 24) (Fig. 3A) (SEEG Pts. S1 to S9). The use of a bipolar derivation (i.e., referencing each contact to its neigh- bor) ensured that activity was locally generated and not volume conducted from a distal structure. Cortical coverage was pre- dominantly posterior (108 of 124 cortical contacts posterior to the central sulcus), similar to our ECoG patients (Fig. 3B). We first verified that alpha traveling waves could be measured in these cortical depth recordings by applying the same method used to quantify alpha propagation in our ECoG data (i.e., measuring how much each individual channel’s alpha phase led or lagged the mean phase across all channels). Analysis was re- stricted to occipital and posterior temporal/parietal channels which were in unambiguously lateral cortex; this ensured that the LFPg’s polarity was consistent across sites (always surface 100 ms
time
ECoG channel
lennahcGoCE
Raw Alpha Phase Alpha phase relative to grid mean phase
24 ms
Subtract mean spatial phase (across channels) at each time point from each channel
Circular mean across timeAverage alpha phase relative to grid mean phase
-
-
3 3
-
3 3
0 ms
96 ms 300 uV
A
B
Fig. 1. Analysis stream for ECoG traveling waves. (A) Alpha propagates as a traveling wave in the raw broadband data. (B) Analysis stream for visualizing traveling waves in ECoG. We start with raw alpha phase of the grid over time. Then, for each time point, we find the circular distance (distance on the unit circle) between each contact and the grid’s mean phase (across all contacts) at that time point. Lastly, we find the circular mean of this difference to get each contact’s average phase advance or delay.
NEUROSCIENCE
positive, given that we subtracted medial from lateral contacts for each bipolar pair). Just as with our ECoG recordings, we only analyzed time points with the top 20% of cortical alpha power (averaged across channels at each time point). The alpha phase of anterosuperior contacts led ones closer to the occipital pole, replicating our ECoG recordings (Fig. 4AandSI Appendix, Fig.
S6). This demonstrates that these traveling waves are not reference- dependent and suggests that the alpha rhythms recorded in our depth patients are analogous to the ones recorded in our ECoG patients. As we then wished to examine the pulvinar’s role in cortical alpha, all further analyses were biased toward thalamic activity by only analyzing the 2-s epochs with the 20% most thalamic alpha-band power (averaged across all thalamic chan- nels). First, we characterized the prevalence of alpha rhythms in both cortex and pulvinar. This was done by detecting which channels had peaks between 7 and 13 Hz in their power spectra (peaks were detected via the peakfinder algorithm;Materials and Methods). Surprisingly, power spectra from cortical contacts had alpha-band peaks more frequently (63.4%; 78 of 123 of cortical channels) than ones in the pulvinar (34.6%; 9 of 26 of thalamic channels) (Fig. 4B,Materials and Methods, andSI Appendix, Fig.
S7) Thalamic and cortical power spectra also sometimes had different peak frequencies (Fig. 4B); while this could be con- strued as evidence for separate thalamic and cortical alpha generators, this is not necessarily the case. Empirically, spindles (believed to be thalamocortically driven) have higher frequencies in the thalamus than the cortex (25). Analytically, weakly cou- pled oscillators can also exhibit different peak frequencies,
despite driving one another (26). Thalamocortical coherence spectra often exhibited robust alpha peaks (Fig. 4E), indicating that alpha rhythms in the posterior cortex and pulvinar are functionally coupled (peak alpha coherence in thalamocortical channel pairs with significant alpha coherence: 0.3346±0.012, mean ± SEM). As a first means of determining whether neo- cortical alpha led thalamic alpha (or vice versa), we detected alpha bursts in both thalamic and cortical channels. Briefly, a putative burst was detected when alpha-band power (7 to 13 Hz, hilbert.m) exceeded 3 times the average of theta-band (4 to 6 Hz) and beta-band (15 to 25 Hz) power. Burst starts and stops were defined as when alpha-band power was at least 2 times the theta/
beta average, and all bursts less than 400 ms were then rejected.
Lastly, alpha bursts which were less than 50 ms apart were merged.
For each thalamocortical channel pair, we determined if cortical bursts started significantly before thalamic bursts (or vice versa).
By the binomial test, 28 of 362 thalamocortical channel pairs (P<
0.05, Bonferroni corrected across all 362 channel pairs) had a significant lead in alpha onset. In all 28 of these channel pairs, cortical alpha bursts led thalamic alpha bursts (Fig. 4C and SI Appendix, Fig. S8). Importantly, a previous study applying a similar burst-detection algorithm to analyze sleep spindles in the same subjects and channels during sleep found the opposite di- rectionality—i.e., that thalamic spindles led cortical spindles (25).
As a second measure of cortical alpha leading thalamic alpha power, we measured the cross-covariance of alpha amplitude (as derived from the amplitude envelope of the analytic signal) in thalamocortical channel pairs with statistically significant alpha Pt. E1
ECoG channel
lennahcGoCE
24 ms Time Pt. E4
Pt. E2 Pt. E3
0 1 2
2 3
Speed (m/s)1
superior
inferior
posterior anterior
Snapshots of Raw Alpha Phase
2
0
2 2
4
C B
A
Pt. E5Phase Delay Phase Advance
Wave Starts
Wave Ends
-
-
3 3
Macaque
Propagation Direction
D
Propagation Speed-
5 5
Fig. 2. Alpha propagates from anterosuperior to posteroinferior cortex. (A) Alpha-phase snapshots from Pt. L1 demonstrate propagation from the grid’s top- right (anterosuperior) to bottom-left corner (posteroinferior). (B) Average circular distance of each contact’s alpha phase from the spatial mean phase during eye closure. In all patients, alpha propagates toward posteroinferior areas. Overlaid arrow is the direction of the grid’s average phase gradient. Color runs from±π3in Pts. E1, E2, and E5 and macaque; and from±π5in Pts. E3 and E4. (C) Average probability distribution of traveling wave directions across time such that the bottom left contact is the most posteroinferior (±SEM across patients). (D) Average probability distribution of traveling wave speeds (±SEM across patients).
coherence (189 of 362) (27). This analysis was largely equivocal, but weakly favored cortical leading thalamic alpha (SI Appendix, Fig. S9 andSI Methods).
To further determine whether cortical or thalamic activity was driving these rhythms, we extracted high gamma power (HGP), a rough proxy for neural firing, in both structures (n = 5; 70 to 120 Hz in Pts. S1 to S3 due to a low sampling rate, 70–190 Hz in Pts.
S8 and S9; Pts. S4 to S7 were excluded due to low sampling rates;
note that using the same 70- to 120-Hz HGP band in Pts. S8 and S9 didn’t substantially change the results;Materials and Methods). If a given structure is generating alpha oscillations (and if local HGP reflects neural firing), its HGP should be synchronous with its alpha-band LFPg and exhibit phase-amplitude coupling (PAC) (28). PAC was assessed by using 2 methods: Tort’s Modulation Index (MI) (29) and the coherence between the time-domain LFPg and HGP (30) (Fig. 4EandSI Appendix, Fig. S10 andSI Methods). To ensure that this PAC wasn’t spuriously driven by sharp waveforms (31), we measured the sharpness ratio (SR;SI Appendix,SI Methods) of each channel’s alpha and then measured the correlation of this with the strength of each channel’s PAC
quantified by its MI. SR and MI were not significantly correlated, trending toward anticorrelation (i.e., smoother waveforms had more PAC), the opposite of what would be expected if our PAC was spurious (r=−0.2124,P=0.0602) (31, 32). Notably, thalamic alpha was rarely coherent with its own HGP (coherence: 0 of 14 intrathalamic contact pairs, MI: 3 of 14, P < 0.05, Bonferroni corrected within patients); instead, thalamic alpha rhythms were predominantly synchronous with cortical HGP (coherence: 9 of 14, MI: 10 of 14; mean peak alpha coherence between thalamic LFPg and cortical HGP channel pairs with significant coherence of 0.3535±0.026) (Fig. 4DandE), supporting cortical generation.
Because HGP is an imperfect proxy for neuronal firing (33), the failure to find consistent local thalamic PAC could reflect a limitation of our recordings rather than a cortical origin for al- pha [but it should be noted that thalamic HGP is modulated by thalamic sleep spindles in the same recordings (25)]. To resolve this ambiguity, we further analyzed the minority of thalamic channels (5 of 42 intrathalamic contact pairs) in which alpha LFPg was phasic with HGP in at least 1 thalamic and cortical channel. These channel pairs gave us the opportunity to examine average HGP in both the thalamus and cortex at different tha- lamic alpha phases. Unlike the relative LFPg phase, which is uninterpretable in the thalamus due to its nonlaminar structure, differences in mean HGP with respect to the alpha LFPg phase can be interpreted as lags of putative population spiking activity (25). By averaging the mean cortical and thalamic HGP with respect to the phase of thalamic alpha LFPg phases across channel pairs, it is apparent that cortical HGP leads thalamic HGP (Fig. 4F). In individual thalamocortical channel pairs, this could be quantified by measuring the cross-covariance between the thalamic and cortical HGP profiles and seeing if the peak was positive/negative or examining which had minimal HGP at an earlier thalamic alpha phase. Cortex led thalamus in all 5 channel pairs, as derived by both measures, more than expected by chance (P=0.0313, 1-tailed binomial test of cortex leading thalamus against thalamus leading cortex). This lag (difference between HGP minima, as seen in Fig. 4F) was on average∼40°, or∼11 ms, assuming an alpha period of 100 ms. This time delay is physiologically plausible and similar to how much the thalamus leads cortex during sleep spindles (25).
As a final directional measure, we measured the Granger causality (GC) spectrum (which quantifies the amount of in- formation one time series contains about another across fre- quencies) of the LFPg between all pairs of cortical and thalamic contacts (34) (Fig. 4G). Corticothalamic causality in the alpha band was found to be significantly greater than thalamocortical causation for almost every thalamocortical channel pair (across all patients), with a significant difference between thalamocortical and corticothalamic causation (P ≤ 0.01 for each channel pair, Wilcoxon signed rank test, Bonferroni corrected within patients;
143 of 163 [87.73%] pairs with greater corticothalamic than thalamocortical causality;P<1.83×10⁻²⁴across all significantly different channel pairs, binomial test). To ensure that this wasn’t due to our cortical channels having greater alpha power, we re- peated our Granger analysis only using thalamocortical channel pairs in which the thalamic lead had greater normalized alpha power. This actually increased the percentage of channel pairs with significantly greater corticothalamic than thalamocortical alpha causality (74 of 82 [90.24%], significantly more than chance as determined by the binomial test,P<7.2×10⁻¹⁵).
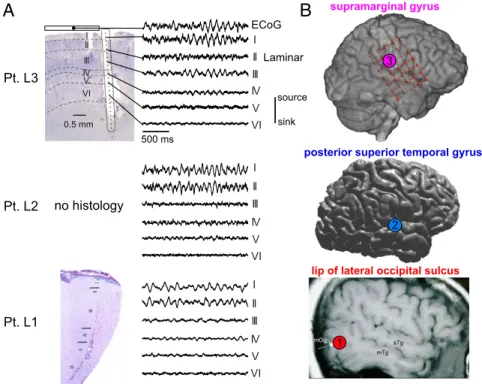
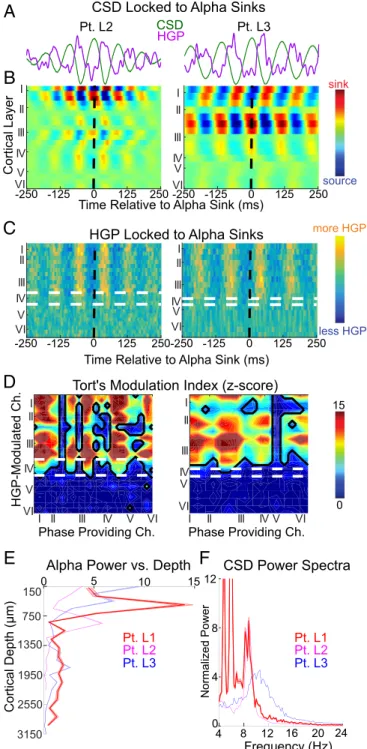
To determine which cortical layers generate the alpha rhythm, we utilized laminar microelectrodes (35) in the occipital, tem- poral, and parietal cortex to record current-source density (CSD;
n=3), HGP, and multiunit activity (MUA) (n=2) across gray- matter layers during quiet wakefulness (11.32 ± 0.48 min, mean±SD) (35) (Fig. 5) (laminar Pts. L1 to L3). The CSD is the second spatial derivative of the monopolar field potential, which yields a volume-conduction-free measure of local transmembrane lateral occipital cortex
medial pulvinar
1 s 300
-200 uV
30
-30 uV
Pt S8
Pt S2
medial occipital cortex lateral pulvinar 17
-17 uV
200
-380 uV
A
B
Fig. 3. Robust alpha rhythms can be recorded in human pulvinar and cor- tex. (A) Representative 6-s LFPg traces of simultaneous thalamic and cortical alpha activity. Prominent, largely continuous alpha rhythms can be recorded in various locations within the pulvinar as well as posterior cortex. (B) Cor- tical implant locations in all SEEG patients displayed on Pt. S3′s brain. Each color signifies a different patient.
NEUROSCIENCE
currents surrounding the laminar probe (35, 36). MUA [filtered online at 200 to 5,000 Hz, then filtered offline at 300 to 3,000 Hz and rectified (35)] and HGP (filtered offline at 70 to 190 Hz) are also spatially focal and reflect neural firing (37). By quantifying both transmembrane currents [which generally reflect postsynaptic events (38)] and firing within each cortical layer, we can determine
which laminae generate the alpha currents and firing measured extracortically with ECoG, magnetoencephalography, and EEG (36, 39–41). Similar to our previous analyses, we only utilized artifact-free 2-s epochs with the 20% most alpha-band power.
Despite being recorded from various regions of cortex, alpha-band currents in all patients were strongest within superficial cortical
xednICG
-250 -125 0 125 250
Time Relative to Thal. Alpha Peak (ms)
B
2 5 10 15 20
5 7 10 13 15 20 5 7 10 1315 20
5 7 10 1315 20 5 7 10 13 15 20 12
0 4 8
20
0 10 15
5 12
0 4 8
8
0 4 6
2
Pt. S3 Pt. S4
Pt. S5 Pt. S8
E
C
Cortex -> Thalamus Thalamus -> Cortex Coherence of
Ctx LFPgThal HGP Ctx HGP
F
Frequency (Hz)
rewoP.mroN
).u.a(.pmA
Coherence of Thal LFPg Thal HGP Ctx HGP
0 0.2 0.4 0.6 0.8 1.0
2 5 10 15 20
Frequency (Hz)
Granger Causality between...
Ctx LFPg Thal HGP Ctx HGP Thal LFPg Timelocked to
Thal. Alpha Peaks
Ctx LFPg with... Thal LFPg with...
G
7
2 5 10 13 15 20
.085 .12
Frequency (Hz) .05
D A
-
8 8
Cortical HGP precedes Thalamic HGP
-2 2
- 0
Thalamic Alpha Phase (radians) 4
0
-4
Normalized HGP (z-score)
0 0 7 0 5 3 0
5 3
- 0
-7000 5 10
Lag/Lead Time (ms)
0 0.2 0.4 0.6 0.8 1.0
# of chanel pairs
Thalamus ->
Cortex
Cortex ->
Thalamus
Fig. 4. Cortical alpha leads thalamic (pulvinar) alpha. (A) Average alpha-phase lag/leads in bipolar contacts (n=5). Note that anterosuperior channels lead inferoposterior ones, in accord with our ECoG recordings. (B) Power spectra of the thalamic (color) and cortical (gray) channel with the greatest alpha power.
(C) The difference in start times between all cortical and thalamic alpha bursts (start time in thalamus to start time in cortex) in the 28 channel pairs with a significant thalamic or cortical lead (P<0.05, Bonferroni corrected, binomial test). Alpha bursts start (on average) in cortex for all 28 channel pairs. (D) Cortical and thalamic LFPg and HGP from representative channels locked to peaks in thalamic alpha LFPg—cortical, but not thalamic, HGP is phasic with thalamic LFPg.
(E) Coherence spectra of thalamic and cortical LFPg with thalamic and cortical HGP and LFPg from the same channel pair inD; the coherence of thalamic LFPg with cortical HGP (but not thalamic HGP) suggests that the cortex may drive thalamic alpha activity. (F) Normalized thalamic and cortical HGP at different thalamic alpha phases averaged across channels; note that cortical HGP slightly leads thalamic HGP. (G) GC spectra averaged over all thalamocortical contact pairs; corticothalamic causality shows a strong alpha peak. Amp., amplitude; a.u., arbitrary units; ctx, cortical; norm., normalized; thal, thalamic.
0.5 mm I II III IV V
VI source
ECoG
500 ms
sink Laminar
I II III IV V VI no histology
Pt. L3
I II III IV V VI
I II III IV V VI
2
B
3
A
1 Pt. L2
Pt. L1
supramarginal gyrus
posterior superior temporal gyrus
lip of lateral occipital sulcus
Fig. 5. Laminar recordings of cortical alpha. (A) Nissl stains of the explanted tissue surrounding the laminar probe in Pts. L1 and L3, in addition to repre- sentative laminar CSD traces from each layer in each subject. Note that despite being made in distinct cortical locations, alpha oscillations were always strongest in layer I/II. Furthermore, in L3, the trace of a simultaneously recorded overlying ECoG contact is near identical to the underlying laminar layer I. (B) Locations of each laminar probe in all patients. Adapted with permission from ref. 86.
layers (Pt. L1:P<2.27×10⁻²⁵; Pt. L2:P<1.9×10⁻²²; Pt. L3:P<
1.66×10⁻⁵; largest Pvalues of Wilcoxon sign rank comparing mean alpha power in supragranular versus granular and infra- granular channels across epochs, Bonferroni corrected) (Figs. 5 and 6BandEandSI Appendix, Fig. S11).
Averaging HGP on alpha current sinks as well as measuring Tort’s MI between alpha CSD and HGP (Fig. 6B–D) suggested
that alpha-band firing is located in layers I through III. Interestingly, while HGP was modulated by alpha throughout layers I through III, significant MUA modulation was restricted to layer III (Fig. 7). It’s not clear whether this reflects differential sensitivity to noise or suggests that MUA and HGP have divergent neural generators. In accord with the latter hypothesis, recent laminar recordings found that HGP was driven by dendritic processes as well as spiking, consistent with our HGP modulation being superficial to MUA (the latter reflecting firing at the soma) (42). Despite this difference, the MUA and HGP profiles averaged across all laminar chan- nels and triggered on alpha troughs were highly similar (Pt. L2:
r=0.6756,P=0; Pt. L3:r=0.4493,P=0), and both measures imply that the firing of supragranular (and not infragranular) pyramidal cells are phasic with the human alpha rhythm. Fur- thermore, this supragranular firing was maximal during very superficial sinks and minimal during superficial sources, con- sistent with active synaptic and/or voltage-gated currents in layers I/II. The sink-over-source current dipole associated with increased firing would be recorded with ECoG/(M)EEG as surface-negative, as the negative end of the dipole (a sink of current flowing away from the extracellular space) is closer to the surface electrode. Consequently, this sink–source configura- tion comports with previous studies (39, 43) reporting that firing is maximal during the surface-negative trough of the alpha rhythm and maximal during its surface-positive peak.
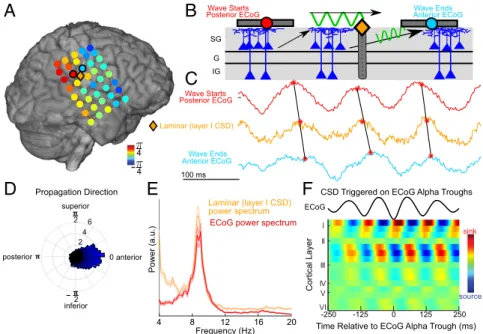
Lastly, we tested if the traveling alpha waves recorded with ECoG corresponded to the supragranular alpha oscillations recorded with laminar probes. To demonstrate this, we made combined ECoG-laminar recordings in Pt. L3 to record the same alpha rhythm at both local (laminar) and global (ECoG) scales (44) (Fig. 8). Robust alpha oscillations [likely the classical mu rhythm given the electrodes’locations (45)] were measured with ECoG from perirolandic cortex and with a simultaneously implanted laminar probe from the supramarginal gyrus; both recordings exhibited nearly identical alpha peaks (Fig. 8E), and averaging the laminar CSD on ECoG alpha troughs revealed strong supragranular sinks and sources (Fig. 8F). Alpha propa- gated as a traveling wave throughout the grid (Fig. 8A–D) with a similar median speed (0.62 m/s) to traveling waves in posterior cortex. If the supragranular alpha measured with laminar probes (htpeDlacitroCμ)mCortical Layer
Time Relative to Alpha Sink (ms)
Frequency (Hz)
A
B
C
D
E F
15 5 10
I II III IV VIV
0
3150
8
4
0 12
0 250
-250 -125 125
0 250
-250 -125 125
CSD Power Spectra
12 8
4 16 20 24
HGPCSD
Tort's Modulation Index (z-score) .hCdetaludoM-PGH
Phase Providing Ch.
Alpha Power vs. Depth
CSD Locked to Alpha Sinks
HGP Locked to Alpha Sinks
sink
source
Phase Providing Ch.
more HGP
less HGP
0 I 15
II III V VI IV
V I V VI II
I II I I II III IVV
VI 0 250
-250 -125 125
III III IV V VI
I II III IVV VI
0 250
-250 -125 125
V
I V VI
II I II I I II III
V VI IV
2550 1950 1350 750 150
0
Normalized Power
Time Relative to Alpha Sink (ms)
Pt. L2 Pt. L3
Pt. L1 Pt. L2 Pt. L3
Pt. L1 Pt. L2 Pt. L3
Fig. 6. Alpha CSD and HGP are maximal in supragranular cortex. (A) Average CSD and HGP waveforms of a single channel on the same time axes asB(±SEM across alpha sinks). (BandC) CSD (B) and HGP (C) averaged on current sinks in channels 3 and 6 in Pts. L2 and L3, respectively; white and black dashed lines indicate layer IV boundaries and the time of the alpha sink, respectively. (D) Z score of the MI be- tween alpha phase and HGP across all channels (Ch.). (E) Average alpha power throughout the cortical depth (±SEM across epochs). (F) Power spectra of the channel with greatest alpha power in each subject (±SEM across epochs).
II III I II III VI
0 250
-250 -125 125 -250 -125 0 125 250
I II
III
V VI IV I
II
III
V VI IV
I VI
Time Relative to Alpha Sink (ms)
Tort's Modulation Index (z-score)
.hCdetaludoM-PGH
IV V
Phase Providing Ch.
MUA Locked to Alpha Sinks
more MUA
less MUA
0 .hCdetaludoM-PGH 15
V IV Phase Providing Ch.
Z-score
A
B
Time Relative to Alpha Sink (ms)
Patient 2 Patient 3
CSD
CSD
Fig. 7. MUA is modulated in layer III. (A) MUA averaged on current sinks on the channels with the greatest alpha power (channels 3 and 6, respectively), which is most clearly modulated within lower layer III. (B) Tort’s MI between alpha CSD phase and MUA amplitude over all laminar contact pairs—note that firing is correlated with alpha phase in both superficial and deep cortex.
Ch., channel.
NEUROSCIENCE
underlies the traveling alpha waves recorded with ECoG, we should be able to observe traveling alpha waves propagating through the supragranular layers of the laminar probe with a phase between its neighboring ECoG contacts (Fig. 8C). To establish this, we measured the average phase advance/delay of the CSD in the laminar’s most superficial channel with respect to the grid’s mean phase and found a phase lag intermediate to that of neighboring ECoG contacts (Fig. 8A; this was also demon- strated by measuring the phase of the coherence between lami- nar and ECoG inSI Appendix, Fig. S13).
Interestingly, the direction of propagation was posterior to anterior (Fig. 8D). While this may appear to conflict with our recordings of posterior alpha (which propagated anterior to
posterior toward the occipital pole), the reversed propagation direction is consistent with alpha propagating from higher- to lower-order cortex in both systems, as associative (higher-order) somatosensory areas are posterior to primary somatosensory cortex (46–48). Future studies should record somatosensory al- pha from more patients to confirm that this effect is robust.
Discussion
Our results suggest that alpha contributes to feedback processing within and across brain regions and structures (Fig. 9). The an- atomical propagation of posterior alpha traveling waves from anterosuperior to posteroinferior cortex implies a functional pro- gression from higher-order to lower-order visual areas, matching
100 ms SG
G IG
Laminar (layer I CSD)
sink
source
-250 -125 0 125 250
E
superior
inferior
posterior anterior
2
0
2
CSD Triggered on ECoG Alpha Troughs Wave Starts
Wave Ends Posterior ECoG
Anterior ECoG
A B
D F
2 4 2 6
0
ECoG I II
III IV V VI
Time Relative to ECoG Alpha Trough (ms)
4 8 12 16 20
Laminar (layer I CSD) ECoG power spectrum
Power (a.u.)
Frequency (Hz) power spectrum
reyaLlacitroC
Wave Starts
Posterior ECoG Wave Ends
Anterior ECoG
C
Propagation Direction
-
4 4
Fig. 8. Simultaneous ECoG–laminar recordings reveal traveling alpha waves which propagate through supragranular cortex. (A) Average circular distance of each ECoG (circles) and layer I laminar (diamond) contact’s alpha phase from the spatial mean phase throughout the ECoG grid. Note that the laminar’s alpha phase is intermediate to neighboring ECoG contacts, suggesting that ECoG and the laminar probe recording the same traveling wave at different scales. (B) Representative drawing of a traveling alpha wave (as measured with ECoG) propagating through superficial layers (as measured by a laminar probe). (C) Example traces from ECoG contacts posterior (red) and anterior (blue) to the laminar probe. Alpha phase in the laminar is intermediary to the ECoG contacts.
(D) Distribution of traveling wave directions; mu waves propagate from posterior (higher-order) toward anterior (lower-order) cortex. (E) Power spectra from simultaneous laminar and ECoG recordings; they share a near-identical alpha peak. (F) Laminar CSD averaged on troughs in the nearest ECoG contact. Note that alpha activity is superficial.
Higher order cortex
Pulvinar Top-down influences (attention, predictive coding, plasticity, etc.)
Lower order cortex SG
G IG V3
V2 V1
MTHigher Order
Lower Order Travelling
Wave
A B
MT V3 V2 V1
*
* *
*
*
*
* *
* * *
*
short-range feedback
Fig. 9. Tentative model for how alpha’s physiology could mediate feedback. (A) Alpha propagates as a traveling wave from higher-order (middle temporal, visual area 3) toward lower-order visual areas 1/2 cortical areas. (B) Alpha is strongest within supragranular cortex and may carry top-down information via short-range feedback connections to constrain lower-level processing; for instance, alpha may play a role in resolving ambiguous visual imagery, such as the picture of a woman and a horse’s snout shown above. Cortical alpha in layer VI might influence alpha activity within the pulvinar. Reproduced with per- mission from ref. 87, which is licensed underCC BY 4.0.
alpha’s putative role as a feedback rhythm (13). Alpha also propa- gated from associative (posterior) to primary (anterior) areas within somatosensory cortex, leading to a reversed physical propagation direction but the same hierarchical one. Interestingly, previous scalp studies of human traveling alpha waves have also found varying propagation directions (2, 49), in contrast to the consistent an- terior–posterior directionality we observed. This may be due to scalp recordings of alpha reflecting a volume-conducted mixture of traveling alpha waves with different directions traversing dis- tinct cortical hierarchies, consonant with our demonstration of posterior-to-anterior alpha propagation in somatosensory cortex.
Alternatively, propagation direction might change with task or behavioral state (49, 50); our macaque analysis provided some evidence for this, as eye opening induced a clear (though much smaller) peak of directional propagation from posterior to an- terior areas (SI Appendix, Fig. S4). Recent studies which used ECoG to study alpha traveling waves also appeared to find that alpha within posterior cortex generally propagates toward the occipital pole, although they do not explicitly draw this conclusion (43, 51). That their propagation directions were less consistent could be due to differences in state, as much of our data were collected during eye closure (which greatly increases alpha power), whereas theirs was collected during tasks. Alpha traveling waves might serve as a mechanism to internally scan the attentional field, tag distinct visual features with different phases (52), or facilitate plasticity between upstream and downstream areas (53, 54).
Simultaneous recordings from human cortex and pulvinar provided several measures suggesting that cortical alpha leads thalamic alpha during quiet wakefulness. Thalamic alpha was less common than cortical alpha, and discrete alpha bursts in cortex led alpha bursts in the thalamus. Furthermore, thalamic alpha LFPg was synchronous with cortical HGP (putative firing) more often than thalamic HGP; when thalamic alpha was syn- chronous with both cortical and thalamic HGP, HGP in the cortex led HGP in the thalamus. However, because HGP is an imperfect proxy for spiking (33, 42), this finding must be con- firmed with single unit recordings in animal models. Finally, thalamic alpha was Granger caused by cortical alpha.
A potential weakness of these bivariate causal analyses is the possibility of a third structure (not recorded from) driving alpha oscillations in both pulvinar and posterior cortex, such as the LGN (10). While this is a possibility, the LGN is an unlikely cortical pacemaker, as its major projections are limited to striate and circumstriate cortex (23), and we found that alpha oscilla- tions propagate toward (and not from) the occipital pole. Be- cause the LGN and pulvinar are the 2 thalamic nuclei with the most robust projections to posterior cortex capable of driving visual alpha, these findings agree with strong cortical influences on thalamic (pulvinar) alpha during quiet wakefulness (though this conclusion only follows for posterior/visual alpha). While this appears to contradict animal studies in which the pulvinar drove cortical alpha (4), it’s consonant with findings that the cortex can still generate alpha in vitro (14) and actually shows increased alpha-band power when the pulvinar is inactivated (24), as well as alpha coherence within the cortex exceeding thalamocortical alpha coherence (55). These findings can be reconciled with other studies supporting thalamic alpha gener- ators (4, 56) in a number of ways. There may be separable tha- lamic and cortical alpha pacemakers which become differentially active and coupled under different behavioral conditions (4, 57)—for instance, this effect may be dependent on eye closure, which was not controlled for in these recordings. Alternatively, the oscillatory circuit required to generate alpha may require both thalamic and cortical cells, or the pulvinar could enable an intracortical alpha pacemaker with tonic (nonrhythmic) excitation/
inhibition without being a direct pacemaker (58), perhaps co- ordinating cortical alpha phase in a task-relevant fashion (4).
Diffuse thalamocortical matrix projections might mediate this, as
matrix projections target superficial cortical layers (59) (in which we found alpha power to be strongest). Nuclei besides pulvinar or LGN, and particularly those with diffuse projections such as the medial dorsal or ventromedial nuclei, could also be involved in generating visual cortical alpha (60). Though direct measure- ments and causal manipulation of spiking activity in animal models are needed to prove this, the simplest explanation for our findings is a leading role for the cortex driving alpha in the pulvinar during quiet wakefulness. Functionally, corticothalamic alpha might inhibit the thalamus to gate feed-forward processing and suppress irrelevant neural assemblies akin to its putative role within the cortex (7), as low-frequency corticothalamic activity can inhibit thalamic firing (61).
Laminar microelectrode recordings demonstrate that alpha oscillations reflect layer I/II currents [postsynaptic (38)] and layer I through III firing (presynaptic), demonstrating that supragranular layers are the source of alpha LFPs and HGP recorded via ECoG and (M)EEG. However, inferring the neural circuit mechanisms which generate the alpha rhythm from our laminar recordings is more complex. As supragranular pyramidal cells (which is where we observed alpha-phasic firing) are known to make feedback projections to layers I/II (where we recorded driving currents), our recordings support layer II/III pyramidal cells as the primary alpha generators within the cortex during quiet wakefulness. Our ECoG recordings also support this, as the short-range feedback projections subserved by supragranular pyramidal cells (62) are a likely intracortical mechanism for me- diating the continuously propagating top-down traveling waves measured by using ECoG. These projections would enable os- cillations which propagate continuously from high- to low-order cortex (i.e., not in the saltatory manner that might be expected if mediated by long-range feedback) at <1 m/s [the conduction velocity of intracortical fibers (63)] (Fig. 9). While most models posit that layer V (infragranular) pyramidal cells drive alpha within the cortex (13, 14), these are based mostly on monopolar LFP recordings (39, 64), which (unlike CSD) are prone to vol- ume conduction from deep sources. Some studies in macaque cortex appear to circumvent this by reporting significant alpha- band CSD-MUA coupling in deep layers of V1, V2, and V4 (41).
However, it should be noted that these studies did not report CSD alpha power across the cortical depth [unlike another study which found that supragranular cortex had the most alpha power in each macaque primary sensory area (39)], and prior to cal- culating their directional measures, they aligned their data to peaks/troughs in the channel with the most monopolar LFP al- pha power. As this channel was likely infragranular [volume conduction leads to monopolar alpha power being spuriously maximal in deeper cortex (39)], this may have biased their results toward granular/infragranular generators. Importantly, CSD al- pha power being greatest in superficial layers is consistent with alpha-reflecting currents on the apical dendrites of supragranular or infragranular pyramidal cells; our paper resolves this ambiguity by measuring the coherence between alpha currents and MUA throughout the cortical depth and finding significant modulation of only supragranular firing by alpha currents [though a study in macaques did report modulation of granular MUA by superficial alpha CSD (39)]. Further work employing causal manipulation of infragranular cortex in animal models, as well as controlling for behavioral state and eye closure, will be needed to determine the role of deeper layers in alpha generation. How does this compare to the cortical generation of other rhythms? Slow waves, delta and theta in humans, are also strongest in superficial layers (65–67); this may indicate that, in humans, supragranular cortex plays a privileged role in sustaining low-frequency oscil- latory activity. Laminar recordings made in homologous areas and states across species will be necessary to determine if this is unique to humans, extends to primates, or is true across species.
An important limitation of our study is that only 1 of our laminar
NEUROSCIENCE
recordings was made from occipital cortex (and therefore reflected the classical posterior alpha rhythm). Despite this, all 3 laminar recordings showed a very similar profile of alpha cur- rents and HGP/MUA (Figs. 5 and 7 andSI Appendix, Fig. S11).
Though there are different sensory alphas in the cortex, our work complements other findings which find broadly similar alpha physiology across areas (39, 68, 69). However, careful work will need to be done to tease apart how alpha varies between regions.
In all, our microelectrode recordings strongly suggest that cor- tical alpha reflects short-range intracortical feedback mediated by supragranular pyramidal cells within superficial layers.
This supports an integrative function for alpha, due to the termination of widespread associative connections in superficial layers (62) and the modulatory role of layer I/II apical dendrites (66, 70). A supragranular origin for the alpha rhythm is also in accord with its putative role in neural inhibition (68), as layers I/II contain a dense interneuronal network which strongly inhibits the apical dendrites of excitatory cells throughout the cortical column (71). This short-range inhibition would allow higher-order cortex to modulate the gain of lower-order areas throughout visual cor- tex, providing a laminar circuit for top-down processes such as attention. Further studies which combine cognitive tasks with in- vasive recordings are needed to understand the implications of our findings for alpha’s behavioral role, as the physiology we de- scribe is consistent with a breadth of potential functions for alpha.
In all, we find that alpha acts within the nervous system by propagating from cortex to thalamus and higher-order to lower- order cortex, likely via short-range supragranular feedback pro- jections. These intracortical and corticothalamic dynamics could allow alpha to sculpt activity throughout the neural hierarchy.
Materials and Methods
Patients.Implantations were performed on patients with pharmacologically resistant epilepsy undergoing surgery to locate and resect seizure foci.
Laminar and ECoG recordings were made from hospitals in the United States and Hungary, and thalamocortical depth recordings were performed in France (SI Appendix, Table S1). Seventeen patients (10 female, ages 15 to 50) were informed of potential risks and told that they had no obligation to participate in the study, as well as being informed that their decision to participate wouldn’t affect their clinical care. Experiments were made with fully informed consent as specified by the Declaration of Helsinki and were approved by local institutional review boards (IRBs). These boards included the Partners Health Care IRB, the New York University Medical Center IRB, the Stanford University IRB, the RIKEN Ethics Committee, and the Hungarian Medical Scientific Council. All decisions concerning macroelectrode place- ment were made solely on a clinical basis, whereas laminar microelectrodes were inserted into cortex likely to be resected.
Patients were numbered according to their modality (E# for ECoG, S# for SEEG/macroelectrode depth, and L# for laminars). Numbering for patients was started anew for each measurement modality, and no patients had more than 1 kind of electrode (ECoG, SEEG, or laminar) analyzed with the exception of L3 (no corresponding ECoG number).
All recordings other than those during our eye-closure task were made of spontaneous activity during quiet wakefulness, in which the patient was not engaged in a cognitive task.
General Analysis Procedures. Recordings were analyzed by using custom MATLAB scripts with the CircStat (72) and Fieldtrip (73) Toolboxes.
Prior to further analysis, the raw data were visually inspected for artifacts due to machine noise, patient movement, or epileptiform activity. Epochs containing these artifacts (as judged by an expert neurologist) were removed prior to further analysis.
Unless otherwise specified, all analyses of alpha-band effects refer to the 7- to 13-Hz band. Error bars correspond to the SEM.
Power and cross-spectral densities were found via the multitaper method.
This was performed by applying a Hanning taper and then taking the Fourier transform of the zero-meaned data.
Coherence (Fig. 4EandSI Appendix, Figs. S10Aand S13) was calculated by using the ft_connectivity function, which defines the coherence between mean subtracted time seriesxandyasCohðx,yÞ=
SxxSxySyy
, whereSxyis the
cross-spectral density betweenxandyandSxxis the autospectral density of x(74) (SI Appendix,SI Methods).
To derive alpha and high-gamma amplitude as well as alpha phase, we used the Hilbert transform. First, data were filtered by using a 2-pass 4th- order IIR Butterworth filter. Then, the analytic signalz(t) was found by ap- plying the Hilbert transform to the filtered signal of each channel. The phase seriesφ(t) was found by taking the angle of the analytic signal, and the amplitudeA(t) of every channel was found by taking the real component of the analytic signal.
As a second measure of the alpha rhythm’s effects on neural HGP and MUA, we used Tort’s MI (29) (Figs. 6Dand 7BandSI Appendix, Fig. S10B) with a nonparametric trial shuffling procedure to assess significance (SI Appendix,SI Methods).
Traveling Waves.We utilized 4.54±0.87 min (mean±SD) of ECoG recordings made for clinical purposes. These arrays had 2-mm contact diameters and 1-cm intercontact spacing and were referenced to 1 to 4 inactive electrodes placed outside of the dura facing the skull. In Pts. E1, E3, and E4, patients were instructed to open and close their eyes with an audial cue at 15-s in- tervals using Presentation software (Neurobehavioral Systems). We only utilized activity during eye closure in these patients (except forSI Appendix, Fig. S4). In Pts. E2 and E5 (who didn’t participate in the eye-closure task), we analyzed spontaneous activity during quiet wakefulness. We also analyzed 16.5 min of open-source ECoG recordings made from a macaque monkey during an eye-closure task. Eyes were closed via a sleep mask for 10 min, and the sleep mask was then removed for 10 min of data. The macaque was included in group statistics with other patients due to its high similarity with human activity (SI Appendix, Fig. S4). Further details concerning the ma- caque recording can be found atNeurotycho.org(21). Time-domain data in Pts. E1 and E5 were spatially interpolated in missing channels [using inpaint_nans (75)] prior to further analysis.
To localize contacts to the pial surface, we aligned a preoperative MRI with a structural MRI or computed tomography (CT). These contact locations were then displayed on the reconstructed cortical surface, created by using Freesurfer (76), of each individual patient (Figs. 1 and 2) (77, 78).
Traveling wave analyses were performed separately for the strip and grid ECoG arrays in the macaque, as well as the 2 strips in Pt. E1, as the large cortical distances between the electrodes would make phase differences difficult to interpret.
We then wished to measure the directionality of these traveling waves. To do this, we employed the phase-gradient ∇, found by using MATLAB’s gradient function (but with subtractions replaced with circular distances). To prove that there was a consistent directionality of propagation across time, at each time point, we found the mean direction of the gradient throughout the grid. Using Rayleigh’s test for nonuniformity demonstrated that each patient had a significant propagation direction (SI Appendix, Fig. S4). To generate Fig. 2D, we binned the traveling-wave directions across time into 100 bins normalized within patients (i.e., divided the count of each bin by the total number of time points) and then averaged across patients (with the error bar being the SEM across patients).
To find instantaneous speeds across time, the grid’s instantaneous fre- quency first needed to be estimated. This was done by taking the first de- rivative of the instantaneous alpha phase over time (SI Appendix, SI Methods). Instantaneous speeds were then calculated as follows: Each channel’s instantaneous frequency was divided by the magnitude of its phase gradient ð ffiffiffiffiffiffiffiffiffiffiffiffiffiffiffiffiffi
∇2x+∇2y
q Þ, yielding the instantaneous speed at each
channel and time point. Then, at each time point, the median speed and frequency across all channels was found, and time points with a speed or frequency in the top or bottom 0.5th percentile were rejected to eliminate outliers. The distribution of these median speeds across time was then plotted as a normalized histogram (bin width of 0.01 m/s) for each patient and presented inSI Appendix, Fig. S4. These normalized histograms were averaged and plotted in Fig. 2C.
To ensure that this effect was specific to the alpha band, we reapplied our main analysis to 2-Hz filtered bands with 1-Hz spacing from 1 to 35 Hz and found the resultant vector length of propagation direction across all time points. A clear alpha peak was observed (SI Appendix, Fig. S3).
Corticothalamic Interactions. SEEG (79) was performed on 9 patients to characterize epileptogenic activity and inform possible resections. SEEG macroelectrode depth probes had 10–15 contacts; each contact was 2 mm long and 0.8 mm in diameter with 1.5-mm intercontact spacing. The probes themselves were∼5 cm long, with the exact length varying between electrodes.
In Pts. S1 to S7, contact locations were found by stereotactic teleradiographs