intramuscular injection of cefquinome in Arabian camel calves
ABDULLAH ALTAYBAN
1, MAHMOUD KANDEEL
1,2p, YUKIO KITADE
3,4and MOHAMMED AL-NAZAWI
11Department of Physiology, Biochemistry and Pharmacology, King Faisal University, Al Hofuf, Al Ahsa, 31982, Saudi Arabia
2Department of Pharmacology, Faculty of Veterinary Medicine, Kafrelshiekh University, Kafrelshiekh, Egypt
3Department of Applied Chemistry, Faculty of Engineering, Aichi Institute of Technology, Yachigusa, Yakuza, Toyota, Japan
4Department of Chemistry and Biomolecular Science, Faculty of Engineering, Gifu University, Yanagido, Gifu, Japan
Received: March 29, 2019 • Accepted: September 25, 2019 Published online: May 8, 2020
ABSTRACT
This study was conducted to evaluate the pharmacokinetics of cefquinome in camel calves after a single intramuscular injection in a dose of 2 mg/kg body weight (kg b. w.). Cefquinome concentrations were measured by ultra-high performance liquid chromatography–mass spectrometry (UPLC-MS/MS). A non-compartmental pharmacokinetic model was used tofit the time–concentration curve and estimate the pharmacokinetic parameters. The peak serum concentration (Cmax) was 28.4mg/mL at the time of maximum concentration (Tmax) of 25 min. The elimination half-life (t1/2) was 17.4 h. The area under the concentration–time curve (AUC0–∞) was 103.7mg/ml1h and the mean residence time (MRT0–∞) was 21.3 h. In comparison with other animal species, the pharmacokinetics of cefquinome in Arabian camel calves showed faster absorption from the site of injection and slower elimination. Since cef- quinome, as other beta-lactams, is a time-dependent antimicrobial agent, a single dose of 2 mg/kg b. w.
might be sufficient against the most sensitive organisms in camel calves owing to its prolonged elim- ination phase. However, dose readjustment is required for cases needing concentrations above 2mg/mL for 12 h or above 1mg/mL for 24 h.
KEYWORDS
cefquinome, camel, pharmacokinetics, UPLC-MS/MS, cephalosporins
INTRODUCTION
Cephalosporins are an important class of therapeutic agents with wide applications in vet- erinary medicine (Caprile, 1988;Hornish and Katarski, 2002;Wang et al., 2017). Cefquinome is a fourth-generation cephalosporin with proven broad-spectrum activity against Gram- positive and Gram-negative bacteria includingEscherichia coli(Zhao et al., 2017),Klebsiella pneumonia (Qu et al., 2018), Actinobacillus pleuropneumoniae (Zhang et al., 2018), Pas- teurella(Zhang et al., 2019), andStaphylococcus aureus(Yu et al., 2016).
Owing to the wide range of microorganisms susceptible to cefquinome, this drug is highly recommended for treating complex infections during mastitis (Yu et al., 2016;Bachmann et al., 2018), endometritis (Amiridis et al., 2003), respiratory infections (Funaki et al., 2001), and septicaemia (Thomas et al., 2004). The pharmacokinetics of cefquinome were previously estimated in sheep (Corum et al., 2019), rabbits (Elazab et al., 2018), buffalo calves
Acta Veterinaria Hungarica
68 (2020) 1, 59-64 DOI:
10.1556/004.2020.00008
© 2020 Akademiai Kiado, Budapest
ORIGINAL ARTICLE
*Corresponding author. Tel.: 00966 56 891 8734.
E-mail:mkandeel@kfu.edu.sa;
mahmoud.kandeal@vet.kfs.edu.eg
(Venkatachalam et al., 2018b), slider turtles (Uney et al., 2018), swans (Zhao et al., 2017), horses (Uney et al., 2017), beagle dogs (Zhou et al., 2015), andfish (Shan et al., 2015).
Although the pharmacokinetics of cefquinome has been studied in several animal species, its applications and pharmacokinetic parameters in camel calves have not been determined. The aim of this study was to determine the pharmacokinetics of cefquinome in order to enable its proper therapeutic use in Arabian camel calves.
MATERIALS AND METHODS
Animals and facilities
Three male Arabian camel calves (age: 4 months, body weight: 100 kg) were used in this study. The camels were kept in the premises of the Camel Research Centre, King Faisal University. Twelve hours before the experiment, food was withdrawn. Drinking water was freely available.
Chemicals and drugs
All animal procedures were approved by the Ethics Com- mittee of King Faisal University (approval no. KFU-REC/
2018-11-2). Cefquinome (Cobactan 2.5%, MSD Animal Health, Cairo, Egypt) was injected intramuscularly at a dose rate of 2 mg/kg b. w.; a similar dose had been used in buffalo calves (Venkatachalam et al., 2018a) as well as sheep and goats (El-Hewaity et al., 2014). Acetonitrile, methanol and ammonium acetate for UPLC were purchased from Sigma- Aldrich (St. Louis, MO, USA). The product was approved for the treatment of pneumonia in cattle and pigs as well as mastitis-metritis-agalactia syndrome in pigs.
Collection of samples
Venous blood samples were collected from the left jugular vein in 10-mL tubes immediately before injection of the drug and 0, 5, 10, 15, 30 min and 1, 2, 4, 6, 12 and 24 h after drug administration. Blood samples were immediately centrifuged and the serum was stored at808C until the determination of cefquinome concentration.
Instrumentation and chromatographic conditions
Ultra-high performance liquid chromatography (UPLC-MS/
MS) was performed using a Waters Acquity UPLC system (Waters Corp., MA, USA) consisting of a Waters Acquity BEH C18 column, an autosampler and a quaternary solvent management system. Mass spectrometry was performed using Waters Acquity Micromass triple-quadrupole MS
quadrupole supplied with an electrospray ion source (Micromass, Manchester, UK), under the control of a MassLynx 4.1 software. The multiple reaction monitoring (MRM) mode of the mass spectrometer was implemented with a positive electrospray ionisation (ESIþ) source. The quantitative ion was from the most abundant ion. Cefqui- nome was confirmed from the other ions (Table 1). The setting of nebulisation and cone gas was 800 L/h at 4508C and 50 L/h with source and dissolution temperatures of 150 8C and 450 8C, respectively. The capillary voltage was 3.2 kV. Detection was carried out in MRM mode for each compound as adapted fromHou et al. (2013), UCT Appli- cation Note (2014)andWang et al. (2017). The collision gas was argon with a collision cell pressure of 0.11 PSI.
Sample preparation was performed as described previ- ously (Legrand et al., 2016; Wang et al., 2017) with slight modifications. Stock standard solutions (25
m
g/mL in water) of cefquinome were prepared and stored at 30 8C. A standard mix solution containing cefquinome at 5m
g/mLwas then prepared by dilution in MilliQ water. Calibration standards were prepared for cefquinome in the following final concentrations: 3.125, 6.25, 12.5, 25, 37.5 and 150 ng/mL.
The sample was separated on a Waters AcquityÔBEH C18 column (2.1350 mm, 1.7
m
m). The gradient elution using mobile phase A was composed of 0.1% formic acid in water containing 0.5 mM ammonium acetate, while mobile phase B consisted of 0.1% formic acid in methanol con- taining 0.5 mM ammonium acetate. A flow rate of 0.30 mL/min was maintained for the analysis time of 4 min.The gradient elution program was set to start with 85:15 solutions A:B (v/v) and deliver 15:85 A:B (v/v) within 4 min.
The method was validated for selectivity, sensitivity, linearity, precision, accuracy and stability. The selectivity of the method was evaluated by comparing the blank samples of the chromatograms and the samples with cefquinome.
Sensitivity applies for LLOQ (lower limit of quantification), where the response of LLOQ was more than five times higher than the blank at the same retention time of cef- quinome. Detection was carried out in MRM mode adapted from Hou et al.(2013), UCT Application Note 5109-02-01 (2014)and Legrand et al. (2016). Using the signal-to-noise method, the peak-to-peak noise around cefquinome reten- tion time was measured, then the value of noise to signal ratios was estimated for each compound by the auto- integrator of the instrument software. A signal-to-noise ratio (S/N) of three is generally accepted for estimating LOD and a S/N of ten is used for estimating LOQ. For linearity, several concentrations of cefquinome were prepared to contain
Table 1.Multiple reaction monitoring (MRM) transition parameters of cefquinome
Compound Precursor Q1/CE Q2/CE Cone voltage Q2/Q1 ratio RT
Cefquinome 529 134/25 125/35 20 16.47 2.03
Q1: quantitative ion; Q2: qualitative ion; CE: collision energy; RT: retention time.
0.195 ppb–150 ppb. These solutions were analysed and the peak areas were calculated. The calibration curve was plotted using peak area vs. concentration of the standard solutions.
The obtained correlation coefficient was r50.998686, r25 0.997373, and the calibration curve was 499.822 * x þ 117.284. The precision applies to by intra- and inter-day precision, which includes six replicates at each LLOQ, low quality control (LQC), middle quality control (MQC) and high quality control (HQC) levels, each on the same analytical run. Inter-assay precision and accuracy were calculated after repeated analysis in three different analytical runs. Accuracy of the method was determined by recovery experiments. The relative recovery of cefquinome compares the recovered amount of cefquinome after adding a known quantity.
Fifty-
m
L aliquot serum samples were deproteinised with 350m
L acetonitrile. After thorough vortex mixing for 1 min, the mixtures were centrifuged at 13,000 rpm for 10 min. Aliquots of the supernatant (350m
L) were transferred to glass tubes and evaporated at 40 8C under a gentle stream of nitrogen. The residues were dissolved in 100m
Lof the mixture of mobile phase A and B (9:1, v/v). Finally, 20
m
L of the solution was injected into the UPLC–MS/MS system.Pharmacokinetic analysis
The pharmacokinetic model for the intramuscular injection of cefquinome was tested by nonlinear curve fitting analysis.
Several curve-fitting models were implemented, including non-compartment, one- or two-compartment extravascular models. The data were best fitted by a non-compartment model with the aid of PKsolver Excel add-on software (Zhang et al., 2010). The following pharmacokinetic
parameters were computed: t1/2, biological half-life time;
Cmax, peak serum level; Tmax, peak time; AUC, area under the serum concentration versus time curve; Cp0, theoretical serum level at zero time; MRT, mean residence time; and Cl, clearance rate (Table 2). Since MIC values of cefquinome against important pathogens of camel calves are not avail- able, the MIC50 values from other animal species were retrieved (Table 3). The obtained serum concentrations from this study at 12 and 24 h after cefquinome administration were compared with the retrieved MIC50values of bacterial pathogens, to help determine the folds of cefquinome con- centrations above the required MIC50.
RESULTS
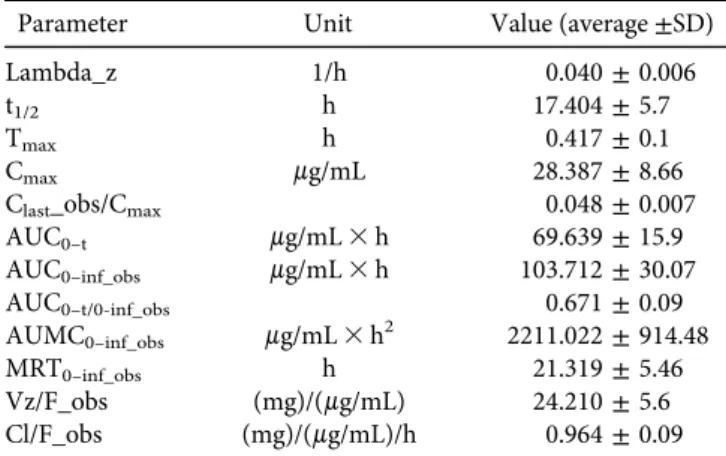
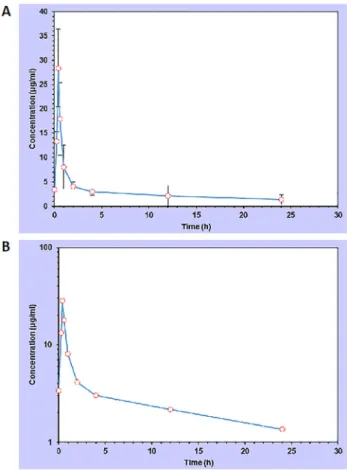
The progression of serum dose–concentration curves for cefquinome (2 mg/kg b. w. im.) in camel calves is shown in Fig. 1. Following administration, the drug was rapidly absorbed with a Cmax 528.39
m
g/mL and the Tmaxwas 25 min. The drug concentration gradually declined to about 2m
g/mL at 12 h. After 12 h the concentration of cefquinome was almost linear just above 1m
g/mL until the end of the sampling time at 2 h. The pharmacokinetic parameters are shown inTable 2. MRT was 21.319 h, AUC0–t was 69.639, the elimination half-live (t1/2λz) was 0.7 and the total body clearance was 0.964 mL h1mg1. The apparent volume of distribution at steady state during extravascular adminis- tration (Vz/F_obs) was 24.2.DISCUSSION
The fitting model for cefquinome pharmacokinetics was best expressed by using the two-compartment model in buffalo calves (Venkatachalam et al., 2018a), sheep and goats Table 2.Pharmacokinetic parameters obtained for cefquinome (2
mg/kg b. w.) after intramuscular injection to camel calves (n53)
Parameter Unit Value (average±SD)
Lambda_z 1/h 0.040±0.006
t1/2 h 17.404±5.7
Tmax h 0.417±0.1
Cmax mg/mL 28.387±8.66
Clast_obs/Cmax 0.048±0.007
AUC0–t mg/mL3h 69.639±15.9
AUC0–inf_obs mg/mL3h 103.712±30.07
AUC0–t/0-inf_obs 0.671±0.09
AUMC0–inf_obs mg/mL3h2 2211.022±914.48
MRT0–inf_obs h 21.319±5.46
Vz/F_obs (mg)/(mg/mL) 24.210±5.6
Cl/F_obs (mg)/(mg/mL)/h 0.964±0.09
Lambda_z: individual estimate of the terminal elimination constant; t1/2: biological half-life; Cmax: peak serum level; Tmax: peak time; AUC: area under serum concentration versus time curve;
AUMC: area under thefirst moment curve; Cp0: theoretical serum level at zero time; MRT: mean residence time; Vz/F_obs: apparent volume of distribution during terminal phase after non-intravenous administration.
Table 3.Calculated relationship of the concentration of cefquinome (2 mg/kg b. w. IM) with its estimated MIC50values for selected
microorganisms (Murphy et al., 1994)
MIC50 12 h 24 h
Cefquinome concentration/MIC50 Staphylococcus epidermidis 0.5 382.90 0.27 Staphylococcus aureus
(oxacillin resistant)
8 23.93 4.26
Enterococcusspecies 8 23.93 4.26
Enterococcus faecalis 4 47.86 2.13
Acinetobacterspecies 1 191.45 0.53
Pseudomonas aeruginosa 2 95.72 1.07
Ampicillin-resistant
Haemophilus influenzae 0.5 382.90 0.27
Streptococcus pneumoniae 0.06 3190.81 0.03
Gram-positive anaerobes 1 191.45 0.53
Escherichia coliOXA-1 1 191.45 0.53
Escherichia coliSHV-2 16 11.97 0.53
(El-Hewaity et al., 2014), the one-compartment model in adult camels (Al-Taher, 2010) and goats (Champawat et al., 2018), and the non-compartmental model in rabbits (Elazab et al., 2017).
The time of maximum serum concentration in this study indicates rapid absorption of cefquinome from the injection site in camel calves as the estimated Tmaxwas 25 min. This is greatly different from adult camels, which have a Tmaxvalue of 4.25 h (Al-Taher, 2010). Interestingly, this value is very similar to the Tmax in buffalo calves, which was reported to be 0.5 h (Venkatachalam et al., 2018a). Adult sheep and goats showed a Tmax of 1.6 h (El-Hewaity et al., 2014). This might indicate the rapid absorption of cefquinome in camel or buffalo calves compared with adults. Camel calves showed a longer elimination half-life (17.4 h) than did buffalo calves, sheep and cattle in which this value was 3.56, 3.91 and 1.5 h, respectively (Uney et al., 2011; Dinakaran et al., 2013;
Venkatachalam et al., 2018a).
Our study indicates extremely high cefquinome Cmaxin camel calves (28.39
m
g/mL). This value is higher than that found in sheep (4.36m
g/mL;Rana et al., 2015), goats (4.83m
g/mL;Dumka et al., 2013) and dogs (4.83m
g/mL;Zhou etal., 2015). This indicates rapid and high absorption of cef- quinome from the injection site in camel calves.
The estimated body clearance in camel calves was 0.964 mL h1 mg1, which is higher than reported in other animals such as goats (0.14; Champawat et al., 2018) or healthy rabbits (0.25; Elazab et al., 2018). Similarly, camel calves showed a noticeable increase in MRT (21.3 h). The MRT was found to be 9.14 h in sheep (Rana et al., 2015), 14 h in sheep and 15 h in goats (El-Hewaity et al., 2014).
Interestingly, adult camels showed an MRT of 16.7 (Al- Taher, 2010). This suggests that the MRT of cefquinome is generally higher in camels than in other species. The Vz/
F_obs was 24.2. Although Vz is less competent than Vd in describing the volume of distribution, it can be used for roughly indicating the general medium distribution of cef- quinome in camel calves.
Comparing the pharmacokinetics of cefquinome in camel calves and adult camels, the calves showed a very rapid absorption from the injection site, higher maximal plasma concentration, higher elimination half-life, higher area under curve of drug concentration–time relationship and longer mean residence time.
Cefquinome has a broad spectrum of activity against a wide range of Gram-positive and Gram-negative bacteria (Limbert et al., 1991). Table 3 shows the MIC50 of cefqui- nome against some selected microorganisms (Murphy et al., 1994). The time–concentration curve produced in this study was used to calculate the number of times of serum cef- quinome concentrations above the MIC50after 12 and 24 h.
After 12 h, cefquinome had a serum concentration 11–3190 times higher than the estimated MIC50 values. In this context, the level of cefquinome at 12 h was about 11.97 times higher than the MIC50forE. coliSHV-2 and 3190.81 times higher than the MIC50forStreptococcus pneumoniae.
After 24 h, the cefquinome concentration dropped to less than one time the MIC50values for most microorganisms (Table 2). The estimated IC50 against clinically important pathogens such asE. coli,S. aureus,Streptococcus agalactiae and Str. uberis was in the range from 0.001 to 4
m
g/mL(Ehinger et al., 2006; Tenhagen et al., 2006). The concen- tration of cefquinome in camel calves remains above 2
m
g/mL for 12 h and above 1
m
g/mL for 24 h, which might be sufficient for treating the most sensitive microorganisms.However, microorganisms with estimated MIC values above 4
m
g/mL require additional dose adjustments. Based on the obtained pharmacokinetic data, bacteria with MIC values of 8m
g/mL or higher will not be affected by the drug, as cef- quinome concentrations above 4m
g/mL were detected only during the first 2 h after administration.In conclusion, camel calves have distinct pharmacoki- netic properties for cefquinome. The estimated parameters showed large deviations from the values determined in adult camels and were not in complete alignment with the values found in young animals of other species either. While the serum concentrations initially show high levels, after 24 h the concentration drops to about 1
m
g/mL, which might not be effective against a wide range of microorganisms.Therefore, dose adjustment taking into consideration the MIC values for the targeted microorganisms is recom- mended.
Figure 1.Progression of the dose-response curve (A) and semi- logarithmic graph (B) for cefquinome im. injection (2 mg/kg b. w.)
in camel calves
ACKNOWLEDGEMENT
The authors acknowledge the Deanship of Scientific Research at King Faisal University for the financial support under Nashir Track (Grant No. 186252).
REFERENCES
Al-Taher, A. (2010): Pharmacokinetics of cefquinome in camels. J.
Anim. Vet. Adv.9, 848–852.
Amiridis, G., Fthenakis, G., Dafopoulos, J., Papanikolaou, T. and Mavrogianni, V. (2003): Use of cefquinome for prevention and treatment of bovine endometritis. J. Vet. Pharmacol. Therapeut.
26, 387–390.
Bachmann, J., Helmschrodt, C., Richter, A., Heuwieser, W. and Bertulat, S. (2018): Residue concentration of cefquinome after intramammary dry cow therapy and short dry periods. J. Dairy Sci.101, 7540–7550.
Caprile, K. A. (1988): The cephalosporin antimicrobial agents: a comprehensive review. J. Vet. Pharmacol. Therapeut.11, 1–32.
Champawat, M., Sankhala, L., Sharma, P. and Gaur, A. (2018):
Effect of flunixin co-administration on pharmacokinetics of cefquinome following intramuscular administration in goats.
Pharma. Innov.7, 480.
Corum, O., Corum, D. D., Er, A. and Uney, K. (2019): Pharma- cokinetics of cefquinome after single and repeated subcutane- ous administrations in sheep. J. Vet. Pharmacol. Therapeut.42, 647–653.
Dinakaran, V., Dumka, V. K., Ranjan, B., Balaje, R. and Sidhu, P. K.
(2013): Pharmacokinetics following intravenous administration and pharmacodynamics of cefquinome in buffalo calves. Trop Anim. Health Prod.45, 1509–1512.
Dumka, V. K., Dinakaran, V., Ranjan, B. and Rampal, S. (2013):
Comparative pharmacokinetics of cefquinome following intra- venous and intramuscular administration in goats. Small Rumin. Res.113, 273–277.
Ehinger, A. M., Schmidt, H. and Kietzmann, M. (2006): Tissue distribution of cefquinome after intramammary and‘systemic’
administration in the isolated perfused bovine udder. Vet. J.
172, 147–153.
El-Hewaity, M., Abd El Latif, A., Soliman, A. and Aboubakr, M.
(2014): Comparative pharmacokinetics of cefquinome (Cobac- tan 2.5%) following repeated intramuscular administrations in sheep and goats. J. Vet. Med.2014, 949642.
Elazab, S. T., Schrunk, D., Griffith, R. W., Ensley, S. M., Dell’Anna, G., Mullin, K., Elsayed, M. G., Amer, M. S., El-Nabtity, S. M.
and Hsu, W. H. (2017): Pharmacokinetics of cefquinome in healthy andPasteurella multocida-infected rabbits. Faseb. J.31, lb610.
Elazab, S. T., Schrunk, D. E., Griffith, R. W., Ensley, S. M., Dell’- Anna, G., Mullin, K., Elsayed, M. G., Amer, M. S., El-Nabtity, S.
M. and Hsu, W. H. (2018): Pharmacokinetics of cefquinome in healthy and Pasteurella multocida-infected rabbits. J. Vet.
Pharmacol. Therapeut.41, 374–377.
Funaki, H., Uzuka, Y., Tanabe, S., Iwahara, K., Takaichi, Y., Kusano, K. -I. and Sarashina, T. (2001): Therapeutic efficacy of
cefquinome against acute respiratory disease in Holstein steers.
J. Jpn. Vet. Med. Assoc.54, 451–454.
Hornish, R. E. and Katarski, S. F. (2002): Cephalosporins in veterinary medicine–ceftiofur use in food animals. Curr. Top.
Med. Chem.2, 717–731.
Hou, X. L., Wu, Y. L., Lv, Y., Xu, X. Q., Zhao, J. and Yang, T.
(2013): Development and validation of an ultra-high perfor- mance liquid chromatography tandem mass spectrometry method for determination of 10 cephalosporins and desace- tylcefapirin in milk. J. Chromatogr. B Analyt. Technol. Biomed.
Life Sci.931, 6–11.
Legrand, T., Vodovar, D., Tournier, N., Khoudour, N. and Hulin, A.
(2016): Simultaneous determination of eight beta-lactam antibi- otics, amoxicillin, cefazolin, cefepime, cefotaxime, ceftazidime, cloxacillin, oxacillin, and piperacillin, in human plasma by using ultra-high-performance liquid chromatography with ultraviolet detection. Antimicrob. Agents Chemother.60, 4734–4742.
Limbert, M., Isert, D., Klesel, N., Markus, A., Seeger, K., Seibert, G.
and Schrinner, E. (1991): Antibacterial activitiesin vitroandin vivoand pharmacokinetics of cefquinome (HR 111V), a new broad-spectrum cephalosporin. Antimicrob. Agents Chemo- ther.35, 14–19.
Murphy, S. P., Erwin, M. E. and Jones, R. N. (1994): Cefquinome (HR 111V) in vitro evaluation of a broad-spectrum cephalo- sporin indicated for infections in animals. Diagn. Microbiol.
Infect. Dis.20, 49–55.
Qu, S., Dai, C., Zhu, J., Zhao, L., Li, Y. and Hao, Z. (2018): Cef- quinome-loaded microsphere formulations against Klebsiella pneumoniae infection during experimental infections. Drug Deliv.25, 909–915.
Rana, M. P., Sadariya, K. A. and Thaker, A. M. (2015): Effect of tolfenamic acid co-administration on pharmacokinetics of cefquinome following intramuscular administration in sheep.
Vet. Arh.85, 283–292.
Shan, Q., Zhu, X., Liu, S., Bai, Y., Ma, L., Yin, Y. and Zheng, G.
(2015): Pharmacokinetics of cefquinome in tilapia (Oreochro- mis niloticus) after a single intramuscular or intraperitoneal administration. J. Vet. Pharmacol. Therapeut.38, 601–605.
Tenhagen, B. A., Koster, G., Wallmann, J. and Heuwieser, W.
(2006): Prevalence of mastitis pathogens and their resistance against antimicrobial agents in dairy cows in Brandenburg, Germany. J. Dairy Sci.89, 2542–2551.
Thomas, E., Roy, O., Skowronski, V., Zschiesche, E., Martin, G. and Bottner, A. (2004): Comparative field efficacy study between cefquinome and gentamicin in neonatal calves with clinical signs of septicaemia. Rev. Med. Vet.155, 489–493.
UCT Application Note 5109-02-01 (2014): A determination of veterinary drug residues in milk using polymeric SPE and UHPLC-MS/MS analysis.
Uney, K., Altan, F., Altan, S., Erol, H., Arican, M. and Elmas, M.
(2017): Plasma and synovialfluid pharmacokinetics of cefqui- nome following the administration of multiple doses in horses.
J. Vet. Pharmacol. Therapeut.40, 239–247.
Uney, K., Altan, F., Cetin, G., Aboubakr, M., Dik, B., Sayin, Z., Er, A. and Elmas, M. (2018): Pharmacokinetics of cefquinome in red-eared slider turtles(Trachemys scripta elegans) after single intravenous and intramuscular injections. J. Vet. Pharmacol.
Therapeut.41, e40–e44.
Uney, K., Altan, F. and Elmas, M. (2011): Development and vali- dation of a high-performance liquid chromatography method for determination of cefquinome concentrations in sheep plasma and its application to pharmacokinetic studies. Anti- microb. Agents Chemother.55, 854–859.
Venkatachalam, D., Dumka, V. and Ranjan, B. (2018a): Pharma- cokinetics of a single intramuscular injection of cefquinome in buffalo calves. J. Vet. Pharmacol. Therapeut.41, 155–158.
Venkatachalam, D., Dumka, V. K. and Ranjan, B. (2018b): Phar- macokinetics of a single intramuscular injection of cefquinome in buffalo calves. J. Vet. Pharmacol. Therapeut.41, 155–158.
Wang, J., Fan, X., Liu, Y., Du, Z., Feng, Y., Jia, L. and Zhang, J.
(2017): Extraction optimization of sixteen cephalosporins in milk byfiltered solid phase extraction and ultra-high pressure liquid chromatography coupled to tandem mass spectrometry.
Anal. Methods9, 1282–1289.
Yu, Y., Zhou, Y. F., Chen, M. R., Li, X., Qiao, G. L., Sun, J., Liao, X.
P. and Liu, Y. H. (2016):In vivopharmacokinetics/pharmaco- dynamics of cefquinome in an experimental mouse model of Staphylococcus aureusmastitis following intramammary infu- sion. PLoS One11, e0156273.
Zhang, L., Wu, X., Huang, Z., Kang, Z., Chen, Y., Shen, X., Cai, Q.
and Ding, H. (2019): Pharmacokinetic/pharmacodynamic inte- gration of cefquinome againstPasteurella multocidain a piglet tissue cage model. J. Vet. Pharmacol. Therapeut.42, 60–66.
Zhang, L., Wu, X., Huang, Z., Zhang, N., Wu, Y., Cai, Q., Shen, X.
and Ding, H. (2018): Pharmacokinetic/pharmacodynamic assessment of cefquinome against Actinobacillus pleuro- pneumoniae in a piglet tissue cage infection model. Vet.
Microbiol.219, 100–106.
Zhang, Y., Huo, M., Zhou, J. and Xie, S. (2010): PKSolver: an add- in program for pharmacokinetic and pharmacodynamic data analysis in Microsoft Excel. Comput. Methods Progr. Biomed.
99, 306–314.
Zhao, D. H., Wang, X. F., Wang, Q. and Li, L. D. (2017): Phar- macokinetics, bioavailability and dose assessment of cefqui- nome againstEscherichia coliin black swans (Cygnus atratus).
BMC Vet. Res.13, 226.
Zhou, Y. F., Zhao, D. H., Yu, Y., Yang, X., Shi, W., Peng, Y. B. and Liu, Y. H. (2015): Pharmacokinetics, bioavailability and PK/PD relationship of cefquinome forEscherichia coliin Beagle dogs. J.
Vet. Pharmacol. Therapeut.38, 543–548.