Study of the Performance of Various Classifiers in Labeling Non-Functional Requirements
ITC 3/48
Journal of Information Technology and Control
Vol. 48 / No. 3 / 2019 pp. 432-445
DOI 10.5755/j01.itc.48.3.21973
Study of the Performance of Various Classifiers in Labeling Non-Functional Requirements
Received 2018/09/30 Accepted after revision 2019/07/29 http://dx.doi.org/10.5755/j01.itc.48.3.21973
Corresponding author: premissa@inf.u-szeged.hu
László Tóth
Department of Software Engineering, University of Szeged, Hungary; e-mail: premissa@inf.u-szeged.hu
László Vidács
MTA-SZTE Research Group on Artificial Intelligence, University of Szeged, Hungary; e-mail: lac@inf.u-szeged.hu
Software systems are to be developed based on expectations of the customers. These expectations are expressed using natural languages. To design software meeting the needs of the customer and the stakeholders, the inten- tions, feedback and reviews are to be understood accurately and without ambiguity. These textual inputs often contain inaccuracies, contradictions and are seldom given in a well-structured form. The issues mentioned in the previous thought frequently result in the program not satisfying the expectation of the stakeholders. In par- ticular, for non-functional requirements, clients rarely emphasize these specifications as much as they might be justified. Identifying, classifying and reconciling the requirements is one of the main duty of the System An- alyst, which without using a proper tool, can be very demanding and time-consuming. Tools which support text processing are expected to improve the accuracy of identification and classification of requirements even in an unstructured set of inputs. System Analysts can also use them in document archeology tasks where many docu- ments, regulations, standards, etc. have to be processed. Methods elaborated in natural language processing and machine learning offer a solid basis. However, their usability and the possibility to improve the performance utilizing the specific knowledge from the domain of the software engineering are to be examined thoroughly. In this paper, we present the results of our work adapting natural language processing and machine learning meth- ods for handling and transforming textual inputs of software development. The major contribution of our work is providing a comparison of the performance and applicability of the stateof-the-art techniques used in natural language processing and machine learning in software engineering. Based on the results of our experiments, tools which can support System Analysts working on textual inputs can be designed.
KEYWORDS: Requirements Engineering, Feedback processing, Natural Language Processing, Machine Learning.
433
Information Technology and Control 2019/3/48
1. Introduction
Software systems are made based on specifications composed of functional and non-functional require- ments. The needs and expectations of the customers are expressed by requirements mostly given in a natu- ral language form. These textual documents are often ambiguous and sometimes also contain contradic- tions. To use the collected requirements for software design, they must be formalized and any inconsisten- cies need to be removed. These tasks, without using a proper tool, can be demanding and time-consuming.
Tools supporting System Analysts in requirements engineering provide templates, checklists, traceabil- ity, management and reporting environment to facil- itate their work, but these tools can support process- ing of requirements given in textual form only to a limited extent [8].
Non-functional requirements (NFRs) are also cru- cial factors for software design [18]. The lack of a well-structured set of non-functional requirements can lead to an inappropriate software design and the failure of the project. Security aspects are also a critical part of the design, and their significance is growing steadily today. Every requirement related to security is to be taken into consideration, but it can be difficult without the corresponding non-function- al requirements. Many NFRs are out of the analysis and those non-functional requirements considered during analysis are often weakly elaborated. Incom- plete or ambiguous specifications can lead the system into an undefined state.
The quality of requirements is the primary factor of the success of a software project. Though, there are several problems to be faced with regarding the re- quirements. Firesmith in his article issued in Journal of Object Technology in 2007 has collected the most common issues related to requirements engineering along with some practice to solve these problems [17].
Although steps have been taken to improve the qual- ity of the specifications, unsuccessful software proj- ects are still being attributed largely to the inadequate requirements engineering [21].
As mentioned above, the requirements are available mainly in textual form. However, this is valid for ev- ery customer feedback, error ticket and specification.
In the case of a complex project, various requirements are collected from documents, regulations reports, so
System Analyst has to process a lot of documents.
These documents are well-structured and use busi- ness language. The main challenge for processing business documents is to manage texts and to iden- tify information relevant to the application being made. In addition to the business documents, the basic sources of the requirements are the interviews with clients and stakeholders. The memos or records created during interviews are often unstructured or semi-structured and often contain ambiguities, logi- cal fallacies. Non-functional requirements are most- ly given as a part of the text but sometimes they are expressed superficially. Identifying and classifying requirements from this collection of different doc- uments can be demanding and error-prone. Several investigations have been accomplished with remark- able results to support the identification and classifi- cation process using natural language processing and machine learning methods [1, 3, 4, 9, 24, 25, 33, 34].
Some researchers investigated the use of ontologies, which have been created based on the standards [3, 33]. Some researchers like Lu and Liang [25] or Abad et al. [1] utilized supervised learning methods, others utilized semisupervised learning techniques such as Expectation Maximization strategy [9]. Abad et al.
applied also clustering techniques to identify the best method for processing requirements sentences [1].
These studies have shown that natural language pro- cessing and machine learning methods can be utilized successfully also for requirements engineering.
To apply machine learning along with natural lan- guage processing (NLP) methods, several learning examples have to be available, however, there are only a few labeled examples that can be accessed via the Internet. This is especially true for the collection of non-functional requirements which are often over- looked during the requirements elicitation. The ma- jority of researchers have used the Tera Promise NFR dataset which was created by the students of DePaul University [7, 13]. This dataset contains 625 examples of 15 projects classified into 12 classes. Some classes contain only very few examples which is detrimental to machine learning methods.
One possible direction for overcoming the shortage of labeled examples is using semi-supervised meth- ods which can give better results at these conditions
as shown by Casamayor et al. [9]. Using ontologies as a background knowledge representation is another possible solution [3, 33], but building a proper ontol- ogy-based database is a tedious and time-consuming task. Rashwan et al. have created an ontology based on the ISO/IEC 9126-1:2001.1 In addition to these strategies, corpus of requirements also can be built.
Software repositories make available various open source software which can provide also sources of requirements related to the specific software [31, 32].
Extracting requirements from these repositories and building corpus can support the usage of machine learning processes effectively.
Applying NLP and machine learning methods for requirements engineering is based on the assump- tion that these methods can facilitate the work of System Analysts as reducing the amount of manual work, therefore, reduce the time needed for elicita- tion and the cost of the analysis. This assumption has also been confirmed by Groen et al. in their investi- gation [19]. To support System Analysts in choosing the appropriate procedure, investigations have been proceeded for comparison of the performance of the methods [1, 9, 25, 38]. The researchers found that Multinomial Naive Bayes and the Support Vector Machine (SVM) using the linear kernel had given the best performance using only a few labeled examples such as the NFR dataset.
Our work is focusing on comparison the methods in- cluding the application of the simplest deep neural net- work. In our former work, we have compared methods implemented in scikit-learn library [30] using the NFR dataset [38]. Our work has confirmed that the Multino- mial Naive Bayes and the SVM might be the best choice if there are only a few labeled examples available. The scikit-learn library contains also a Multilayer Percep- tron (MLP) classifier which has produced the worst result in our experiment owing to the small dataset. To ensure that the small dataset does not hinder the ex- periments, we have collected tagged posts from Stack Overflow and used them in our examinations. We have repeated the former experiments with the new dataset and also the Fully Connected Network constructed us- ing Keras library have been tested and compared to the non-deep learning methods. The applicability and the restrictions of our methodology is shown in detail in the background section.
1 This standard has been revised and a new standard was pub- lished in 2011 as the ISO/IEC 25010:2011.
The contribution of our work is providing a com- parison of the performance and applicability of the stateof-the-art techniques used in natural language processing and machine learning in software engi- neering. Additionally, the effects of the size of the dataset are also demonstrated.
The paper is organized as follows. The next section in- troduces our approach and analysis model. In Section 3, we introduce the dataset of non-functional require- ments and compare it to the dataset from Stack Over- flow. Section 4 provides the findings of our analysis produced by various classifiers and compares closely related work. The related literature is briefly presented in Section 5 and we conclude the paper in Section 6.
2. Background
The source of the requirements is the collection of business documents, laws, regulations, and records of interviews. These documents contain texts written in natural languages. In order to be able to classify these texts, they have to be pre-processed. This transforma- tion process converts the raw text into a vectorized form which can be used for machine learning proce- dures. The procedure involves common natural lan- guage techniques such as tokenization and filtering.
At the end of the procedure, the input is converted into a vectorized form. The most common representation is the tf-idf model which was used also in our experi- ments. This representation measures the importance of a given word in a given document and produces a sparse matrix as the representation of the whole text.
The measure of tf-idf is formulated as:
tfidf(t,d,D) = tf(t,d) ∗ idf(t,D),
where t denotes terms (words in our case), d denotes the document (sentences or Stack Overflow posts in our case) and D denotes the collection of documents (the set of sentences or set of posts in our case). The tf(t,d) is the term frequency in a given document. The idf (inverse document frequency) is formulated as:
.
For tokenization, we used the Keras Tokenizer [11]
which applies filtering, lower case converting and
435
Information Technology and Control 2019/3/48
splitting words before the conversion into tf-idf based vector.
Two different datasets were applied to our experi- ments. For the first tests, we used the Tera Promise NFR dataset which was constructed by the MS stu- dents of DePaul University [7, 13]. This dataset con- tains 625 requirements collected from 15 different projects. The sentences containing the requirements are classified into 12 classes from which one class rep- resents functional requirements and the other 11 class- es correspond to various types of non-functional re- quirements. The statistics about the classification and the related projects is shown in Table 1 and Figure 1.
Figure 1
Distribution of the Promise NFR dataset
The source of the second series of our experiments was a dataset queried from Stack Overflow. The data- set is composed of a sequence of tagged posts. Posts contain English texts and sometimes code fragments are occurring. Stack Overflow is an important source also for researchers. Extracting topics related to non-functional requirements is also common [5, 6, 39, 40]. We have chosen posts tagged with performance or test related labels for our experiments. Testability and the performance are very important factors for software quality and these topics are also discussed thoroughly via Stack Overflow. This dataset contains 50000 posts where 20166 posts correspond to per- formance and 30753 posts correspond to test. Stack Overflow posts are multi-labeled so 919 posts are la- beled both test and performance.
There were two different experiment series conduct- ed. The first series used the Tera Promise NFR data- set and applied a set of classifiers from scikit-learn library [38]. The second series used the dataset from Stack Overflow and also applied classifiers provided by scikit-learn and supplemented by a classifier based on a simple Neural Network solution using Keras and Tensorflow [2] background.
For evaluation, we have employed precision, recall and F1 metrics. The precision is formulated as:
,
Table 1
Requirement labels in the 15 projects of the Promise NFR dataset
Requirement type Project No
Total
1 2 3 4 5 6 7 8 9 10 11 12 13 14 15
Functional (F) 20 11 47 25 36 27 15 20 16 38 0 0 0 0 0 255
Availability (A) 1 2 2 0 2 1 0 5 1 1 2 1 1 1 1 21
Fault tolerance (FT) 0 4 0 0 0 2 0 2 0 0 0 2 0 0 0 10
Legal (L) 0 0 0 6 3 0 1 3 0 0 0 0 0 0 0 13
Look and feel (LF) 1 4 0 2 3 2 0 6 0 7 2 2 4 3 2 38
Maintainability (MN) 0 0 0 0 0 4 0 2 1 0 1 3 2 2 2 17
Operational (O) 0 0 7 6 10 15 3 9 2 0 0 2 2 3 3 62
Performance (PE) 2 6 2 2 4 1 2 17 4 4 3 5 0 1 1 54
Portability (PO) 0 1 0 0 0 0 0 0 0 0 0 0 0 0 0 1
Scalability (SC) 0 3 4 0 3 4 0 4 0 0 0 1 2 0 0 21
Security (SE) 1 3 10 10 7 5 2 15 0 1 3 3 2 2 2 66
Usability (US) 3 6 8 4 5 13 0 10 0 2 2 3 6 4 1 67
Total NFRs 8 29 33 30 37 47 8 73 8 15 13 22 19 16 12 370
Functional 20 11 47 25 36 27 15 20 16 38 0 0 0 0 0 255
Total Requirements 28 40 80 55 73 74 23 93 24 53 13 22 19 16 12 625
where tp is the true positive which is the number of correct positive classification, fp denotes the false positive which is the case when classifier accepts the example but it has to be rejected. This measure is called also as Type I error.
Recall can be formulated as:
,
where fn denotes the false negative which is the case when classifier rejects the example but it has to be ac- cepted. This measure is called also as Type II error.
The recall is also an important metric for our purpose because one of the most important usage of our work might be the identification of non-functional require- ments from their textual context and in this case, it is crucial to find them in the input. However, the preci- sion is as the essential metric as the recall. Taking into account the purpose of the classifier of non-function- al requirements the most adequate metric is the F1.
F1 is formulated as:
.
Note: F1 is a special case of F-measure with β = 1 val- ue. The F-measure is formulated as:
.
During the Stack Overflow based experiments, the calculation of the metrics has been performed using classification reports provided by the scikit-learn li- brary. The report uses the calculation methods which were applied directly in Promise based experiments.
For this former dataset, the averaged measures were calculated manually but, for dataset obtained from Stack Overflow, the average values were produced by the classification report. Four types of averages were calculated by the report which are the micro, macro, weighted and samples averages.
Let denote yl the set of label l predicted by a classifier and yˆl the set of classes with true label l. Let y = ∪yl and yˆ = ∪yˆl, where l ∈ L and L is the set of labels. Then the micro average of precision can be given as
.
The same is done for recall:
.
For macro averages, the formulas are the following:
.
Similar formulas can be used for sample averages, where S denotes the set of samples:
.
For weigted averages, the following formulas can be applied:
.
3. Experiments
As we have mentioned in the previous section, two series of experiments were performed with two dif- ferent datasets. Before the experiments datasets were preprocessed. During this transformation filtering and tokenization were applied and the resulted text was transformed into tf-idf representation.
The Promise NFR dataset contains only one label for each example but the dataset extracted from Stack Overflow is multilabeled. We selected only two la- bels (performance and test) for extraction to obtain
437
Information Technology and Control 2019/3/48
a well-balanced input. During the preprocessing the labels of dataset from Stack Overflow were also trans- formed using one-hot encoding and the labels differ- ent from our interest were filtered out.
In the first experiments, we accomplished classifi- cation processes using algorithms implemented in scikit-learn library on the dataset of Promise NFR and compared the results each other and the results obtained by Cassamayor et al. in their experiments [9]. The objective of these experiments was to deter- mine the best algorithm of classification implement- ed in scikit-learn for requirements classification tasks considering precision, recall and F-measure, complemented by execution time. For these first se- ries of experiments, we applied the following classi- fiers: Multinomial-, Gaussian- and Bernoulli Naive Bayes, Support Vector Machine with linear kernel, Linear Logistic Regression, Label Propagation, La- bel Spreading, Decision Tree, Extra Tree, K-Nearest Neighbour and Multi Layer Perceptron. The selection process was also influenced by the resource require- ments of the classifiers.
The experiments were executed using repeated K-Fold cross-validation method. Both the number of groups and the repetition number were set to 10. The classification was performed using one-versus-rest strategy for each class. Using this strategy, the exam- ined class is fitted against the other classes. Preci- sion, recall and F-measure were calculated for each test and each class by the corresponding scikit-learn method and the results were averaged for each classi- fier. Averaged variance was calculated as well and also the F-measure value was computed for every classifi- er using the averaged precision and recall because the averaged F-measure does not hold any useful infor- mation using this method of calculation.
The Stack Overflow based experiments applied Multinomial, Gaussian- and Bernoulli Naive Bayes, Support Vector Machine with linear kernel, Linear Logistic Regression, Decision Tree, Extra Tree, and K-Nearest Neighbour classifiers from scikit-learn li- brary, and the experiments were supplemented using a fully connected neural network with Keras and Ten- sorflow back-end. The MLP test was removed from this series because the implemented fully connected network gives better scalability and the applied strat- egy is similar in the two cases. The LabelPropagation
and the LabelSpreading were also removed because we experienced performance issues applying it on the Stack Overflow dataset.
The original dataset extracted from Stack Overflow contains 50000 examples which were split to a train- and a test-set. The train-set contains 35000 train- posts whereas the test-set contains 15000 posts.
The classifiers from scikit-learn were applied using one-versus-rest strategy. The precision, recall and the F1-measure were calculated for each class and the av- erages were also determined as we described it in the previous section.
The Fully Connected Network was constructed using Keras libraries and Tensorflow back-end. Our model contains 1024 units in the first layer. The number of units and the input shape can be varied, the shape has to be aligned with the dimension of tf-idf vectors. In our case, this dimension is 3000 which is the number of the selected most frequent words from the input dataset. As mentioned before, this hyperparameter can be varied, however, our experiments did not yield better results in case of the bigger dimension. In gen- eral, this parameter depends on the size of the vocab- ulary of the dataset in question.
For the purpose of the regularization, the dropout technique was applied. The dropout regularization selects a given proportion of the units randomly and inactivates them during the learning phase. The ratio of the neurons is to be inactivated is a hyperparame- ter which can be tuned during the experiments. The activation function of the first layer is the ReLU (Rec- tified Linear Unit). This function produces 0 for every negative input and any positive x it returns with that value. (Formula: f(x) = max(0,x)). The second layer is a softmax layer whose output size is the same as the number of classes under investigation. The softmax function can be written as:
,
where K is the number of classes. The formula provides a probability value for every class used in the model.
The network was trained using the categorical cross-entropy as a loss function and the adam opti- mizer [23] was applied. The equiation of categorical cross-entropy is:
,
Adam (Adaptive Moment Estimation) is a gradi- ent-based optimizer for stochastic objective func- tions which applies adaptive estimation of lower-or- der moments which help the algorithm to not stuck in a local optimum. The optimizer combines the advan- tages of AdaGrad and RMSProp methods [23]. The update rule of Adam is:
,
where mˆ t and vˆt are the second order moments which are calculated as:
,
where mt and vt are the first-order moments which are updated as:
mt= β1mt−1+ (1 − β1)gtvt= β2vt−1+ (1 − β2)gt2.
For β1, 0.9 is proposed by the authors as the default value, whereas, for β2, 0.999 and 10−8 for [23]. We used the default values for our experiments.
In addition to the performance of classifiers, the ex- ecution time was also measured during the experi- ments.
4. Results
In Table 2, the measured averages of Precision, Recall and F-measure related to the first series of our exper- iments based on the Tera Promise NFR dataset with their averaged variance are presented. As mentioned in the previous section, averaging F-measure does not hold valuable information so F-measure was comput- ed based on averages precision and recall. The averag- es of precision, recall and F-measure values and their variance are illustrated in Figure 2. For comparison purpose, the results are illustrated using line dia- grams. The results show that the SVM has produced the best precision value, however, the recall is only 65% which is the median value of the results. The Multinomial Naive Bayes and Logistic Regression have produced the best F1 values but the F1 value of the SVM is only 1% lower. As one can see in the chart, the MLP has produced the worst result. The size of Table 2
Precision, recall and F-measure values during the classification of the Promise NFR
Classifier Average Comp Variance
P R F F P R F
BernoulliNB 0.43 0.22 0.25 0.29 0.18 0.09 0.06
DT 0.66 0.64 0.62 0.65 0.01 0.03 0.01
ET 0.63 0.62 0.59 0.62 0.01 0.04 0.02
ETs 0.63 0.63 0.59 0.63 0.01 0.04 0.02
GNB 0.72 0.69 0.67 0.70 0.02 0.02 0.02
KNeighbours 0.71 0.52 0.55 0.60 0.08 0.07 0.05
LabelPropagation 0.70 0.68 0.65 0.69 0.02 0.03 0.02
LabelSpread 0.70 0.67 0.65 0.68 0.02 0.03 0.02
Logistic 0.87 0.67 0.72 0.76 0.01 0.05 0.03
MLP 0.38 0.66 0.36 0.48 0.01 0.03 0.01
MultinomialNB 0.84 0.68 0.72 0.75 0.02 0.03 0.02
SVM 0.89 0.65 0.71 0.75 0.01 0.05 0.02
439
Information Technology and Control 2019/3/48
the dataset is too small for applying the Multilayer Perceptron classifier, but this result can be explained with the underfitted model.
The variance of the measures can be seen on the right side of the chart. As one can see the Bernoulli Naive Bayes and the KNeighbours have resulted in the larg- est variance, but the top 3 classifiers (Logistic Regres- sion, Multinomial Naive Bayes and SVM) have a small variance. The average variance is relatively low, the values are lower than 5% for every metrics.
As the results of our first-series experiments pres- ent, regarding the precision the Multinomial Naive Bayes Classifier, Support Vector Machine with linear kernel and Linear Logistic Regression have produced the best values. The Naive Bayes Classifier was found also in former researches as the best classifier for classification of requirement sentences comparing it to other classifiers such as the tf-idf classifier [9], the k-Nearest Neighbour [1, 9], the Bittern Topic Model (BTM) or the Latent Dirichlet Allocation (LDA) [1].
Lu and Liang have found that the SVM classifier has performed best during their research [25].
The second series of the experiments used dataset obtained from Stack Overflow. This dataset is large enough for machine learning purpose. While the Promise NFR contains 625 examples, this dataset contains 50000 examples. The main drawback re-
garding Stack Overflow dataset is its noisy nature.
Noisiness means in our case that there are several false or off-topic posts presents in the database. Nois- iness also means that there are many code-fragments presented which have to be also filtered out.
The results of the second series of experiments (Stack Overflow) are presented in Table 3 and Table 4, re- Figure 2
Precision, recall, f-measures (left) and their variance (right) during classification of the Promise NFR Table 2. Precision, recall and F-measure values during the classification of the Promise NFR
Classifier Average Comp Variance
P R F F P R F
BernoulliNB 0.43 0.22 0.25 0.29 0.18 0.09 0.06
DT 0.66 0.64 0.62 0.65 0.01 0.03 0.01
ET 0.63 0.62 0.59 0.62 0.01 0.04 0.02
ETs 0.63 0.63 0.59 0.63 0.01 0.04 0.02
GNB 0.72 0.69 0.67 0.70 0.02 0.02 0.02
KNeighbours 0.71 0.52 0.55 0.60 0.08 0.07 0.05
LabelPropagation 0.70 0.68 0.65 0.69 0.02 0.03 0.02
LabelSpread 0.70 0.67 0.65 0.68 0.02 0.03 0.02
Logistic 0.87 0.67 0.72 0.76 0.01 0.05 0.03
MLP 0.38 0.66 0.36 0.48 0.01 0.03 0.01
MultinomialNB 0.84 0.68 0.72 0.75 0.02 0.03 0.02
SVM 0.89 0.65 0.71 0.75 0.01 0.05 0.02
Figure 2. Precision, recall, f-measures (left) and their variance (right) during classification of the Promise NFR
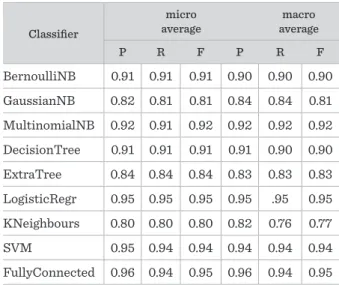
Table 3. Precision, recall and F-measure values during the classification of the dataset from Stack Overflow
Classifier micro average macro average
P R F P R F
BernoulliNB 0.91 0.91 0.91 0.90 0.90 0.90
GaussianNB 0.82 0.81 0.81 0.84 0.84 0.81
MultinomialNB 0.92 0.91 0.92 0.92 0.92 0.92
DecisionTree 0.91 0.91 0.91 0.91 0.90 0.90
ExtraTree 0.84 0.84 0.84 0.83 0.83 0.83
LogisticRegr 0.95 0.95 0.95 0.95 .95 0.95
KNeighbours 0.80 0.80 0.80 0.82 0.76 0.77
SVM 0.95 0.94 0.94 0.94 0.94 0.94
FullyConnected 0.96 0.94 0.95 0.96 0.94 0.95
Table 3
Precision, recall and F-measure values during the classification of the dataset from Stack Overflow
Classifier
micro
average macro
average
P R F P R F
BernoulliNB 0.91 0.91 0.91 0.90 0.90 0.90 GaussianNB 0.82 0.81 0.81 0.84 0.84 0.81 MultinomialNB 0.92 0.91 0.92 0.92 0.92 0.92 DecisionTree 0.91 0.91 0.91 0.91 0.90 0.90 ExtraTree 0.84 0.84 0.84 0.83 0.83 0.83 LogisticRegr 0.95 0.95 0.95 0.95 .95 0.95 KNeighbours 0.80 0.80 0.80 0.82 0.76 0.77
SVM 0.95 0.94 0.94 0.94 0.94 0.94
FullyConnected 0.96 0.94 0.95 0.96 0.94 0.95
Information Technology and Control 2019/3/48
440
Table 4
Precision, recall and F-measure values during the classification of the dataset from Stack Overflow
Classifier
weighted
average samples
average
P R F P R F
BernoulliNB 0.91 0.91 0.91 0.91 0.91 0.91 GaussianNB 0.87 0.81 0.81 0.82 0.82 0.81 MultinomialNB 0.92 0.91 0.92 0.93 0.92 0.92 DecisionTree 0.91 0.91 0.91 0.90 0.91 0.90 ExtraTree 0.84 0.84 0.84 0.80 0.85 0.80 LogisticRegr 0.95 0.95 0.95 0.95 0.96 0.95 KNeighbours 0.80 0.80 0.79 0.80 0.80 0.80
SVM 0.95 0.95 0.94 0.94 0.95 0.94
FullyConnected 0.96 0.94 0.95 0.96 0.95 0.95
spectively. The results are also illustrated in Figure 3 and in Figure 4. According to the results of the Logis- tic Regression, the SVM and the FCN have produced the best values. The FCN has yielded the strongest values of precision and F-measure in all calculated averages. However, regarding the F-measure the re- sults of Logistic Regression are the same as those of the FCN. In the case of the recall, the Logistic Regres- sion has outperformed the other classifiers, however, the results of the FCN are only 0.1% lower.
Figure 3
Average precision, recall values during classification of the dataset from Stack Overflow
Table 4. Precision, recall and F-measure values during the classification of the dataset from Stack Overflow
Classifier weighted average samples average
P R F P R F
BernoulliNB 0.91 0.91 0.91 0.91 0.91 0.91
GaussianNB 0.87 0.81 0.81 0.82 0.82 0.81
MultinomialNB 0.92 0.91 0.92 0.93 0.92 0.92
DecisionTree 0.91 0.91 0.91 0.90 0.91 0.90
ExtraTree 0.84 0.84 0.84 0.80 0.85 0.80
LogisticRegr 0.95 0.95 0.95 0.95 0.96 0.95
KNeighbours 0.80 0.80 0.79 0.80 0.80 0.80
SVM 0.95 0.95 0.94 0.94 0.95 0.94
FullyConnected 0.96 0.94 0.95 0.96 0.95 0.95
Figure 3. Average precision, recall values during classification of the dataset from Stack Overflow
Figure 4. Average F1-measure during the classification of the dataset from Stack Overflow
0 1 , 0 0,2 0,3 0,4 0,5 0,6 7 0, ,8 0
9 , 0 1
F1-measure
micro macro weighted sample
Figure 4
Average F1-measure during the classification of the dataset from Stack Overflow
P R F P R F
BernoulliNB 0.91 0.91 0.91 0.91 0.91 0.91
GaussianNB 0.87 0.81 0.81 0.82 0.82 0.81
MultinomialNB 0.92 0.91 0.92 0.93 0.92 0.92
DecisionTree 0.91 0.91 0.91 0.90 0.91 0.90
ExtraTree 0.84 0.84 0.84 0.80 0.85 0.80
LogisticRegr 0.95 0.95 0.95 0.95 0.96 0.95
KNeighbours 0.80 0.80 0.79 0.80 0.80 0.80
SVM 0.95 0.95 0.94 0.94 0.95 0.94
FullyConnected 0.96 0.94 0.95 0.96 0.95 0.95
Figure 3. Average precision, recall values during classification of the dataset from Stack Overflow
Figure 4. Average F1-measure during the classification of the dataset from Stack Overflow
0 1 , 0 0,2 0,3 0,4 0,5 0,6 7 0, ,8 0
9 , 0 1
F1-measure
micro macro weighted sample
The averages were calculated using the micro, macro, weighted and samples calculation method. The for- mulas of these methods are presented in the Section 2 of this paper. The suitability of these methods de- pends on the input. Macro averages take the values calculated for every class and calculate their average.
In the case of a well-balanced dataset, this average can be useful, but when the size of the classes varies, this method is not recommended. The micro average can be applied for any cases and it is the best choice if the size of the classes varies. If the size of the classes is also an important factor, weighted averages can be proposed. Sample averages calculate the averages of the values of the instances. As one can see in Figures 3 and 4, these values differ but can be used in a similar way to characterize classifiers.
The significance of the difference was tested using the first five classifiers, the FCN, the SVM, the Lo- gistic Regression, the Multinomial Naive Bayes and
441
Information Technology and Control 2019/3/48
the Decision Tree Classifier. For the significance test, we have applied one-way repeated measures ANOVA test. The p-value of the test is 0.000575, which is sig- nificant at p<0.05. Because the assumptions of ANO- VA as the samples are drawn from a normal distribu- tion and the variance homogeneity is not held, we also performed a repeated measures Friedman Test [14].
The p-value in this case is 0.10739 which is not sig- nificant at p<0.05. As mentioned before, the value of the F-measure is the same of the FCN and the Logistic Regression.
The variance was also calculated, however, only two classes were included in the classification. The re- sults of the calculation are shown in Table 5 and in Figure 5. The results show that Gaussian Naive Bayes has produced the biggest variance regarding the pre- cision whereas the KNN yielded the biggest value re- garding to the recall. Those classifiers, which present- ed the best values, produced also a small variance.
The results of the second series of the experiments (Stack Overflow based) confirmed the result of the first series (Tera Promise based) as the SVM and the Logistic Regression have produced the best values us- ing scikit-learn classifiers. However, Multinomial Na- ive Bayes has also given good results, its performance appeared to be a bit worse than the results of the top three. These values suggest that the linear classifiers can be applied for classifying, labeling or tagging re- quirements given in natural language form. The result of the FCN shows that if there are enough examples Table 5
Variance statistics during the classification of the dataset from Stack Overflow
Classifier Variance
P R F
BernoulliNB 0.045 0.045 0.045
GaussianNB 3.200 3.645 0.005
MultinomialNB 0.320 0.020 0.045
DecisionTree 0.045 0.080 0.045
ExtraTree 0.405 0.500 0.405
LogisticRegr 0.020 0.020 0.020
KNeighbours 0.320 6.480 1.125
SVM 0.045 0.320 0.320
FullyConnected 0.020 0.020 0.020
Figure 5. Variance statistics during the classification of the dataset from Stack Overflow
Table 5. Variance statistics during the classification of the dataset from Stack Overflow
Classifier Variance
P R F
BernoulliNB 0.045 0.045 0.045 GaussianNB 3.200 3.645 0.005 MultinomialNB 0.320 0.020 0.045 DecisionTree 0.045 0.080 0.045
ExtraTree 0.405 0.500 0.405
LogisticRegr 0.020 0.020 0.020 KNeighbours 0.320 6.480 1.125
SVM 0.045 0.320 0.320
FullyConnected 0.020 0.020 0.020 examples available, the neural network models can outperform the classic models of machine learning.
During the FCN test, we applied a simple fully connected network with the dropout regularization and the Adam optimizer. The hyperparameters such as the number of neurons, the dropout keep ratio, the batch size or the number of epochs were also adjusted, and the results were checked. The best results were achieved using 1024 neurons in the first layer, the 0.1 value for dropout parameter and
0 1 , 0 0,2 0,3 0,4 0,5 0,6 7 0, ,8 0
9 , 0 1
F1-measure
micro macro weighted sample
0 1 2 3 4 5 6 7
Variance
Precision Recall F-measure
Figure 5
Variance statistics during the classification of the dataset from Stack Overflow
available, the neural network models can outperform the classic models of machine learning.
During the FCN test, we applied a simple fully con- nected network with the dropout regularization and the Adam optimizer. The hyperparameters such as the number of neurons, the dropout keep ratio, the batch size or the number of epochs were also adjust- ed, and the results were checked. The best results were achieved using 1024 neurons in the first layer, the 0.1 value for dropout parameter and 100 for batch size. The training phase contained 3 epochs. The maximum difference between the worst and the best results was only 0.2% during the parameter changes.
As mentioned in the previous sections, the execution time was also measured for every classifier during both series of the experiments. Execution time is also an important factor for practice which can help System Analyst to choose the appropriate tool for requirement elicitation. The values of the execution time of the second series of our experiments are pre- sented in Table 6. The two series of the experiments were performed in a different hardware context, therefore, the results cannot be compared. The sec- ond series, however, provides useful information about the expectable execution time using a standard desktop environment with Intel I7-3770 3.9 GHz CPU and 8 GB RAM with 240 GB SSD. The operating sys- tem is Windows 10 64 bit.
The execution times are given in seconds. However, the actual execution time depends on the dataset under in-
Table 6
Execution time of the learning process using the dataset from Stack Overflow
BernoulliNB 3.80
GaussianNB 6.67
MultinomialNB 0.99
DecisionTree 162.26
ExtraTree 3.33
LogisticRegression 11.18
KNeighbours 4290.83
SVM 10.91
FCN 50.92
vestigation, these results can give a hint for the choice in case the running time is an important factor. The best result has been presented using Multinomial Na- ive Bayes. This classifier was also the winner regarding the execution time also in our first experiments. The worst result has been produced by KNeighbours clas- sifier. This epoch lasted 4290.83 seconds which is very high comparing to other classifiers. The execution time of the FCN is also a reasonable result which implies that it is worth to move to the area of the Deep Learn- ing also in classification non-functional requirements.
5. Related Work
The problem of processing requirements documents using natural language processing and machine learn- ing methods has been a research topic for decades [4].
Although non-functional requirements are less de- pendent on the application domain, it is not a trivial problem to set up a general list of NFR types. The types identified in the literature are widespread, for example, Chung et al. [12] identified 156 NFR categories, while Mairiza et al. [28] separated 114 different NFR classes in their work, on the contrary to the 6 high-level cate- gories defined by the ISO/IEC 25010:2011 standard.
A fundamental study of NFR classification is pub- lished relatively lately in 2006 by Cleland-Huang et al. [13]. They used 14 NFR categories separated from functional requirements. More than 600 require- ments from 15 projects were collected and manual- ly categorized to train and test their categorization
methods. Cleland-Huang et al. achieved high recall with the tradeoff of really low precision. This exper- iment was reproduced by several researchers in the past [10, 37]. Casamayor et al. [10] employed multino- mial Naive Bayes classifier coupled with an Expecta- tion Maximization algorithm.
Requirements traceability is a related field, where NLP and information retrieval techniques are fre- quently applied [26, 27, 41]. Hindle et al. [20] used top- ic modeling to link NFRs to topics found in commit messages. Falessi et al. [16] conducted a largescale ex- periment with various NLP techniques including dif- ferent algebraic models, term weightings and similar- ity metrics in order to detect identical nonfunctional requirements.
Sharma et al. [36] addressed the NFR extraction prob- lem with a rule-based approach. They implement- ed a framework for NFR analysis including a DSL language. Sawyer et al. have focused on document archaeology and created an NLP based tool called REVERE to support business analysts in the inves- tigation of different documents containing require- ments [35]. This tool has utilized some standard NLP techniques like part-of-speech tagging or semantic tagging and determination of modality.
Denger et al. examined the ambiguity of require- ments sentences and investigated the use of language patterns for rewriting these requirements into less ambiguous sentences [15]. The ambiguity of require- ments is one of the most prominent issues in require- ments engineering which has to be resolved as pointed by Firesmith in his paper [17]. Ambiguity, complete- ness, conformity of requirements were examined and discussed also by Kang and Park using linguistics viewpoint [22]. The researchers developed a require- ment-grammar and also applied error patterns for developing a tool for parsing the manually annotated corpus built by system-engineering related texts. The annotated corpus can be then used for training error model which can be applied to check the exactness of the requirements.
From the perspective of mining software reposito- ries, Paixao et al. [29] investigated the relationship between built results obtained from continuous inte- gration tools with non-functional requirements.
To overcome the scarcity of the labeled examples available via the Internet, extracting requirements re-
443
Information Technology and Control 2019/3/48
lated information from social networks has become a frequently examined area. Portugal and do Prado Leite [31] applied the pattern-search method and extracted requirements related information from GitHub. They have also built a corpus of requirements based on the information retrieved from README files located on GitHub repository [32]. Stack Overflow is also a popular repository among the researchers. Zou et al.
examined the repository via utilizing the Latent Di- richlet Allocation (LDA) to discover the main topics of discussion. [39]. These topics are related to various NFR which were also identified by the researchers.
The topics which are the focus of developers was in- vestigated also by Barua et al. [6] using LDA on Stack Overflow textual database.
6. Conclusions
Identifying and classifying non-functional require- ments is a crucial duty of System Analysts which can be a demanding and error-prone task without using a proper tool. The collection of the requirements ex- pressed using natural language form are originated from customers and stakeholders. Natural Language Processing techniques along with Machine Learning can support the processing of the requirements given in the textual form.
In this paper, we have demonstrated the usability of various machine learning methods along with the transformation of the textual input into an appropri- ate form which is processable by implemented ma-
chine learning algorithms. The methods have been compared with each other using precision, recall and F1 metrics and also a significance test has been per- formed. Two series of experiments were executed. We used the small-sized Tera Promise NFR dataset to the first series and the large dataset extracted from Stack Overflow for the second series of experiments. The results are presented in the results section.
The results of our experiments show that the linear classification algorithm produced the best values us- ing both of the small and the large datasets. The win- ners are Multinomial Naive Bayes, Support Vector Machine and the Logistic Regression but Decision Tree also produced good results. Using the dataset from Stack Overflow, the Fully Connected Network produced the best values and outperformed the other classifiers.
The performance metrics along with execution times present that using NLP and machine learning tech- niques provides a reasonable solution for the base technology of tools supporting System Analysts in re- quirement elicitation process. The precision and re- call can be both above the 95 % which is a good start- ing point for practical usage, however, these values are to be improved.
Our future research plans are to continue studying neural networks by involving deep networks and recurrent networks. Examinations will be extend- ed using another representation of inputs such as embedding techniques which can represent also the contextual information of a textual element and also some grammatical features can be also captured.
References
1. Abad, Z. S. H, Karras, O., Ghazi, P., Glinz, M., Ruhe, G., Schneider, K. What Works Better? A Study of Classifying Requirements. Proceedings 2017 IEEE 25th Interna- tional Requirements Engineering Conference, RE 2017, 2017, 496-501. https://doi.org/10.1109/RE.2017.36 2. Abadi, M., Agarwal, A., Barham, P., Brevdo, E., Chen, Z.,
Citro, C., Corrado, G. S., Davis, A., Dean, J., Devin, M., Ghemawat, S., Goodfellow, I., Harp, A., Irving, G., Isard, M., Jia, Y., Jozefowicz, R., Kaiser, L., Kudlur, M., Leven- berg, J., Mané, D., Monga, R., Moore, S., Murray, D., Olah, C., Schuster, M., Shlens, J., Steiner, B., Sutskever, I., Tal-
war, K., Tucker, P., Vanhoucke, V., Vasudevan, V., Vié- gas, F., Vinyals, O., Warden, P., Wattenberg, M., Wicke, M., Yu, Y., Zheng, X. TensorFlow: Large-Scale Machine Learning on Heterogeneous Systems, 2015.
3. Al Balushi, T. H., Sampaio, P. R. F., Dabhi, D., Louco- poulos, P. ElicitO: A Quality Ontology-Guided NFR Elicitation Tool. Requirements Engineering: Foutn- dation for Software Quality, 2007, 306319. https://doi.
org/10.1007/978-3-540-73031623.
4. Ambriola, V., Gervasi, V. Processing Natural Language Requirements. Proceedings 12th IEEE International
Conference Automated Software Engineering, 1997, 36-45.
5. An, L., Mlouki, O., Khomh, F., Antoniol, G. Stack Over- flow: A Code Laundering Platform? SANER 2017 - 24th IEEE International Conference on Software Analysis, Evolution, and Reengineering, 2017, 283-293. https://
doi.org/10.1109/SANER.2017.7884629
6. Barua, A., Thomas, S. W., Hassan, A. E. What Are Devel- opers Talking About? An Analysis of Topics and Trends in Stack Overflow. Empirical Software Engineering, 2014, 19(3), 619-654. https://doi.org/10.1007/s10664- 012-9231-y
7. Caglayan, B., Kocaguneli, E., Krall, J., Peters, F., Turhan, B. The PROMISE Repository of Empirical Software Engineering Data, 2012.
8. Carrillo de Gea, J. M., Nicolás, J., Alemán, J. L. F., Toval, A., Ebert, C., Vizcaíno, A. Requirements Engineering Tools. IEEE Software, 2011, 28(4), 86-91. https://doi.
org/10.1109/MS.2011.81
9. Casamayor, A., Godoy, D., Campo, M. Identification of NonFunctional Requirements in Textual Specifica- tions: A Semi-supervised Learning Approach. Infor- mation and Software Technology, 2010, 52(4), 436-445.
https://doi.org/10.1016/j.infsof.2009.10.010
10. Casamayor, A., Godoy, D., Campo, M. Functional Group- ing of Natural Language Requirements for Assistance in Architectural Software Design. Knowledge-Based Systems, 2012, 30, 78-86. https://doi.org/10.1016/j.kno- sys.2011.12.009
11. Chollet, F. K., 2015. https:// github.com/fchollet/keras.
12. Chung, L., Nixon, B. A., Yu, E., Mylopoulos, J. Non-Func- tional Requirements in Software Engineering, 2000.
https://doi.org/10.1007/978-1-4615-5269-7
13. Cleland-Huang, J., Settimi, R., Zou, X., Solc, P. Automat- ed Classification of Non-Functional Requirements. Re- quirements Engineering, 2007, 12(2), 103-120. https://
doi.org/10.1007/s00766-007-0045-1
14. Demšar, J. Statistical Comparisons of Classifiers over Multiple Data Sets, 2006. Technical report, 2006.
15. Denger, C., Berry, D. M., Kamsties, E. Higher Quality Re- quirements Specifications through Natural Language Patterns. Proceedings of the IEEE International Con- ference on Software - Science, Technology & Engineer- ing (SwSTE’03), 2003, 1-11.
16. Falessi, U., Cantone, G., Canfora, G. A Comprehensive Characterization of NLP Techniques for Identifying Equivalent Requirements. Proceedings of the 2010
ACM-IEEE International Symposium on Empirical Software Engineering and Measurement ESEM’10, 2010, 1-10. https://doi.org/10.1145/1852786.1852810 17. Firesmith, D. Common Requirements Problems, their
Negative Consequences, and the Industry Best Prac- tices to Help Solve Them. Journal of Object Tech- nology, 2007, 6(1), 17-33. https://doi.org/10.5381/
jot.2007.6.1.c2
18. Glinz, M. On Non-Functional Requirements. 15th IEEE International Requirements Engineering Confer- ence (RE 2007), 2007, 21-26. https://doi.org/10.1109/
RE.2007.45
19. Groen, E. C., Schowalter, J., Kopczynska, S., Polst, S., Al- vani, S. Is There Really a Need for Using NLP to Elicit Requirements? A Benchmarking Study to Assess Scal- ability of Manual Analysis. CEUR Workshop Proceed- ings, 2018.
20. Hindl, A., Ernst, N. A., Godfrey, M. W., Mylopoulo, J.
Automated Topic Naming. Empirical Software Engi- neering, 2013, 18(6), 1125-1155. https://doi.org/10.1007/
s10664-012-9209-9
21. Hussain, A., Mkpojiog, E., Kama, F. The Role of Require- ments in the Success or Failure of Software Projects. EJ Econjournals, 2016, 6(7S), 6-7.
22. Kang, J., Par, J. Generating a Linguistic Model for Re- quirement Quality Analysis. Proceedings of the 30th Pacific Asia Conference on Language, Information and Computation (PACLIC 30), Seoul, Republic of Korea, October 28-30, 2016, 439-447.
23. Kingma, D. P., Ba, J. Adam: A Method for Stochastic Op- timization. 3rd International Conference for Learning Representations, 2015, 1-15.
24. Li, Y., Guzman, E., Tsiamoura, K., Schneide, F., Bruegge, B. Automated Requirements Extraction for Scientific Software. Procedia Computer Science, 2015, 51, 582- 591. https://doi.org/10.1016/j.procs.2015.05.326 25. Lu, M., Liang, P. Automatic Classification of Non-Func-
tional Requirements from Augmented App User Re- views. Proceedings of the 21st International Con- ference on Evaluation and Assessment in Software Engineering EASE’17, 2017, 344-353. https://doi.
org/10.1145/3084226.3084241
26. Mahmoud, A. An Information Theoretic Approach for Extracting and Tracing NonFunctional Require- ments. 2015 IEEE 23rd International Requirements Engineering Conference (RE), 2015, 36-45. https://doi.
org/10.1109/RE.2015.7320406
445
Information Technology and Control 2019/3/48
27. Mahmoud, A., Williams, G. Detecting, Classifying, and Tracing NonFunctional Software Requirements. Re- quirements Engineering, 2016, 21(3), 357-381. https://
doi.org/10.1007/s00766-016-0252-8
28. Mairiza, D., Zowghi, D, Nurmulian, N. An Investi- gation into the Notion of NonFunctional Require- ments. Proceedings of the 2010 ACM Symposium on Applied Computing - SAC’10, 2010, 311. https://doi.
org/10.1145/1774088.1774153
29. Paixao, K. V. R., Felicio, C. Z., Delfim, F. M., Maia, M. D.
A. On The Interplay between Non-Functional Require- ments and Builds on Continuous Integration. IEEE In- ternational Working Conference on Mining Software Repositories, 2017, 479-482. https://doi.org/10.1109/
MSR.2017.33
30. Pedregosa, F., Varoquaux, G., Gramfort, A., Michel, V., Thirion, B., Grisel, O., Blondel, M., Prettenhofer, P., Weiss, R., Dubourg, V., Vanderplas, J., Passos, A., Cournapeau, D., Brucher, M., Perrot, M., Duchesnay, E.
Scikit-learn: Machine Learning in Python. Journal of Machine Learning Research, 2011, 12, 2825-2830.
31. Portugal, R. L. Q., do Prado Leite, J. C. S. Extracting Re- quirements Patterns from Software Repositories. 2016 IEEE 24th International Requirements Engineering Conference Workshops (REW), 2016, 304-307. https://
doi.org/10.1109/REW.2016.056
32. Portugal, R. L. Q, Roque, H., do Prado Leite, J. C. S. A Corpus Builder: Retrieving Raw Data from Github for Knowledge Reuse in Requirements Elicitation. CEUR Workshop Proceedings, 2016, 48-54.
33. Rashwan, A., Ormandjieva, O., Witte, R. Ontology-Based Classification of Non-Functional Requirements in Soft- ware Specifications: A New Corpus and SVM-Based Classifier. 2013 IEEE 37th Annual Computer Software and Applications Conference, 2013, 381-386. https://
doi.org/10.1109/COMPSAC.2013.64
34. Sampaio, A., Loughran, N., Rashi, A., Rayson, P. Mining Aspects in Requirements. Early Aspects 2005: Aspec- tOriented Requirements Engineering and Architecture Design Workshop, 2005.
35. Sawyer, P., Rayson, P., Garsid, R. REVERE: Support for Requirements Synthesis from Documents. Information Systems Frontiers, 2002, 4(3), 343-353. https://doi.
org/10.1023/A:1019918908208
36. Sharma, V. S., Ramnani, R. R., Sengupta S. A Frame- work for Identifying and Analyzing Non-function- al Requirements from Text. Proceedings of the 4th International Workshop on Twin Peaks of Re- quirements and Architecture, 2014, 1-8. https://doi.
org/10.1145/2593861.2593862
37. Slankas, J., Williams, L. Automated Extraction of Non-Functional Requirements in Available Documen- tation. 2013 1st International Workshop on Natural Language Analysis in Software Engineering (Nat- uraLiSE), 2013, 916. https://doi.org/10.1109/NAtu- raLiSE.2013.6611715
38. Tóth, L., Vidác, L. Study of Various Classifiers for Identification and Classification of Non-Functional Requirements. Proceedings of the 18th Internation- al Conference on Computational Science and Its Ap- plications (ICCSA 2018), 2018, 492-503. https://doi.
org/10.1007/978-3-319-95174-4_39
39. Zou, J., Xu, L., Guo, W., Yan, M., Yang, D., Zhang, X.
Which Non-functional Requirements Do Developers Focus On? An Empirical Study on Stack Overflow Using Topic Analysis. 2015 IEEE/ACM 12th Working Confer- ence on Mining Software Repositories, 2015, 446-449.
https://doi.org/10.1109/MSR.2015.60
40. Zo, J., Xu, L., Yang, M., Zhang, X., Yang, D. Towards Com- prehending the Non-functional Requirements Through Developers Eyes. Information and Software Technol- ogy, 2017, 84(C), 19-32. https://doi.org/10.1016/j.inf- sof.2016.12.003
41. Zou, X., Settimi, R., ClelandHuang, J. Improving Auto- mated Requirements Trace Retrieval: A Study of Term- Based Enhancement Methods. Empirical Software En- gineering, 2010, 15(2), 119-146. https://doi.org/10.1007/
s10664-009-9114-z