Article
Sovereign Default Forecasting in the Era of the COVID-19 Crisis
Tamás Kristóf
Citation: Kristóf, Tamás. 2021.
Sovereign Default Forecasting in the Era of the COVID-19 Crisis.Journal of Risk and Financial Management14: 494.
https://doi.org/10.3390/jrfm14100494
Academic Editor: James R. Barth
Received: 8 September 2021 Accepted: 7 October 2021 Published: 15 October 2021
Publisher’s Note:MDPI stays neutral with regard to jurisdictional claims in published maps and institutional affil- iations.
Copyright: © 2021 by the author.
Licensee MDPI, Basel, Switzerland.
This article is an open access article distributed under the terms and conditions of the Creative Commons Attribution (CC BY) license (https://
creativecommons.org/licenses/by/
4.0/).
Institute for the Development of Enterprises, Corvinus University of Budapest, H-1093 Budapest, Hungary;
tamas.kristof@uni-corvinus.hu; Tel.: +36-204185718
Abstract:The COVID-19 crisis has revealed the economic vulnerability of various countries and, thus, has instigated the systematic exploration and forecasting of sovereign default risks. Multivariate statistical and stochastic process-based sovereign default risk forecasting has a 50-year developmental history. This article describes a continuous, non-homogeneous Markov chain method as the basis for a COVID-19-related sovereign default risk forecast model. It demonstrates the estimation of sovereign probabilities of default (PDs) over a five-year horizon period with the developed model reflecting the impact of the COVID-19 crisis. The COVID-19-adopted Markov model estimates PDs for most countries, including those that are advanced with AAA and AA ratings, to suggest that no sovereign nation’s economy is secure from the financial impact of the COVID-19 pandemic. The dynamics of the estimated PDs are indicative of contemporary evidence as experienced in the recent financial crisis. The empirical results of this article have policy implications for foreign investors, sovereign lenders, export finance institutions, foreign trade experts, risk management professionals, and policymakers in the field of finance. The developed model can be used to timely recognize potential problems with sovereign entities in the current COVID-19 crisis and to take appropriate mitigating actions.
Keywords:credit risk; country risk; forecasting; Markov chain; probability of default
1. Introduction
Political, sovereign debt and financial crises have emerged in recent decades to pre- cede the COVID-19 pandemic. These crises have revealed the vulnerability of various countries around the globe and instigated the systematic exploration and forecasting of such sovereign default risks. The COVID-19 pandemic has presented novel challenges for sovereign default forecasting. As more sovereign default events are expected to occur with increasing likelihood than in times of greater crisis relief, it has become imperative to develop a sovereign default forecast model to appropriately address the COVID-19 crisis impact.
From a methodological standpoint, sovereign default forecasting does not differ from predicting corporate or bank failure. However, since far fewer sovereign entities exist than companies or banks, there are significantly less observed data, especially those observations of default states that are available to modelers. Contributing variables of sovereign default differ substantially from those of corporate or bank failure prediction.
This article firstly investigates the theoretical and conceptual framework for the def- inition of sovereign default and sovereign default forecasting. Based on an extensive literature review, it explores potential manifestations of sovereign default events and spec- ifies sovereign default as a modeling target variable. This is followed by an exposition of the explanatory variables of sovereign default, which are derived from a rich theo- retical and empirical literature basis containing numerous model variables in different groupings. The article then evaluates the approximately 50-year history of methodological and empirical development of sovereign default forecasting. It provides insights into
J. Risk Financial Manag.2021,14, 494. https://doi.org/10.3390/jrfm14100494 https://www.mdpi.com/journal/jrfm
the development path that began with simpler, smaller sample-based linear models, and arrives at contemporary machine learning methods, which are applied to the full range of sovereign observations encompassing the entirety of recorded economic history, as well as the rating-based Markov chains and forecasting of Credit Default Swap (CDS) spreads.
As sovereign rating is a complex, forward-looking measure of sovereign issuers’ debt servicing capacity, it is widely used in analyzing sovereign risk (Altman and Rijken 2004).
Rating agencies possess valuable databases for sovereign default forecasting, primarily with frequently published empirical default rate time series, and transitional matrices expressing the probability of changes in sovereign rating provided. Beginning with transi- tional matrices, a great number of matrix function-based stochastic methods are available to forecast sovereign default, from which the Markov chain is the best-known method- ological tool. Sovereign rating-based Markov chain models have already been developed and published in extant literature with different aims proposed for solutions to perceived methodological and data challenges (Hu et al. 2002;Wei 2003;Kiefer and Larson 2004;Fuertes and Kalotychou 2007a;Bhaumik and Landon-Lane 2013;Oh et al. 2019;Szetela et al. 2019).
Based on in-depth investigation of earlier applied methods and empirical models, this article offers a novel Markov chain model within the framework of a specific empirical analytical study. In contrast to binary classification techniques, the Markov chain is better able to capture phases of entering default in different conditions over time. Therefore, it can be better applied to prepare longer-term forecasts. It is advantageous that a Markov chain can be constructed using high-level aggregate historical data and its model complexity is also relatively low. It can, thus, be easily implemented in any system.
A continuous, non-homogeneous Markov model is developed employing factual, long-run, one-year average credit rating transitions produced by Standard & Poor’s (S&P) as an authentic starting point. The article adds to existing literature by stressing use of the Markov chain on the basis of previous crisis impact experience. By this means, the model addresses the COVID-19 crisis impact and estimates stressed probabilities of sovereign default. Empirical results also confirm the superiority of continuous non-homogenous Markov chains over traditional homogeneous chains, as the dynamics of credit ratings depend on the actual environment.
Results demonstrate that despite achieving low empirical default rates, and that better rating classes possess zero historical defaults with this methodology, it is still possible to estimate probability of default (PD) term structures for those rating classes achieving reasonable PD values. The developed model also meets requirements of International Financial Reporting Standards (IFRS)-9 rationale. Finally, the article summarizes novel scientific results thus made evident to the field of sovereign default forecasting.
2. Literature Review
Sovereign default forecasting represents an important research field of credit risk management. This section provides an overview of the research preparation, conceptual framework, and underlying factors of sovereign default forecasting that underpin empirical research in this article. This is particularly crucial in terms of defining explanatory and target variables. In addition, it synthesizes the methodology used and earlier empirical sovereign default models in a historical development framework. However, it is not the objective of this article to analyze expert rating systems, country-specific case studies, and macroeconomic models published in the field of sovereign default forecasting to this point in time.
2.1. Theoretical Considerations
Sovereign default forecasting as a research field emerged in the 1970s, when external debt levels of developing countries significantly increased, leading to a growing number and volume of sovereign restructurings in the 1980s. By that time, scientific progress in the field of multivariate statistical methodology had matured to enable estimation of
the occurrence of a binary event (default/non-default) as a primary target variable by simultaneously considering multiple explanatory variables.
As a result of market-oriented economic and financial reforms following the collapse of communism, a substantial volume of foreign investment took place in Eastern Europe, Latin America, Asia, and Africa (Ramcharran 1999). International investors increasingly noticed that the globalization of world trade and financial markets carried risks that might generate rapid and widely distributed spillovers and financial crises, thus, potentially endangering the stability of the international financial system (Hayes 1998). The terror attack of 11th September 2001 and subsequent turbulent events revealed increasing risks associated with international relationships which were already increasingly hard to analyze and predict. Following the global financial crisis of 2008–2010, the same change in international dependency propelled several Eurozone countries into debt crises, principally in Greece, Spain, Italy, Portugal, and Ireland.
Failure prediction is an extensively researched subject. In recent decades, substantial results of empirical exercises and publications appeared, primarily in the field of corporate bankruptcy prediction (Kristóf and Virág 2020). Bank default and sovereign default fore- casting received relatively less attention, even though bank defaults and sovereign defaults might cause more severe problems at global, regional, and local levels than the failure of specific individual corporate entities. PD, thus, forms one of the most important research fields of credit risk, which simultaneously comprises the fundamental credit risk parameter of debtors. In recent decades, considerable progress has taken place in the field of credit risk modeling. Three methodological approaches of credit risk modeling are relevant for the subject matter of this article (McNeil et al. 2015):
• Binary classification modeling, which estimates the probability that a debtor cannot meet its contractual obligations and goes into default. This is enacted through the application of multivariate statistical/machine learning methods.
• Rating-based modeling, which in multiple forms estimates the probability that the credit rating of a debtor changes in the future. This may include possible transition into the defaulted rating category.
• Market-based structural modeling, which deduces the PD from the extrapolation of market data. However, it is only applicable for debtors possessing instruments traded in capital markets.
The forward-looking approach of the IFRS-9 framework includes calls for the quan- tification of lifetime credit losses, which has created impetus to develop methodology for lifetime PD modeling (Kristóf and Virág 2017). On the basis of practical experience, it is easy to notice that the time behavior patterns of PDs are not constant and non-linear. There- fore more complex modeling is necessary, especially in the context of the crisis resulting from the COVID-19 pandemic.
Before defining sovereign default, it is essential to understand the term ‘country risk’, for which several overlapping terminological definitions have been formulated. In addition to country risk, risks of business activities abroad are invariably described in the literature as ‘cross-border risks’, ‘sovereign risks’, and ‘political risks’. Historically, country risk research was dominated by political crises in the 1960s and 1970s, by debt crises in the 1980s, and financial crises in the 1990s and the early 21st century (Bouchet et al. 2003).
Following each crisis, a great number of publications were produced with the ex post aim to explain the underlying reasons behind them.
Research in the field of political risk became popular in the 1960s following expropria- tion of American companies in Cuba due to the revolution in that country (Usher 1965).
The term ‘country risk’ was initially applied in the banking sector in the 1970s, primarily as a general description of the concrete business economic environment in various countries.
As a result of debt crises in the 1980s, country risk and sovereign risk unambiguously became dominant terms in contrast to political risk (Desta 1985).
Subsequently, a consensus was attained that country risk is the broader term that incorporates sovereign and political risks (Timurlenk and Kaptan 2012). According to
Shapiro(1999), country risk encompasses political and economic factors with an impact on the value of granted loans or performed investments in a given country. With regard to sovereign default, sovereign risk is a key element within country risk. It therefore expresses the possibility that a country as a sovereign debtor/issuer cannot or does not intend to meet its contractual payment obligations to foreign creditors or investors (Krayenbuehl 1985). Sovereign risk analysis explores the capability and willingness of countries to meet their financial obligations (Cosset and Roy 1991).
A more detailed definition of sovereign default, containing exact failure event indica- tors, can be linked to default definitions applied by rating agencies. At this time of writing, the actual default definitions of the three best-known rating agencies (Moody’s 2020;S&P 2020;Fitch 2020) includes missed or delayed fulfillment of contractual payment obligations, bankruptcy filing, legal receivership, unfavorable debt swap, and contract modification in varying forms. Default rating status accorded by rating agencies is, thus, regarded as sovereign default.
Given that countries affected by sovereign default often are subject to conditions set by the International Monetary Fund (IMF), several publications regard a sovereign default event as the period when a country exceeds the limit of non-concessional IMF lending (Manasse et al. 2003;Alaminos et al. 2019;Wijayanti and Rachmanira 2020).
Sovereign CDS spreads are also salient in relation to market indicators, explaining sovereign default. A current prominent subject of debate is whether sovereign rating or the CDS spread better explain the likelihood of sovereign default.Rodríguez et al.(2019) suggested that changes in CDS spreads better explained sovereign failure than changes of ratings.
From the preceding narrative, sovereign default as a target variable can be specified as follows:
• Delinquent sovereign debt service payment
• Sovereign debt restructuring
• Bankruptcy filing or legal receivership
• Sovereign default rating
• Exceeding IMF funding limits
• Insolvency priced through CDS spreads
Literature regarding the theoretical and empirical backgrounds of explanatory vari- ables is extensive. Indebtedness and debt service capacity ratios emerged in the earliest multivariate models, which together with classic macroeconomic and foreign economic indicators were aptly applied to predict sovereign default (Manasse and Roubini 2009).
Burton and Inoue(1987) classified macroeconomic–financial factors as domestic macroeco- nomic, external macroeconomic, and external debt variables. Throughout the historical development of sovereign default forecasting, the range of applied variables has become increasingly wider.
Brewer and Rivoli(1990) used political instability and political systems as determi- nants to explain the solvency of countries beyond traditional macroeconomic–financial indicators. Cosset et al. (1993) identified several institutional, security policy-, and eco- nomic policy-related factors, and established a strong relationship between political risk and sovereign risk.Reinhart(2002) suggested that since a great number of sovereign debt crises were preceded by currency crises, variables explaining currency crises are found to reliably predict sovereign default. Pescatori and Sy(2007) presented arguments for the mutual application of bond market information, liquidity, solvency, and macroeconomic indicators for the estimation of sovereign default.Reinhart and Rogoff(2011) subsequently concluded that bank crises often led to sovereign debt crises, primarily because of strenuous budgetary burdens which would need to be overcome to secure the stability of financial systems.
Kaminsky and Vega-Garcia(2016) argued that the key reason for sovereign default was a rapidly spreading effect of external shocks, especially in the case of systematic sovereign debt crises simultaneously impacting multiple countries.Sturzenegger and Zettelmeyer
(2006) also suggested external factors were predominant, particularly worsening terms of trade, recession in countries receiving investment, and increasing external financing costs. Moreover,Sturzenegger and Zettelmeyer(2006) proposed that crises occurring in a larger associated trading nation can also further infect the financial markets and foreign trade patterns of smaller countries. Furthermore,Reinhart et al.(2016) regarded external dependence as the primary cause of severe sovereign indebtedness.
van Rijckeghem and di Mauro(2009) revealed default and restructuring histories of countries to be determinant factors of sovereign default. These authors concluded that previously non-defaulting countries faced problems with fulfilling their debt service obligations to a lesser extent.
The explanatory variables of sovereign CDS spreads are primarily relevant in market- based sovereign default forecasting. The term structure of yield curves was regarded as significant to predict sovereign CDS spreads byDuyvesteyn and Martens(2012) in terms of exchange rate volatility. It was also viewed byCruces and Trebesch(2013) in terms of previous restructuring and byAugustin(2018) as indirectly forecasting sovereign default.
By summarizing the preceding narrative, several reasons for sovereign default are identified, which can be appropriately defined, measured, and modeled. The explored factors are grouped as follows:
1. Macroeconomic–financial indicators
• classic macroeconomic variables
• debt service and liquidity ratios
• monetary policy indicators
• public finance ratios
• external economic and financial indicators 2. Political factors
• institutional environments
• political systems and political stability
• security policy 3. Market indicators
• yield curves
• exchange rate volatility 4. Systemic risks
• contagion effect of externally related crises
• risks affecting the financial system
• association with a risky country group 5. Default history
• previous restructuring and non-payment experience
These factors may optimally be contained within a sovereign rating and recognition of it as a complex variable as it incorporates a diverse range of variables. Given sovereign default may be attributed to sovereign rating, the latter term may be used both as an explanatory and a target variable in the field of sovereign default forecasting.
2.2. Earlier Empirical Sovereign Default Models
The roots of multivariate statistical sovereign default forecasting are located in the 1960s whenAvramovic and Gulhati(1960) systematically analyzed factors affecting national current account balances, thereby determining levels of sovereign debt payment capacity.
These authors concluded that a combination of long-term and short-term indicators were needed to assess debt payment capacity. These included export growth, debt service to export ratios, reserve import ratios, GDP growth, investment to GDP ratios, export to GDP ratio, and consumer price indices.
Several quantitative methods were applied following the 1960s to model sovereign credit risk and to quantify the sovereign probability of default. As such, multivariate
statistical and stochastic process-based sovereign default forecasting has an approximately 50-year developmental history. Based on historical development, it can be concluded that the applied quantitative methods may accountably model relationships between explanatory and target variables and provide reliable means of forecasting the probability of sovereign default.
Historical development is evaluated through 50 empirical publications that achieved significant, recognized scientific results. Articles appearing in highly rated journals and which achieved substantial citation, and/or which are attributable to the most currently applied models with subsequent outstanding results are regarded by the author as histori- cally relevant.
Empirical sovereign default forecast methods are evaluated in this article in chrono- logical order and are grouped as methodological families. AppendixAcomprehensively presents the referred publications together with applied methods, examined periods, target variables, and explanatory variables. The historical development of the analysis provides insight to the development path, which began with simpler, small sample-based linear models. It finally considers contemporary machine learning methods applied to the full range of sovereign observations encompassing the entire economic histories of target countries. Applied methods are grouped into the following three categories:
• Multivariate classification methods
• Structural approaches
• Rating-based approaches
2.2.1. Multivariate Classification Methods
In relation to multivariate classification methods, they may be divided between tra- ditional parametric statistical methods, mostly applied in the earlier phase of sovereign default forecasting history, and non-parametric machine learning methods, which are currently widely applied. From traditional and parametric classification methods, discrimi- nant analysis (DA), logistic regression (logit), probit, and Tobit analysis are regarded as significant in the historical development of the field of sovereign default forecasting.
The first multivariate sovereign default forecast model was developed by Frank and Cline(1971) using multivariate DA. The target variable was that of sovereign debt restructurings occurring between 1960 and 1968. Following the success of the first model, DA became widely applied to predict sovereign default. Publications byGrinols(1976), Sargen(1977),Saini and Bates(1978),Taffler and Abassi(1984), andBurton and Inoue (1987) are highly emphasized as significant articles in this regard. Following the 1980s, it can be observed that the role of DA in the literature and in practice was replaced by more advanced techniques indicating higher classification power and less rigorous application assumptions.
In parallel with the developmental tendency of corporate and bank failure prediction, the first logit-based sovereign default forecast models appeared at the end of the 1970s. In contrast to DA, this did not require use of rigorous normality and variance assumptions.
The first sovereign default logit model was published by Feder and Just (1977). The predictive power of the six-variate logit model is adjudged to be superior than any of the previously published models. Mayo and Barett(1978), Feder et al. (1981), Citron and Nickelsburg(1987),Oral et al.(1992),Sommerville and Taffler(1995),Ciarlone and Trebeschi(2005),Fuertes and Kalotychou(2006,2007b), andKaminsky and Vega-Garcia (2016) all produced major logit models to contribute to the literature. The Noise-To-Signal (NTS) approach, combined with logit models, was also shown to be strongly applicable in sovereign default forecasting. By realizing that several variables behaved differently before crises,Kaminsky et al. (1998) categorized variables according to the excess of predefined thresholds. Similar methodology was applied byDawood et al.(2017) and byWijayanti and Rachmanira(2020). In overall terms, it can be concluded that logit methods are still widely applied for sovereign default forecasting, both as a standalone and as a benchmark method. The popularity of logit methods has remained unbroken, even though in recent
years several empirical studies have revealed that machine learning methods can achieve much superior predictive power.
The probit method was first applied byKharas(1984) to predict sovereign default.
This author examined long-term creditworthiness of developing countries between 1965 and 1976 by concentrating on the relationship between capital accumulation and external debt. Similar probit models were developed byBalkan (1992), de Bondt and Winder (1996),Reinhart(2002), andSzetela et al.(2016). Tobit analysis was applied for sovereign default forecasting byLloyd-Ellis et al.(1990),Lanoie and Lemarbre(1996), andGür(2001).
Generally, it can be argued that although probit and Tobit methods are less frequently applied in the literature and in practice as compared to logit methods, they can still be regarded as substantial in the historical development of the field of sovereign default forecasting.
Within non-parametric and machine learning classification, the following methods may also be regarded as historically significant in the development of sovereign default forecasting:
• Decision Trees (CART and C4.5 trees)
• Neural Networks (NN)
• Support Vector Machine (SVM)
• Random Forest (RF)
• Least Absolute Shrinkage and Selection Operator (LASSO)
• Multivariate Adaptive Regression Splines (MARS)
• Extremely Randomized Trees (ERT)
• Extreme Gradient Boosting (XGBoost)
• Deep Neural Decision Trees (DNDT)
The first decision tree-based sovereign default model was developed byCosset and Roy(1988) by applying classification and regression trees (CART) to observations between 1983 and 1985. The target variable was that of sovereign rating, and the explanatory variables were exchange rate changes, inflation rates, and infant mortality rates. Results indicated that regression trees were able to effectively manage hidden relationships in the database and better handle multicollinearity as compared with previously applied techniques.
Manasse et al.(2003) produced an article with a significant effect on the development of the field, which applied CART to locate early warning indicators of sovereign debt crises. In total, 1276 observations were examined between 1970 and 2002, 54 of which were default occurrences. The target variable was defined in parallel with the default definition of S&P and the excess of the IMF non-concessional limit. A logit model was developed as a benchmark and the six-level regression tree achieved 89% classification power, whereas the logit model achieved only 74%.
Manasse and Roubini(2009) applied CART to examine macroeconomic, financial, and political factors explaining sovereign debt crises. The initial 50 variables were reduced to 10 utilizing decision trees whereby rules were developed to recognize features of defaulting countries. It was concluded that not all crises were similar, and they could be differentiated in terms of solvency, liquidity, and macroeconomic risks. Decision trees also explored factor-groups to identify relative risk-free zones.
Savona and Vezzoli(2015) attempted to locate the best compromise between in-sample model fit and out-of-sample predictive power. The authors examined developing countries by using regression trees between 1975 and 2010, supplemented with data from Greece, Ireland, Portugal, and Spain. The danger of failure was established by defining variables in terms of how they may exceed predefined thresholds. The classification power of the model outperformed that of the benchmark NTS logit model. The strongest variables were those of short-term excessive indebtedness, default history, real GDP growth, and US interest rates.
Alaminos et al. (2019) applied fuzzy C4.5 decision tree methodology to predict sovereign debt crises using data collected between 1970 and 2017, and by applying 30 vari-
ables and ten-fold cross validation. The area under the ROC curve (AUROC) of the global model was 94%, thus indicating a very strong predictive power.
It can be concluded that decision trees also fulfilled a critical role in the historical development of the field of sovereign default forecasting. However, the static decision trees have since been transformed to produce more advanced machine learning decision trees such as RF and ERT, which are presented later.
The first NN-based sovereign default model was published byCosset and Roy(1994) using data collected from 76 countries between 1983 and 1985, with a forecast made until 1986. Results were compared with the logit method. The NN model, incorporating reserve import ratios, net external debt ratios to exports, per capita GNP levels, current account to GNP levels, investment willingness, export changes, and political instability as explanatory variables outperformed the logit model as a means of classifying sovereign default. A similar NN model was developed byChattopadhyay(1997) by using the net position change of US foreign direct investment as a target variable.
Within the framework of comparative analysis,Cooper(1999) examined the perfor- mance of a back propagation NN on data collected between 1960 and 1982 by comparing results with DA, logit, and probit methods. Debt restructuring was set as a target vari- able and the author demonstrated superiority of the NN method with 90% classification accuracy, in contrast to 85% achieved with logit and probit methods, and 80% with DA.
Yim and Mitchell(2005) attempted to forecast changes in sovereign ratings by utilizing back propagation NN, hybrid NN, and by employing DA, logit, and probit as benchmark methods. The deployed hybrid network integrated variables and outputs from statistical models and back propagation NN combined with Ward clustering and self-organizing maps (SOM). The strongest model variable emerged to be political risk, and the best hybrid model was determined to be the combination of NN–logit–probit, which provided a perfect classification of the out-of-sample set.
In the recent global financial crisis, timely recognition of sovereign default became particularly important. By researching debt crises of developing countries between 1980 and 2004,Fioramanti(2008) developed an NN-based early warning model. This author emphasized the high flexibility and non-linear approximation capability of NN, thereby outperforming earlier methodologies.
Frascaroli et al.(2009) attempted to reconstruct sovereign ratings with resilient prop- agation neural networks (RBPRO-NN) by using macroeconomic data collected between 1975 and 2005. The model was tested in multiple scenarios on the Brazil economy, and an exact prediction was produced for which indicators the country would need to improve upon in order to receive better ratings.
Zhou and Wang(2019) experimented with deep learning neural networks (DL-NN) using a database of 183 countries with data collected between 1970 and 2015. Target variables included sovereign default events, IMF excess limits, implicit severe domestic sovereign indebtedness, and loss of market confidence. By also paying careful attention to prevent overtraining, the model was able to achieve almost perfect classification accuracy.
It can ultimately be concluded that experience with NN has demonstrated it to be by far one of the best sovereign default forecasting modeling methods. This has been manifested in various standalone models, constantly developing learning algorithms and consideration of useful benchmark models.
Demand for even more reliable and effective sovereign default forecasting models has been further corroborated by events since 2010. This is especially relevant since a great number of models developed before 2008 failed to forecast the severity and duration of the 2008–2010 global economic crisis (Candelon et al. 2014). Several improved econometric models were published with the expressed goal of increasing predictive power in out-of- sample periods. Several critiques were simultaneously made on the applicability of earlier models. As a consequence, since around 2015, artificial intelligence-based machine learning procedures have also unambiguously become dominant in sovereign default forecasting
methods. Their constant development of creative combination currently comprises the most interesting research challenges in the field of sovereign default forecasting.
Pisula(2017) experimented with different ensemble classifier machine learning meth- ods with data collected from 133 countries between 1980 and 2014 by using macroeconomic and financial indicators and a three-fold cross validation method. The single target variable was that of debt service difficulty and the forecast horizon was 3 years. By creating a balanced sample, 1281 observations were classified as default occurrences from 2562. This author combined a stacking ensemble classifier tool with NN, SVM, G-logit, and MARS methods, a bagging ensemble classifier with the RF method and an AdaBoost ensemble classifier tool with the CART method. The best predictive power (97% AUROC) was achieved by the AdaBoost–CART model, followed by the RF method with 96%. Other models significantly underperformed in comparison.
Huang and Sethi(2017) developed NN, SVM, RF, and logit models by using an IMF database containing 1200 observations. Variables were reduced via Principal Component Analysis (PCA), and results were backtested by use of a ten-fold cross validation method.
RF emerged to be the best predictive model with 91% classification accuracy, followed by the SVM (89%), NN (88%), and logit methods (87%).
Nyman and Ormerod(2018) predicted economic crises by applying RF methods using macroeconomic and market indicators to ex post reproduce the best possible ex-ante forecasting cases. One hundred decision trees were built with the help of bagging on data collected between 1970 and 2010. Variables were lagged, where considered reasonable, thus enabling retrospective forecasting of multiple periods with the average result being considered as the prediction. The RF model was able to forecast the financial crisis at the beginning of 2009 from data collected 18 months previously and did not forecast a crisis for any period when it actually did not happen.
da Silva et al.(2019) attempted to reproduce sovereign ratings by applying machine learning procedures using data collected from 137 countries between 1958 and 2017. Fol- lowing clustering and by applying PCA, the authors developed an RF model that was fine-tuned by testing crisis impacts and which achieved 98% classification accuracy.
Lucia et al.(2019) analyzed the behavior of sovereign CDS spreads between 2009 and 2013 to identify various turning points. The authors explained time-dependent behavior of CDS spreads by using real-time, country-specific macroeconomic variables and market indicators for which the LASSO machine learning procedure was applied. It was suggested that the substance of fundamental conditions significantly decreases during a crisis break- out period given the panic in markets whereby certain countries are punished because of their assumed or actual vulnerability.
Bluwstein et al.(2020) constructed machine learning models by using an extended period (1870–2016) database of data collected from 17 countries containing macroeconomic, financial, and market indicators. From 2499 observations, 90 were classified as default occurrences. Target variables were defined as crisis indicators occurring in the banking sectors of the examined countries. In addition to benchmark logit and CART models, the authors applied RF, ERT, SVM, and NN methods. The ‘black box’ aspect of the machine learning method in this instance was resolved by use of the Shapley regression method.
Each model found similar variables as relevant to the forecast financial crises, from which the resulting slope of the yield curve was emphasized. The best model was found to be ERT with 87% AUROC, followed by the RF, SVM, NN, logit, and CART methods, respectively.
Alaminos et al.(2021) found that an accuracy limitation of several existing models could be due to a lack of geographic diversity. The authors used a wide global sample dif- ferentiated according to major geographical regions and attempted to use several machine learning methods to locate the best model. Separate models were built to predict sovereign debt crises and currency crises. The best sovereign debt crisis model was achieved by use of the fuzzy decision trees model (97.8% accuracy), followed by the AdaBoost model (96.1%), and the XGBoost model (94.4%). The most reliable currency crisis model was developed
by use of the DNDT model (98.4% accuracy) followed by the XGBoost model (97.3%), and then by the fuzzy decision trees model (95.8%).
2.2.2. Structural Approaches
A common characteristic of the previously evaluated empirical studies is that they were each developed partially or in full by using macroeconomic and financial data.
Although a wide range of results evidently underpinned the explanatory power of macroe- conomic factors, several studies in recent years have questioned their applicability for forecasting purposes in crisis periods and for when sovereign rating changes occur.
Liu et al.(2018) regarded it as illusory to reliably apply macro-based models due to the frequency of disclosing input data, especially in the case of countries where governmen- tal organizations may deliberately delay publication of statistical data. Consequently, sovereign default risk is often preferably implied from constantly actual and available market indicators, especially from the interpretation of sovereign bond yields or sovereign CDS spreads (Pan and Singleton 2008;Groba et al. 2013;Chen et al. 2016). Probabilities of sovereign default are also implied from term structures, thereby leading to them being regarded as market-based forecasts.
Gray et al. (2007) modifiedMerton’s (1974) structural model originally developed for private companies by making it applicable for forecasting sovereign default provided that countries issue bonds in local currency.Duyvesteyn and Martens(2012) applied this model to developing countries and concluded that exchange rate volatility was the most important predictor for estimating remaining default term. The authors demonstrated that recent changes in exchange rate volatility well predicted sovereign CDS spreads, and, thereby, indirectly also that of sovereign default.
Cruces and Trebesch(2013) conducted research into the impact of sovereign restructur- ings between 1970 and 2010 on the basis of future sovereign debt spreads. It was concluded that the magnitude of realized credit losses due to the restructuring of sovereign debt exposures generated significantly higher spreads, thus spreads were found as the strongest predictors of future lending conditions.
Augustin(2018) examined term structures of CDS spreads to explore the dynamics of global and country-specific factors shaping sovereign credit risk. By using observations between 2001 and 2012, and by applying a developed Recursive Preferences (RPF) model it was proposed that upward spread curves indicated the dominance of global shocks, whereas the reversed term structure explained higher added value of domestic shocks in terms of predicting sovereign risk.
2.2.3. Rating-Based Approaches
Given sovereign rating is a complex, forward-looking measure of sovereign issuers’
debt servicing capacity, it is widely used as an important characteristic of expressing sovereign risk and as acting as a basis for credit risk undertaking decisions. Rating agencies provide valuable databases for sovereign default forecasting, primarily with frequently published empirical default rate time series, and transitional matrices expressing the probability of changes in sovereign rating, which they also provide. Various time series forecasting methods can be applied to the published historical sovereign default rates, and beginning with transitional matrices, a great number of matrix function-based stochastic methods are available to forecast sovereign default of which the Markov chain is the best- known methodological tool. This section focusses further on the Markov chain method.
It is important to note that rating agencies fundamentally focus on longer-term hori- zons by using ‘through-the-cycle’ rating methodology. As a result, they primarily provide insight to durable components of the perceived rating changes (Altman and Rijken 2004).
Hu et al.(2002) constructed transitional matrices from sovereign ratings. By recog- nizing the problem that several sovereign entities with unfavorable ratings do not possess decades-long historical transitional data, the authors recommended combining and supple- menting matrices with data from other actual historical default events.Wei(2003) produced
a general, multi-factor Markov chain applied to rating migrations and credit risk spreads, which was also applied to corporate and sovereign debtors. The time-dependent transition matrix was constructed with the help of latent variables representing the economic cycle and economic environment based on observed transitions between 1981 and 1998.
The application of Markov chains was also recommended byKiefer and Larson(2004).
The authors examined the applicability of Markov chains to local governmental bonds, commercial debt letters, and sovereign debts. They recommended the use of Markov chains to predict default over a maximum five-year period in the case of local government bonds, and six months in the case of commercial debt letters. However, this study did not locate any limit to forecasting changes of sovereign ratings, including the quantification of migration to sovereign default. These authors highly appreciated the database scope and default definition used by S&P.
Fuertes and Kalotychou(2007a) constructed three Markov chain models by using Moody’s rating changes identified in 72 countries between 1981 and 2004. A discrete chain, a one time-homogeneous chain, a continuous hazard chain, and a time-inhomogeneous continuous hazard chain were also deployed. Bias and variance of the model variables applied to the finite sample were tested via a bootstrap simulation exercise. The duration dependence and momentum characteristic of upgrading and downgrading were examined by panel logit methods, and non-Markovian processes were identified in the sovereign rating changes. For countries with worse ratings, the non-homogeneous continuous Markov chain indicated the best performance.
Bhaumik and Landon-Lane(2013) examined a Moody’s sovereign rating migration database with data collected between 1996 and 2005 by using Markov chains for different country groups and different economic conditions. The homogeneity assumption was rejected, and distinct samples were created for each rating migration by using the Bayes decomposition method. Non-homogeneous Markov chains were constructed by using mobility indices to achieve promising results.
Oh et al.(2019) developed a Regime Switching Markov chain (RSMC) model in which regime states were derived from a hidden Markov model expressing dynamics of sovereign rating transitions. The authors firstly demonstrated that the estimation of RMSC is superior to the homogeneous Markov chain and applied the model to a monthly time series database of sovereign ratings of 41 countries between 1994 and 2018 by also considering the status of the specific economic environment. Results indicated that in the case of economic recession, countries with worse ratings received a higher probability of downgrading.
Szetela et al.(2019) researched interrelationships between sovereign defaults by using data collected from 42 European countries between 1994 and 2013. Since traditional sta- tistical methods failed to adequately model relationships, the authors applied the Copula method to rate sovereign financial instruments. The Markov chain was applied as a dy- namic variable in order to quantify transitions among sovereign ratings. It was found to be challenging to manage low default rates and predict the probability of default for developed European countries. Eventually, the best model was achieved by the t-Copula method.
3. Methodology and Data
Having studied various methodological approaches and empirical models it was decided to apply rating-based methodologies. The Markov chain method was selected to prepare a novel sovereign default forecast model. In contrast to binary classification techniques, the Markov chain can better capture phases of entering default through multiple states over time. Thus, it can be better applied to prepare longer-term forecasts. Rating- based model development encompasses all factors used by rating agencies to rate sovereign entities. Hence, actual sovereign ratings can be regarded as authentic starting points for predicting sovereign default. A further argument in favor of rating-based modeling is based on the tendency for rating agencies to take action earlier in the case of emerging problems through downgrading. Governmental statistical agencies in some countries, by contrast, may intend to hide factual data for as long as possible. Therefore, it is not
guaranteed that binary classification models receive enough timely data to predict the danger of sovereign default.
From studying earlier empirical models, it became apparent that several target vari- ables were used to develop sovereign default forecast models. These empirical approaches, in line with the methodological requirements of the Markov chain, tend to define sovereign default as a worsening of sovereign rating towards the defaulted rating category. They also tend to regard the modeled probability of sovereign default as the probability of migration to a defaulted rating class.
The forecasting horizon in this empirical research exercise is set at five years. It is considered unrealistic to make forecasts for a longer period in the context of the COVID-19 crisis. Moreover, regardless that the applied method would under normal circumstances be able to make suitable predictions, it is typically chosen to be applied for approximately 15–30 years of expected credit loss estimations for financial instruments.
3.1. Markov Chain Modeling
Markov chains are essentially stochastic models expressing a sequence of possible events (Siekelova et al. 2019;Spahn 2017). A Markov chain is, therefore, a sequence of random variables in which the probability of moving to the next (j-th) state depends only on the value of the present (i-th) state. In this case, rating classes represent states. Let (Xt)t≥0denote the series of random variables with {1, 2, . . . , K} the fixed number of ratings, where K denotes the default rating class. The series is a finite first order Markov chain, assuming
P(Xt+1=j|X0=x0, . . . ,Xt−1=xt−1,Xt=i) =P(Xt+1=j|Xt=i) (1) for eacht, andi,j∈{1, 2, . . . , K}.
Pt(i,j) =P(Xt+1=j|Xt=i) represents the element of the K×K sizePttransition matrix indicating the probability of transition from thei-th rating class in thet-th period to thej-th rating class in the (t+ 1)-th period. It presumes that conditional probabilities are well defined, specifically if
P(X0=x0, . . . ,Xt=xt)>0 (2) A Markov chain is a stationary, timely, continuous process ifPt=Pholds for each t≥0. In this case, the transition matrices are equal and any multi-period transition matrix can be calculated by raising the annual transition matrix to power k
P(Xt+k=j|Xt=i) =Pk(i,j) (3) The first known discrete Markov model for failure prediction was produced byCyert et al.(1962) and applied to delinquent account receivables. Subsequently, the assumption of time homogeneity was often applied in empirical Markov models as it guaranteed a straightforward estimation of PD term structure. Since the 1980s, many articles have revealed that transition matrices are not constant in time, especially in the field of credit risk modeling (Jarrow et al. 1997).Lando and Skodeberg(2002) indicated the superiority of continuous Markov models over discrete models.
The generator matrix (G) is a key element when constructing a continuous Markov chain given that in continuous models a transition matrix between the 0-th and thet-th period can be estimated by exponentiating the generator matrix (G), which, as such, is a K
×K matrix, whereby
P(0,t) =exp(Gt) (4)
Location of the optimal matrix logarithm is required to develop a generator matrix (Zhang 2019). When assuming time homogeneity, the probabilities of transitions in any horizon can be expressed in the function of the same generator matrix. However, empirical experiences demonstrated that the behavior of credit risk data in a Markov chain is often
non-homogeneous. Accordingly, the generator matrix depends on time (Bluhm and Over- beck 2007). Probabilities of continuous, non-homogeneous transitions can be expressed as follows
P(0,t) =exp Z t
0 G(t)dt
(5)
3.2. Data Collection and Data Preparation
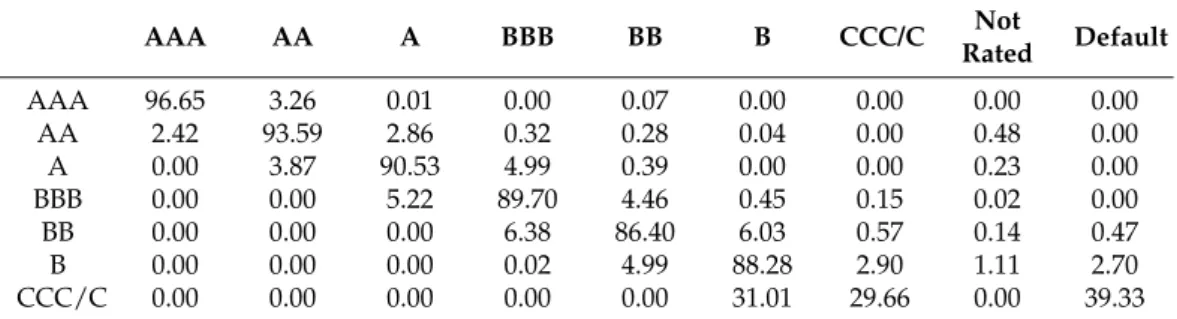
In Markov chain modeling the first research task is to construct a transition matrix reflecting changes in rating. Rating agencies maintain historical databases encompassing default events, rating changes, and recovery rates of rated sovereign entities. For the purposes of this article, the one-year sovereign transition matrix of Standard & Poor’s (S&P) was applied, which had also been used in the major part of the previous literature review. At the time of writing, the most recent transition matrix was available for the period between 1975 and 2019. Percentages presented in Table1are, thus, presented as annualized cohorts. They represent implied senior debtor ratings before 1995 and sovereign ratings after 1995 (S&P 2020). Since sovereign entities may possess flexible tools to meet their local currency obligations, especially through the supervision of a domestic financial and monetary systems, rating agencies provide separate ratings for local currency and foreign currency debts. As foreign currency rating grants a more realistic picture on sovereign default risks, further calculations use foreign currency ratings accordingly.
Table 1. Global one-year average transition probabilities of sovereign ratings in foreign currency (1975–2019, in percentages).
AAA AA A BBB BB B CCC/C Not
Rated Default
AAA 96.65 3.26 0.01 0.00 0.07 0.00 0.00 0.00 0.00
AA 2.42 93.59 2.86 0.32 0.28 0.04 0.00 0.48 0.00
A 0.00 3.87 90.53 4.99 0.39 0.00 0.00 0.23 0.00
BBB 0.00 0.00 5.22 89.70 4.46 0.45 0.15 0.02 0.00
BB 0.00 0.00 0.00 6.38 86.40 6.03 0.57 0.14 0.47
B 0.00 0.00 0.00 0.02 4.99 88.28 2.90 1.11 2.70
CCC/C 0.00 0.00 0.00 0.00 0.00 31.01 29.66 0.00 39.33
Source:S&P(2020, p. 9).
The empirical default rate of a rating class is presented in the top right column of the transition matrix indicating migration to a default state. For instance, in the case of the AAA sovereign rating, the probability of migrating to default is zero in a one-year horizon, according to long-run historical one-year average transitions retrieved from the S&P database. It can also be observed in the diagonal that most ratings remain in their previous rating classes in a one-year horizon and the default rate increases with rating quality. Thus, worse ratings have a higher default rate. When modeling rating transitions, the default state indicates an absorbing state, regardless of where the migration may emanate from. Hence, as a simplification, it is assumed that it is never possible to recover from a defaulted state. According toLando(2004), the absorbing assumption guarantees a monotonic increasing PD term structure, which is an important expectation from the standpoint of a rating migration-based credit risk model.
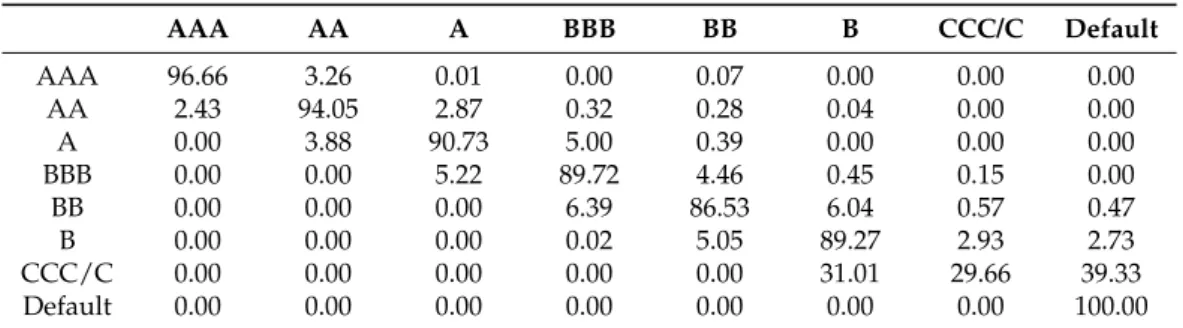
For the purpose of further calculations, a new row must be added to make a square matrix in order to construct a Markov chain. Furthermore, it is necessary to handle the
‘not rated’ cases by denoting them to possess 100% sums of rows in each line. Assuming that the withdrawn rating does not constitute upgrading or downgrading, the matrix has been normalized by a simple scaling method. Table2presents the normalized one-year transition matrix in line with these assumptions.
Table 2.The normalized one-year transition matrix (in percentage).
AAA AA A BBB BB B CCC/C Default
AAA 96.66 3.26 0.01 0.00 0.07 0.00 0.00 0.00
AA 2.43 94.05 2.87 0.32 0.28 0.04 0.00 0.00
A 0.00 3.88 90.73 5.00 0.39 0.00 0.00 0.00
BBB 0.00 0.00 5.22 89.72 4.46 0.45 0.15 0.00
BB 0.00 0.00 0.00 6.39 86.53 6.04 0.57 0.47
B 0.00 0.00 0.00 0.02 5.05 89.27 2.93 2.73
CCC/C 0.00 0.00 0.00 0.00 0.00 31.01 29.66 39.33
Default 0.00 0.00 0.00 0.00 0.00 0.00 0.00 100.00
Source: own calculations.
To develop a continuous Markov chain, a generator matrix must firstly be constructed.
It is not unequivocal as to how to embed a discrete transition matrix in a continuous chain, as previously set conditions must be met. The simple root or logarithm might lead to the emergence of negative numbers violating assumptions of the generator matrix, hence, they are in themselves improper. Theoretically, a valid generator does not exist due to non-observed defaults in the historical data for high rating classes (Hughes and Werner 2016). In addition, the same transition matrix may be a result of multiple generator matrices (Israel et al. 2001). However, regularization procedures can deal with this shortcoming and provide appropriate solutions. The most frequently applied optimization methods are the diagonal adjustment method, the weighted adjustment method, the quasi-optimization method, the expectation maximization logarithm method, and the Gibbs sampler model (Monari et al. 2020).
In this study, the generator matrix was approximated by applying the algorithm first published by Kreinin and Sidelnikova(2001). It is a commonly used procedure in the literature and in practice, which is also easy to compute and has been proven to provide proper fit. The first step is to take the natural logarithm of the transition matrix. Due to the presence of zero values in the transition matrix, this inevitably results in negative values not being present in the diagonal. Then, negative values must be nullified to result in an initial G matrix. This matrix does not yet, necessarily, fulfill the conditions of the generator matrix as the sums of rows are not equal to zero. Hence, there may be positive diagonal values. To meet the criteria, the rows of the matrix were modified by considering the relative contribution of each element (Kreinin and Sidelnikova ibid.) and formulating a Gematrix, the elements of which were calculated as follows
egij =gij
∑Nj=1gij
∑Nj=1 gij
(6)
Extraction of the two matrices yields the applicable generator matrix ˆGthat meets all of the pre-conditions
Gˆ =G−Ge (7)
Table3presents the generator matrix constructed in line with the previously outlined procedure.
Table 3.The applied generator matrix (percentages).
AAA AA A BBB BB B CCC/C Default
AAA −3.47 3.40 0.00 0.00 0.07 0.00 0.00 0.00
AA 2.55 −6.24 3.11 0.25 0.30 0.03 0.00 0.00
A 0.00 4.19 −10.00 5.51 0.29 0.00 0.00 0.00
BBB 0.00 0.00 5.75 −11.29 5.01 0.28 0.24 0.00
BB 0.00 0.01 0.00 7.22 −14.95 6.66 0.85 0.22
B 0.00 0.00 0.01 0.00 5.76 −12.76 5.41 1.58
CCC/C 0.00 0.00 0.00 0.10 0.00 57.59 −124.88 67.19
Default 0.00 0.00 0.00 0.00 0.00 0.00 0.00 0.00
Source: own calculations.
4. Model Development and Results
With the help of a continuous Markov chain, probabilities of transitions can be es- timated by exponentiating the generator matrix. However, in a crisis period the future does not evolve as smoothly as in the past. To ensure time-varying flexibility so that the estimated PD term structure adequately reflects the crisis caused by the COVID-19 pandemic, a non-homogeneous Markov chain was developed. The starting point was the Gˆgenerator matrix. To replace the time-homogeneous generator with a time-dependent generator, the following formula was applied
Gˆt=φ(t)×Gˆ (8)
where×is matrix multiplication andφ(t) = (ϕij(t))1≤i,j≤Kis as such a K×K diagonal matrix, where
ϕij(t) =
0 i f i6=j
ϕα,β(t)i f i=j (9)
ϕα,β(t)can be formulated in the function of non-negative αandβparameters per rating class as follows (Bluhm and Overbeck 2007)
ϕα,β(t) = 1−e−αt tβ−1
1−e−α (10)
For the first year (t= 1) there is no impact as the diagonal matrix purely consists of ϕα,β(1) =1. The numerator (1−e−αt) denotes the exponential distribution of the random variable, whiletβ−1serves for convexity or concavity adjustment. Hence, both flexibility of parameter selection and the application of well-known functions from probability theory are met. By the appropriate selection ofαandβparameters, the generator matrix can be interpolated to stressed default rates, thus achieving satisfactory estimation accuracy.
To optimizeαandβparameters for the long-term, actual cumulated sovereign default rates of S&P were considered by stressing those in line with experience from the recent financial crisis.
Sovereign default experience has revealed that on average 2–3 years elapsed between the emergence of downgrading and the occurrence of the sovereign default event. This was the case in the experience of Greece, Russia, Indonesia, Pakistan, Argentina, Paraguay, Uruguay, and Ecuador. Consequently, the stressed parameter optimization should also be related to the third elapsed year following the outbreak of the COVID-19 pandemic. In the AAA and AA rating classes, the empirical one-year default rates were set at zero, so no stress factor was necessary. For A, BBB, BB, and B ratings, the weighted average of the five worst years following 2007 were considered as stressed cumulated default rates. In CCC/C ratings, the very low number of issuers and biased default rates did not enable pursuit of an analogous method. Hence, CCC/C ratings form the consequence of stressing the other rating classes.
Optimization took into consideration the tendency for cumulated PDs to monotoni- cally increase within the term structure and that they tend to be higher for the worse rating
classes. Thus, they would need to reflect COVID-19 effects in a realistic forward-looking manner. Non-linear optimization was performed using the Generalized Reduced Gradient (GRG) method, which is an extension of the Reduced Gradient (RG) method to handle non- linear programming problems with linear and non-linear constraints (Duffuaa et al. 1993).
GRG linearizes the non-linear objective and constraint functions at a local solution level with a Taylor expansion equation (Lee et al. 2004). Table4summarizes the parameters optimized in this manner. The aim was to achieve as accurate as possible a result in the third year.
Table 4.Optimized parameters.
α β
AAA 1.0000 1.0000
AA 1.0000 1.0000
A 0.6635 2.4633
BBB 0.6043 2.0998
BB 0.3058 0.4503
B 5.9901 1.0152
CCC/C 0.7299 1.6020
Source: own calculations.
Sovereign PDs were estimated for a five-year forecast horizon per rating class. Results are presented in Table5. The stress factor in Table5forms the ratio between forecasted PDs in the third year and actual default rates in the third year.
Having formed the cumulated PDs it is relatively easy to calculate marginal PDs per rating class by extracting the estimated percentages from each other.
Table 5.Estimated cumulated sovereign PDs and S&P empirical default rates.
Sovereign PD Estimation S&P Long-Term Empirical Default Rates Stress Factor Year1 Year2 Year3 Year4 Year5 Year1 Year2 Year3 Year4 Year5 Year3
AAA 0.00% 0.00% 0.01% 0.02% 0.05% 0.00% 0.00% 0.00% 0.00% 0.00% n.a.
AA 0.00% 0.02% 0.08% 0.21% 0.41% 0.00% 0.00% 0.00% 0.00% 0.00% n.a.
A 0.00% 0.15% 0.84% 1.90% 3.00% 0.00% 0.00% 0.26% 0.81% 1.38% 3.23
BBB 0.07% 0.80% 2.18% 3.79% 5.39% 0.00% 0.47% 1.22% 1.76% 2.32% 1.79
BB 0.47% 1.76% 3.32% 4.97% 6.65% 0.41% 1.47% 2.14% 2.84% 4.07% 1.55
B 2.70% 7.37% 11.43% 15.04% 18.33% 2.26% 5.62% 8.63% 11.45% 14.03% 1.32
CCC/C 38.86% 56.36% 58.67% 60.45% 62.03% 38.64% 45.72% 53.86% 56.57% 59.47% 1.09 Source: estimated PDs–own calculations; empirical default rates–S&P(2020).
5. Discussion
Empirical findings in this article have revealed that sovereign default forecasting considered as credit migration in the current context of risk management cannot be assumed to be durable in the long-run. Findings, moreover, depend on various factors, especially in an ongoing global crisis that is currently manifested in the COVID-19 pandemic. Hence, a long-run average transition matrix in itself might be appropriate to estimate sovereign riskiness under ‘normal’ conditions but not in crisis periods when stressed estimates are essential in order to provide realistic PD forecasts. Publications in the field have called this empirical challenge detecting structural breaks (see, for example,Xing et al. 2020).
In compliance with the findings of this article, empirical results have proven that sovereign rating is a well applicable, complex, forward-looking measure of credit risk, and provides important input to sovereign portfolio risk management as shown inter alia in earlier empirical studies byCantor and Packer(1996),Hu et al.(2002),Wei(2003),Kiefer and Larson(2004),Altman and Rijken(2004),Perilioglu and Tuysuz(2015),Seetharaman et al.(2017),Kleszcz and Nehrebecka(2020), andde Oliveira et al.(2021).
It can be argued that the generator matrix optimization solution for constructing con- tinuous non-homogenous Markov chains presented in this article meets the requirements
of IFRS-9 and is applicable in credit risk modeling. The applied regularization methodology is a viable alternative compared to the Markov regenerative process (Pasricha et al. 2017), the hidden Markov default intensity method (Yu et al. 2019), the expectation maximization algorithm (Bladt and SØrensen 2009;dos Reis and Smith 2018), the Fisher information matrix (dos Reis et al. 2020), Markov chain Monte Carlo sampling (van Ravenzwaaij et al.
2018), and the approximate lumpability method (Georgiou et al. 2021); it has also been proven to be successful in the literature when conducting similar empirical research with similar methodology, although not especially for forecasting sovereign default, but instead, for instance, for predicting payment discipline for Visegrad Four companies (Siekelova et al. 2019;Weissova et al. 2015) or assessing credit risk for small and middle enterprises (Ferretti et al. 2019).
Empirical results in this article have demonstrated that a reliable sovereign default forecast model can be constructed with a continuous non-homogeneous stressed Markov chain. This is implemented through flexible parameterization of the time-dependent generator matrix, which can flexibly incorporate the effect of a crisis into the model. It is important to emphasize that several historical default cases have revealed that, on average, 2–3 years have elapsed between the beginning of downgrading processes and the occurrence of a sovereign default event. As such, stressed parameter optimization should be related to the third elapsed year following the outbreak of the COVID-19 pandemic. The dynamics of sovereign rating changes for similar research problems were also researched byFuertes and Kalotychou(2007a),Bhaumik and Landon-Lane(2013),Oh et al. (2019), andSzetela et al.(2019) in the extant literature using similar methodology and achieving similar methodological conclusions, even though COVID-19 impacts could not have been on the agenda in these studies.
It is interesting to observe that the stressed Markov model in this article estimated PDs for countries with AAA and AA ratings to imply that no country is secure from the financial impact of the COVID-19 pandemic. The highest stress factor is found in the A class and shows decreasing tendency with progression towards the worse classes.
Compared to the S&P empirical average historical default rates between 1975 and 2019, significantly higher PDs resulted for each rating class and in each subsequent year, which is a consequence of the impact of the COVID-19 crisis. The dynamics of the estimated PDs resemble the experience of the recent global financial crisis. It has, therefore, been demonstrated that a reliable sovereign default forecast model can be constructed with the continuous non-homogeneous stressed Markov chain model. Furthermore, through flexible parameterization of the time-dependent generator matrix, the crisis effect can be flexibly incorporated into the model.
An important consideration in applying this Markov chain method for the subject of this research is that it does not require a sophisticated database, an overly complex model- ing procedure, or substantial modeling resources. The input of all data and estimation can be adequately presented in the scope of a journal article. The model is relatively easy to be implemented in any operating system including MS Excel. Further benefits of Markov chain modeling are discussed in-depth byWozabal and Hochreiter(2012).
It can also be argued that the resulting model meets the requirements of IFRS-9 standards, thus, financial institutions can calculate expected credit losses against sovereign debtors with its use. Forward-looking information is adequately considered given that estimated PDs form an actual point-in-time model, which is customized to the current crisis environment.
6. Conclusions
Multivariate statistical and stochastic process-based sovereign default forecasting methods have an approximately 50-year history of development. As such it can be con- cluded that applied quantitative methods can truly model relationships between explana- tory and target variables and provide reliable forecasts of the probability of sovereign default. It can also be concluded that sovereign default forecasting has actually completed
a very similar development path to that of the case of corporate and bank failure prediction.
The most recent methods are currently also applied for sovereign default forecasting.
Until around 2010, it was generally true that for empirical sovereign forecast mod- els, simpler model designs led to more accurate predictions for out-of-sample periods.
However, more complex models better explained features of historical data. It is, there- fore, concluded that strong attention should be applied in order to avoid overtraining.
Nonetheless, since around 2015, simplification trends have been reversed as a result of progress made in the development of machine learning methodologies. Creative com- bination and constant development associated with this trend comprise the single most interesting current research challenge. Increasing complexity in the modeling of sovereign default forecasting is expected in the future given that method combinations and increasing complexity have been shown to serve improvement of predictive power. Moreover, there have been no indications that any single regression method might alter this tendency
In contrast to binary classification techniques methods, the Markov chain can better capture phases of entering default through various conditions over time. It can, therefore, be better applied in order to prepare longer-term forecasts. Rating-based model development encompasses all factors used by rating agencies to rate sovereign entities. Actual sovereign ratings can thus be regarded as authentic starting points in order to predict sovereign default. A further argument in favor of rating-based modeling is the tendency for rating agencies to take earlier steps in addressing emerging problems in the form of downgrading.
This is in contrast to governmental statistical agencies that typically conceal factual data from public access for as long as possible, especially in countries which encounter significant sovereign debt challenges. Accordingly, it cannot be ensured that binary classification models would receive enough timely data to predict danger of sovereign default.
Sovereign PDs were estimated in accordance with a five-year horizon period per rating class. Results confirm the superiority of continuous non-homogenous Markov chains over traditional homogeneous methods as dynamics of credit ratings depend on the actual environment.
This article, through its empirical results, possesses policy implications for foreign investors, sovereign lenders, export finance institutions, foreign trade and risk management professionals, and for policymakers in the field of finance. The developed model can be used to timely recognize potential problems with sovereign entities in the current COVID-19 crisis period and, also, to take appropriate mitigating action. The Markov chain can, moreover, be constructed by using high-level aggregated historical data, and model complexity is relatively low.
However, the methodology applied in this article has some limitations. Estimations of a stressed Markov chain cannot be simply tested by comparing them to historical observations. The essential goal of a stressed Markov chain is not to properly fit past data but to instead provide a forward-looking prediction method in crisis circumstances. In the field of sovereign default forecasting, it is very challenging to prepare a transition matrix as a result of low default rates. This is especially the case for rating classes with a limited number of observations. This leads to the problem that empirical default rates for better rating classes are essentially zero. In spite of this, empirical results in this article demonstrate that it is still possible to estimate PD term structures for rating classes resulting in reasonable PD values.
Future research may entail involving the use of alternate techniques to enrich the methodological experience and to develop stress scenarios to test their impact on PD estimations. Case by case analysis of sovereign defaults currently occurring in the COVID- 19 crisis may also be used to explore whether the drivers of sovereign defaults are different from those in previous crises.
Funding:This research received no external funding.
Conflicts of Interest:The author declares no conflict of interest.