For internal use, please do not delete. Submitted_Manuscript
Orientation of Membrane Associated Biomacromolecules Studied with Polarized Light
Dr. Imola Cs. Szigyártó
[a], Róbert Deák
[a], Dr. Judith Mihály
[a], Dr. Sandra Rocha
[b], Dr. Ferenc Zsila
[a], Dr. Zoltán Varga
[a,c], Dr. Tamás Beke-Somfai
[a,d]Abstract: Extracellular vesicles (EVs) are currently in the scientific focus having a great potential to revolutionize the diagnosis and therapy of various diseases. However, numerous aspects of these species are still poorly understood, thus additional insight to molecular level properties, membrane-protein interactions, or membrane rigidity is still needed. We here demonstrate using red blood cell derived EVs (REVs) that polarized light spectroscopy techniques, linear and circular dichroism, can provide molecular level structural information on these systems. Flow-linear dichroism (flow-LD) measurements show that EVs can be oriented by shear force, and indicate that hemoglobin molecules are associated to the lipid bilayer in freshly released REVs. During storage this interaction ceases coupled to major protein conformational changes relative to the initial state. Further on, the degree of orientation gives insight to vesicle rigidity, which decreases in time parallel to changes in protein conformation. In overall, we propose that both LD and circular dichroism (CD) spectra provide simple, rapid, yet efficient ways to track changes in membrane-protein interactions of EV components at the molecular level which may also give insight to processes occurring during vesiculation.
Exosomes, microvesicles and other cell-derived vesicles, commonly called extracellular vesicles (EVs), are currently the subject of intensive investigation regarding their structure and composition.[1] These biological nanoparticles are released by cells into the extracellular space, filled with biomolecules that may be characteristic to the particular cells producing them.[2]
EVs have emerged as important mediators of intercellular
communication and may provide information for early diagnosis and treatment of various diseases.[3,4] However, investigation of EVs is challenging due to their heterogenity in size and composition.[5–8] The widely used techniques for EV characterization western blotting, nanoparticle tracking analysis (NTA)[9], electron microscopy (EM)[10], dynamic light scattering (DLS)[11], flow-cytometry[12,13], protein assays[14] and others[15]
give vital insight to these species. However, the biophysical characterization of EVs at the molecular level is lagging behind their widespread investigation in biology and medical fields.
Consequently additional techniques that could rapidly provide further structural information on these systems are highly desirable.[16] In this respect, we have recently demonstrated that Attenuated total reflection Fourier-transform infrared spectroscopy (ATR-FTIR) is a fast and reliable method, which can provide insight to compositional changes of EV subpopulations without complicated sample preparations.[17] To progress further towards rapid investigation of EVs at the molecular level, here we employed polarized light spectroscopy techniques, namely linear dichroism (LD) and also circular dichroism (CD), that are commonly applied for model membrane systems but their use in EV research is scarce. As a test system, red blood cell derived EVs (REVs) were selected. Erythrocytes are ideal to produce a large amount of EVs with single cell origin, thus being relatively uniform with a well-defined composition.[16,18] Furthermore, besides phospholipids and membrane proteins, such as band 3[19], one of its major component is hemoglobin[20], which is advantageous as the heme group has absorption peaks also at higher wavelengths separate from typical protein signals in the 190-280 nm region.[21–23]
LD is a spectroscopic technique that can be used with systems that are either intrinsically oriented, or can be oriented by external forces. Coupled to a Couette flow cell, a generated shear force is capable to distort solution phase vesicles from a spherical to a more ellipsoid shape, which renders them oriented.[24–26] As a consequence, LD can give information about membrane insertion, orientation angles, and structure of associated molecules.[27–32] LD is defined as the difference in absorption of the light polarized parallel and perpendicular relative to the main orientation axis:
LD=A-A (1).
The LD signal is related to absorbance intensity, namely the oscillator strength and the polarization of the particular transition relative to the macroscopic axis of orientation. When combined with absorbance measurements, LD can differentiate between
[a] Dr. I.Cs. Szigyártó, R. Deák, Dr. J. Mihály, Dr. F. Zsila, Dr. Z. Varga, Dr. T. Beke-Somfai
Institute of Materials and Environmental Chemistry, Research Centre for Natural Sciences, Hungarian Academy of Sciences P.O. Box 286, H-1519, Budapest, Hungary
E-mail:beke-somfai.tamas@ttk.mta.hu,
szigyarto.imola.csilla@ttk.mta.hu, zoltan.varga@ttk.mta.hu [b] Dr. S. Rocha
Department of Biology and Biological Engineering Chalmers University of Technology
SE-41296, Göteborg, Sweden [c] Dr. Z. Varga
Department of Biophysics and Radiation Biology, Semmelweis University,
H-1094 Budapest, Hungary [d] Dr. T. Beke-Somfai
Department of Chemistry and Chemical Engineering, Physical Chemistry
Chalmers University of Technology SE-41296, Göteborg, Sweden
Supporting information for this article is given via a link at the end of the document.
For internal use, please do not delete. Submitted_Manuscript
the transition dipole moments (TDM) which contribute to the same UV-Vis absorption peak but have a different orientation.
This results also in increased sensitivity to spectral shifts arising from changes in the local environment. These features can give additional insight to e.g. protein structure using the aromatic chromophore of tyrosine or tryptophan [[33–35] or by exploiting spectral contribution of exotic chromophores as the heme group in the case of membrane associated cytochrome C.[36]
In the Couette flow cell used in this study, the orientation axis is determined by the shear force generated during the rotation of the inner cylinder (Figure 1A). It was shown earlier that spherical liposomes subject to shear force undergo a reversible deformation.[27,28] This way the macroscopic system, i.e. the vesicle, will be oriented and the relative orientation of compounds associated to it can be determined.
The degree of macroscopic orientation can be derived from the orientation of membrane probes inserted into or associated to the lipid bilayer and possessing TDMs with well-defined directions. For a particular TDM of a membrane probe oriented in the lipid bilayer equation (2)[28] provides the macroscopic orientation factor, S.
𝐿𝐷𝑟= 𝐿𝐷
𝐴𝑖𝑠𝑜=3
4𝑆(1 − 3𝑐𝑜𝑠2𝛼) (2)
where LDr is the reduced LD signal, Aiso is the isotropic absorption and is the angle of the TDM relative to the membrane normal. In typical LD measurements of membrane systems, S, is obtained by probes such as retinoic acid (RetA), curcumin, or pyrene (Py) molecules, which are either inserted or closely associated to the lipid bilayer.[25] RetA and curcumin are assumed to have, respectively, an 0o or 90o relative to the membrane normal. Py, on the other hand, is useful, as it has a high affinity to insert into lipid bilayers and also having perpendicular transitions where its long axis TDM, corresponding to the ~339 nm peak sits preferentially parallel, while its short axis TDM at ~272 nm aligns preferentially perpendicular to the membrane normal.[24,27] For flow-LD measurements typically 100 nm size liposomes are used where the S values are in the range of 0.033 – 0.1. [35,37]
As a closely related, widespread technique, CD spectroscopy is often used to study structural properties of membrane- associated proteins. The far-UV CD signals recorded below 250 nm originate from the peptide nand transitions and represent the chiroptical contribution of various secondary structural elements such as -helix, -sheet and turns.
For the present investigations, REVs were obtained via centrifugation procedures and were purified on a Sepharose CL- 2B column. Dynamic light scattering (DLS) and freeze-fracture transmission electron microscopy (FF-TEM) measurements indicated that the REVs have spherical morphology with a mean diameter of approximately 200 nm. (SFigure 1 and SFigure 2 in Supplementary Information). To address the applicability of the above techniques in following molecular level structural changes in EVs, a simple method was chosen, i.e. by tracking time dependent changes of REVs after 2, 5, 8, 15 and 28 days (2d, 5d, 8d, 15d, 28d respectively) (More details in Experimental Section and Supplementary Information).
To compare the results obtained for EVs with a more standardized reference system, DOPC (1,2-dioleoyl-sn-glycero- 3-phosphocholine) large unilammellar vesicles (LUVs) with a similar ~200 nm size were prepared. DOPC LUVs were used as simple vesicle model and subjected to LD measurements using both RetA and Py as membrane probes. Further on, for a more complex reference system, DOPC liposomes were also prepared in the presence of hemoglobin, as well as hemoglobin plus Py and the corresponding samples were measured by LD (SFigure 3, SFigure 4).
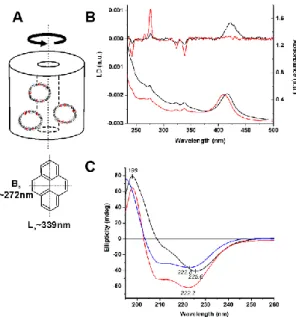
Interestingly, LD spectra of freshly made, 0d, samples display a positive peak at 421nm, which coincides with the Soret band of heme proteins (Figure 1B).[36] Since RBCs do not have mitochondria, heme-containing membrane associated proteins, such as cytochrome C and cytochrome C oxidase, will not be present. Consequently, this LD band stems from hemoglobin.
This strongly suggests that hemoglobin molecules are somehow oriented, most probably associated to the lipid bilayer.
Measurements were repeated several times on each sample, where the LD signal was always zero for a non-oriented system because free hemoglobin has no contribution (SFigure 4). The employed samples were also subject to DLS measurements which did not show major differences before and after LD measurements confirming that vesicle deformation was reversible during rotation in the Couette flow-cell (Data not shown).To address further, whether similar phenomena may somehow be due to the employed shear conditions, the same LD measurements were performed on 200 nm size DOPC liposome with hemoglobin molecules present in the samples, but these resulted in no LD signal arising from the protein (SFigure 4).
Further information may be gained by considering LD results together with absorbance measurements. According to eq. 1, the LD signal can arise only from oriented compounds; therefore the Soret region in LD shows the subpopulation of the hemoglobin molecules associated to the membrane. Using standard UV-Vis spectroscopy one may obtain spectral properties for the all hemoglobin molecules present in the solution. The 0d samples exhibit a maximal absorbance (max) at 415 nm in the absorption spectrum (Figure 1B), which corresponds very well to the value of oxygen bound hemoglobin (415 nm)[38]. Note, that deoxy hemoglobin exhibits absorbance at a higher wavelength (430 nm), whereas methemoglobin shows an absorbance at a lower wavelength, at 405nm.[21] To address the LD band at 421 nm in further detail, we employed Gaussian- function-based deconvolution for the corresponding peak (SFigure 5). The best fit was achieved by using three components, where presence of one at 412 nm, and another at 429 nm can be confirmed. This indicates that the REV lipid bilayer associated hemoglobins may be contain both oxy- and deoxy hemoglobins.
For internal use, please do not delete. Submitted_Manuscript
Figure 1. Polarized light spectroscopy of EVs. A. Schematic description of shear deformed vesicles in a Couette flow cell. The orientation axis coincides with the direction of rotation, marked by a solid black arrow (TOP). Pyrene molecules inserted into the lipid bilayer are depicted as small red rhombuses.
The orthogonal directions of TDMs in Py are shown as dotted lines (BOTTOM).
B: LD (TOP) and absorption spectra (BOTTOM) of REVs including Py as obtained for samples 0d (black) and 28d (red). Spectra were recorded using a shear force of 2270 s-1. C: Far-UV CD curves of 0d (black) and 28d (red) samples. The CD spectrum of 3.4 M human hemoglobin (blue) dissolved in 10 mM potassium phosphate buffer at pH 7.3 is also shown (100 mM NaCl, 25 °C).
To address the state of hemoglobin in fresh REVs further, 0d samples were subject to CD measurements as well (Figure 1C).
The far-UV CD curve of the 0d sample exhibits a strong, broad negative band of n-* origin centered at 225 nm, and a much weaker, unresolved * exciton CD component at about 208 nm. In contrast, free hemoglobin dissolved in buffer solution exhibits a typical -helical CD pattern [39,40] where the peak amplitudes above 200 nm are approximately equal. Therefore, the ellipticity features of 0d REVs suggest the significant contribution of additional structural elements such as -sheet and/or various turn components. This at first indicates that the sample contains several proteins other than hemoglobin, which is in agreement with the membrane protein speckles observed on the TEM images (SFigure 1).
As a further step on evaluating applicability of polarized light spectroscopy on REVs, stored samples were investigated for up to 28 days of storage. When comparing the two endpoints, 0d and 28d samples, several significant changes could be observed in LD, CD as well as in UV-Vis spectra (Figure 1B and 1C). For LD, the most prominent change was the disappearance of the 421 nm band, demonstrating that hemoglobin is detached from the membrane. This can be also followed on 2d, 5d, and 8d samples, as a gradual decrease of the 421 nm band (Figure 2B). The LD results show that by day 8 the hemoglobin – membrane interaction is not detectable.
In comparison, intensity of the Soret band does not change significantly in the UV-Vis spectrum (Figure 1B), however it shows a shift from from 415 nm to ~405 nm, indicating that most hemoglobin is converted into air-oxidized methemoglobin.[21]
Simultaneously to the above observations, some CD spectral changes also occur from 0d 28d samples: the zero cross- over point of the CD curve is blue shifted from 209 to 203 nm which coincides with the same point of free hemoglobin.
Additionally, the relative band intensities as well as the shape of the spectrum above 200 nm become very similar to that of hemoglobin (Figure 1C). To support secondary changes observed by CD, FTIR spectra of 0d, 28d and free hemoglobin were also collected indicating very similar changes as seen for CD (See SFigure 6 and STable 2 as well as the text in SI).
Similarly, the changes of the CD spectra towards that observed for 28d can also be seen on the 0d to 8d samples (Figure 2A).
Figure 2. A: CD spectroscopic changes of REV samples. For comparison, the CD spectrum of 3.4 M human hemoglobin is displayed (10 mM potassium phosphate buffer at pH 7.3, 100 mM NaCl, 25 °C). B: LD signal changes at the Soret band of REV samples. Color code is equivalent to those applied on panel A.
Besides membrane associated complexes, a potentially important feature of vesicles is their rigidity, which can be a characteristic value representing lipid composition as well as the presence of cytoskeletal or other protein components altering bilayer flexibility.[41] This parameter is coupled to the extent of vesicle deformation during external mechanical stress, which is directly described by the S factor, introduced earlier.
Note that vesicle deformation will primarily depend on vesicle size and on the composition of the bilayer. As a reference, we initially determined orientation factors of DOPC LUVs with 200 nm diameter (SFigure 3). Since these match the average diameter of REVs studied here, comparison of the orientation factor of DOPC with REVs can help to see how the REV membrane composition affects vesicle rigidity. To establish a more confirmed macroscopic orientation factor, both RetA and Py were employed, with insertion angle of Py determined from two different sources, resulting 42.6° and 46.5° as detailed in the
For internal use, please do not delete. Submitted_Manuscript
Experimental Section. The S factor for 200 nm DOPC vesicles was 0.04 using eq. 2. (Table 1). For 0d samples S ≈ 0.007 - 0.011, which is below that of DOPC liposomes, while for 28d samples it increased significantly to 0.045 - 0.067. This is also apparent from visual comparison of the 0d and 28d normalized LD signals of Py which is much higher for the latter (Figure 1B).
Based on these, we conclude that freshly made REVs are rather rigid, several times less deformable than a similar size LUV composed of DOPC. In contrast, parallel to the dissociation of hemoglobin-membrane complexes, 28d samples are in the range of the reference vesicles, suggesting that their membrane composition or certain initially present membrane associations have changed compared to fresh samples.
Table 1. Orientation factors obtained for different REV samples and for the reference 200 nm DOPC LUV samples using pyrene (Py) and retinoic acid (RetA) as membrane probes.
Probe Sample S
Py 0d 0.007 – 0.011a
RetA 0d n.d.
Py 28d 0.067a
RetA 28d 0.045
RetA LUV 0.04
a: Insertion angle of Py relative to the membrane normal was determined using S derived from RetA insertion both for 200 nm DOPC vesicles (46.5°) and for the 28d REV samples (42.6°).
Based on the above results, we conclude that in freshly prepared REVs a significant fraction of hemoglobin molecules is associated to the lipid bilayer. This initial state is described by the secondary structure of the proteins present producing the ellipticity profile with significant β-sheet content recorded for the 0d sample. In time, however, hemoglobin dissociates from the membrane and the CD spectra will be very similar to that of pure hemoglobin, in its native, principally -helical conformation. The relative increase of -helical content over β-sheet is also confirmed by the ATR-FTIR spectra (SFigure 6). This presumption is in a full agreement with the concomitant, time- dependent decline of the Soret LD signal (Figure 2B).
Hemoglobin molecules detached from the membrane can no longer be oriented and therefore give rise to no LD contribution.
In line with these, hemoglobin molecules are known to interact with the anion exchanger membrane protein band 3 during ageing of RBCs.[19,21,42] Association processes of oxidized and inactive hemoglobin, methemoglobin, are known to induce vesiculation and REV expression.[43,44] Presence of membrane proteins in the samples is also supported by the recorded TEM images (SFigure 1). Membrane bound hemoglobin molecules were observed earlier for various lipid compositions, as well as for red blood cells.[23,45–48] It was even suggested that hemoglobin may dissociate from its tetramer form and rather dimer subunits could associate with membranes.[46,49]
Considering relative orientation of the membrane bound hemoglobin molecules, the LD signal observed at 421 nm can be of interest. The binding geometry of cytochrome c has been recently accurately determined for several lipid compositions employing CD and LD spectroscopy using the LD signals of the heme group.[36] Although the in depth analysis of binding
geometry is beyond the scope of the present study, qualitative conclusions can be reached. Accordingly, two important observations can be made regarding the shape of the Soret signal in LD: 1. The Soret band is positive; 2. There is no bisignate characteristic of the band. Considering that heme has two orthogonal TDMs, with identical oscillator strength, this strongly suggests that both of them should be aligned preferentially parallel to the surface of the membrane (Figure 3).
Otherwise a negative contribution arising from one of these TDMs should result a split LD signal with a small negative peak coupled to the major positive one.[36] However, inspection of the crystal structure of hemoglobin shows that the planes of the heme groups are either nearly parallel or can have an angle of
50 - 60°.[50] Based on this it is unlikely that the tetramer form in its original structure can associate with the membrane in such an orientation where all the heme TDMs have a low angle somewhere in the range of 0 - 35° compared to the membrane surface, as suggested by LD (Figure 3). The higher sheet content of the CD spectra, slowly converting back to more helical curves resembling to that of free hemoglobin, further suggests that initially in 0d samples membrane bound hemoglobins are in an alternate conformation, potentially in subunits of the original tetramer.
Figure 3. Schematic description on the possible orientation range of the heme groups relative to the lipid bilayer.
As the studied REVs are products of the vesiculation process present in RBCs, by assuming that some of the changes observed above are reversible, these can also be relevant for better understanding how RBC vesiculation occur at the molecular level. A probable scenario is that the formation of hemoglobin – membrane complexes results in more rigid bilayer regions accompanied with major protein conformational changes, leading to a higher local -sheet content. The vesicles expressed at this point are most likely rather similar to 0d samples.
Although, precise techniques such as MAS (Magic-angle spinning) NMR[51,52] and cryo-electron microscopy[10,53] can be used to provide even atomic level details, determining also the
For internal use, please do not delete. Submitted_Manuscript
orientation of molecules with respect to EV membranes, these require complex sample preparation procedures and significant measurement efforts, such as frozen samples and highly sophisticated data processing. In contrast, flow-LD combined with CD represents a fast and efficient approach, which offers insight into secondary structure and relative orientation of membrane associated biomolecules with measurement times lower than 5 minutes.[30,36] Considering that the investigation occurs in solution phase, the technique also provides opportunity for kinetic analysis and tracking time dependent changes among which the latter was demonstrated here.
The application of polarized light spectroscopy on EVs is an exciting new direction with the potential of giving a wealth of information including changes in lipid bilayer composition and macromolecular structure. Data reveal that EVs can be reversibly oriented in shear flow, but are more rigid than similar size model DOPC liposomes. This indicates that the original lipid composition and membrane related biomacromolecule associations have a significant effect on membrane flexibility, a parameter directly reflected by the determined orientation factor.
Here, using the simple scenario of sample storage, we demonstrated that, similarly to force microscopy measurements[41], flow-LD could offer direct insight to vesicle rigidity and its changes via the orientation factor on a statistical basis. Further on, in case of REVs the contribution of the Soret band to the LD signal gives new insight into the orientation and distribution of hemoglobin relative to the phospholipid bilayer.
Our findings confirm the existence of membrane bound hemoglobin in REVs, which gradually detaches with storage time. Further development in purification protocols, identification of membrane probes more suitable for biomembranes, development of strategies reducing light scattering and thus enabling quantitative assessment of protein secondary structure are ways that are hoped to further increase future applicability of polarized light spectroscopy techniques on EVs.
Experimental Section
REV isolation from human blood erythrocytes The use of human blood samples was approved by the Scientific Ethics Committee of the Hungarian Health Scientific Council (ETT TUKEB 6449-2/2015). Red blood cells were isolated from the blood of healthy volunteers, collected at the Central Laboratory of the National Institute of Rheumatology and Physiotherapy, Budapest, Hungary. To obtain EVs from human red blood cells (RBCs), 15 mL blood was collected from healthy adult donors in tri- potassium ethylenediaminetetraacetic acid containing tubes (K3EDTA, VWR Hungary). Briefly, the erythrocytes were isolated via centrifugation at 2500 g for 15 min at 4 °C (Nüve NF 800R, swing out rotor). RBCs were washed with physiological salt solution until the platelets and the buffy coat was completely removed. Buffy coat free erythrocytes were suspended in PBS, and were kept at 4 °C for vesicle production. After 7 days the erythrocyte suspension was used for REV isolation. The cells and the cellular debris were removed by two centrifugation steps at 2500 g and 3000 g for 15 min at room temperature. The supernatant containing erythrocyte EV was collected and further ultracentrifugated at 138000 g for 60 min at 4 °C (Thermo Sorwall WX Ultra centrifuge, T- 1270 fixed angle rotor). The REV pellets were suspended in PBS, and stored at 4 °C until further use.
For spectroscopic experiments, the REV samples were purified from contaminants, i.e. soluble proteins and protein aggregates, on a Sepharose CL-2B column to perform size-exclusion chromatography
(SEC) according to a modified protocol published by Böing et al. The column with a diameter of 1.6 cm, height of 5.3 cm and total volume of 10.6 mL was washed 4 times with PBS buffer and then was loaded with platelet-free supernatant of erythrocyte (2.5 mL), followed by elution with PBS. After the sample passed the filter top, buffer was added. The first 2.5 mL of eluate was discarded and the next 2 mL eluate which contained REV was collected in 2 fractions of 1 mL.
DOPC liposome as reference material DOPC liposome were prepared by using the lipid thin film hydration technique at a lipid concentration of 1.3 mM. The lipid was dissolved in chloroform containing 50 vol%
methanol, which was then evaporated. The resulting lipid film was kept in vacuum for 8 hours to remove the residual traces of solvent. The dried lipid film was hydrated with PBS buffer. To achieve homogenous mixture repeated heating (37ºC) and cooling (-196ºC) steps were applied. The solution was extruded through polycarbonate filters with 200 nm pore size (at least 10 times) using a LIPEX extruder (Northern Lipids Inc., Canada).
Membrane probes employed Considering complexity of biomembranes, to acquire as much information as possible, we aimed to employ all three probes mentioned above, namely curcumin, RetA and Py. Initial attempts showed no insertion or association with the EV membrane, potentially indicating that human serum albumin (HSA), present in the solution, may bind the employed probe molecules. This was also confirmed by supporting docking simulations resulting in high energy binding of e.g. Py to HSA (For details see Molecular Docking paragraph and SFigure 7 in SI). Thus the final purification protocol involved Sepharose CL-2B columns in order to remove HSA and other plasma proteins from the samples as detailed above. In this way, both Py and RetA were able to insert into the lipid bilayer of REVs and thus the orientation factor, S, could be estimated. Despite several attempts, curcumin was not found to bind to the lipid membrane.
Pyrene and retinoic acid stock solutions were prepared with ethanol and were added to the liposome and REVs in order to have a final concentration of 57 µM and 33 µM, respectively.
In case of the freshly made, 0d, samples, the partial overlap of the Soret band from the heme group with the main absorption peak of RetA, rendered this probe unsuitable for S determination. Therefore, for these fresh vesicles only Py was used to determine S. As insertion angle of Py may be sensitive to the vesicle curvature and lipid composition.[24,25,27,28]
, its orientation was determined using eq. 2 for both the 200 nm DOPC vesicles, and the 28d EV samples based on RetA signal, which resulted in46.5°, and 42.6°, respectively.
REV samples investigated Measurements were initially carried out on freshly isolated (0d) REV samples. Further on, to determine orientation angles on samples free of the Soret band in the LD signal, as well as to address how suitable LD and CD are to track changes on EVs. Samples after storage for 2, 5, 8, 15 and 28 day were measured (2d, 5d, 8d, 15d, 28d, respectively). In standard protocols for EV studies a single freeze- thaw cycle and storage at -20 or -80 ºC only modestly affects the concentration and size of the vesicles, however, morphological changes may occur on the membrane distorting original state, which may perturb continuous observation. At higher temperature storage (+4 or +20 ºC) these changes can potentially be avoided, but an increase in size may be observed due to swelling.[55,56] In the present study the REV samples were stored at +4 ºC. DLS measurements were carried out on the above samples to confirm that samples maintain their original morphology (STable1).
Supporting Information
Details of performed assays (Bradford and Stewart assays), FF- TEM, DLS, UV-Vis and Polarized light spectroscopy, ATR-FTIR
For internal use, please do not delete. Submitted_Manuscript
measurements, HSA-Py Molecular docking interactions, DOPC liposome and hemoglobin measurements.
Acknowledgements
This work was funded by grants provided by the Hungarian Research Fund (OTKA-109588 and PD 121326), by the Momentum programme (LP2016-2), by the National Competitiveness and Excellence Program (NVKP_16-1-2016- 0007) and BIONANO_GINOP-2.3.2-15-2016-00017. The Marie Curie fellowship for T. B-S. (MSCA-IF BARREL 660030), and the János Bolyai Research Scholarships (J.M.; Z.V.) are greatly acknowledged.
Keywords: extracellular vesicles, flow linear dichroism spectroscopy, transition moment orientation, pyrene and retinoic acid probe molecules, liposome
[1] B. György, T. G. Szabó, M. Pásztói, Z. Pál, P. Misják, B. Aradi, V.
László, É. Pállinger, E. Pap, Á. Kittel, Cell. Mol. Life Sci. 2011, 68, 2667–2688.
[2] D.-S. Choi, D.-K. Kim, Y.-K. Kim, Y. S. Gho, Proteomics 2013, 13, 1554–1571.
[3] C. Sheridan, Nat. Biotechnol. 2016, 34, 359–360.
[4] T. An, S. Qin, Y. Xu, Y. Tang, Y. Huang, B. Situ, J. M. Inal, L. Zheng, J.
Extracell. Vesicles 2015, 4, 27522.
[5] J. Van Deun, P. Mestdagh, R. Sormunen, V. Cocquyt, K. Vermaelen, J. Vandesompele, M. Bracke, O. De Wever, A. Hendrix, J. Extracell.
Vesicles 2014, 3, 24858.
[6] D. D. Taylor, S. Shah, Methods 2015, 87, 3–10.
[7] Z. Varga, Y. Yuana, A. E. Grootemaat, E. van der Pol, C. Gollwitzer, M. Krumrey, R. Nieuwland, J. Extracell. Vesicles 2014, 3, 23298.
[8] E. van der Pol, F. Coumans, Z. Varga, M. Krumrey, R. Nieuwland, J.
Thromb. Haemost. 2013, 11, 36–45.
[9] C. Gardiner, Y. J. Ferreira, R. A. Dragovic, C. W. G. Redman, I. L.
Sargent, J. Extracell. Vesicles 2013, 2, 19671.
[10] A. Poliakov, M. Spilman, T. Dokland, C. L. Amling, J. A. Mobley, The Prostate 2009, 69, 159–167.
[11] V. Palmieri, D. Lucchetti, I. Gatto, A. Maiorana, M. Marcantoni, G.
Maulucci, M. Papi, R. Pola, M. De Spirito, A. Sgambato, J.
Nanoparticle Res. 2014, 16, DOI 10.1007/s11051-014-2583-z.
[12] E. J. van der Vlist, E. N. M. Nolte-’t Hoen, W. Stoorvogel, G. J. A.
Arkesteijn, M. H. M. Wauben, Nat. Protoc. 2012, 7, 1311–1326.
[13] V. Pospichalova, J. Svoboda, Z. Dave, A. Kotrbova, K. Kaiser, D.
Klemova, L. Ilkovics, A. Hampl, I. Crha, E. Jandakova, et al., J.
Extracell. Vesicles 2015, 4, 25530.
[14] R. Szatanek, M. Baj-Krzyworzeka, J. Zimoch, M. Lekka, M. Siedlar, J.
Baran, Int. J. Mol. Sci. 2017, 18, 1153.
[15] C. Gardiner, D. D. Vizio, S. Sahoo, C. Théry, K. W. Witwer, M.
Wauben, A. F. Hill, J. Extracell. Vesicles 2016, 5, 32945.
[16] J.-D. Tissot, G. Canellini, O. Rubin, A. Angelillo-Scherrer, J. Delobel, M. Prudent, N. Lion, Transl. Proteomics 2013, 1, 38–52.
[17] J. Mihály, R. Deák, I. C. Szigyártó, A. Bóta, T. Beke-Somfai, Z. Varga, Biochim. Biophys. Acta BBA - Biomembr. 2017, 1859, 459–466.
[18] P. Pinto da Silva, J. Cell Biol. 1972, 53, 777–787.
[19] T. Arakawa, T. Kobayashi-Yurugi, Y. Alguel, H. Iwanari, H. Hatae, M.
Iwata, Y. Abe, T. Hino, C. Ikeda-Suno, H. Kuma, et al., Science 2015, 350, 680–684.
[20] G. J. C. G. M. Bosman, E. Lasonder, M. Luten, B. Roerdinkholder- Stoelwinder, V. M. J. Novotný, H. Bos, W. J. De Grip, Transfusion (Paris) 2008, 48, 827–835.
[21] S. M. Waugh, P. S. Low, Biochemistry (Mosc.) 1985, 24, 34–39.
[22] H. U. Lutz, A. Bogdanova, Front. Physiol. 2013, 4, 387.
[23] M. C. De Rosa, C. Carelli Alinovi, A. Galtieri, A. Russo, B. Giardina, IUBMB Life 2008, 60, 87–93.
[24] M. Kogan, T. Beke-Somfai, B. Nordén, Chem. Commun. Camb. Engl.
2011, 47, 7356–7358.
[25] S. Rocha, M. Kogan, T. Beke-Somfai, B. Nordén, Langmuir ACS J.
Surf. Colloids 2016, 32, 2841–2846.
[26] M. Kogan, B. Feng, B. Nordén, S. Rocha, T. Beke-Somfai, Langmuir ACS J. Surf. Colloids 2014, 30, 4875–4878.
[27] M. Ardhammar, N. Mikati, B. Nordén, J. Am. Chem. Soc. 1998, 120, 9957–9958.
[28] B. Nordén, A. Rodger, T. Dafforn, Linear Dichroism and Circular Dichroism: A Textbook on Polarized-Light Spectroscopy, RSC Publ, Cambridge, 2010.
[29] M. Kogan, B. Nordén, T. Beke-Somfai, Chem. Phys. Lipids 2013, 175–176, 105–115.
[30] M. R. Hicks, A. Damianoglou, A. Rodger, T. R. Dafforn, J. Mol. Biol.
2008, 383, 358–366.
[31] M. R. Hicks, J. Kowałski, A. Rodger, Chem. Soc. Rev. 2010, 39, 3380–3393.
[32] A. Rodger, J. Rajendra, R. Marrington, M. Ardhammar, B. Nordén, J.
D. Hirst, A. T. B. Gilbert, T. R. Dafforn, D. J. Halsall, C. A. Woolhead, et al., Phys Chem Chem Phys 2002, 4, 4051–4057.
[33] L. H. Fornander, B. Feng, T. Beke-Somfai, B. Nordén, J. Phys. Chem.
B 2014, 118, 9247–9257.
[34] A. Reymer, K. Frykholm, K. Morimatsu, M. Takahashi, B. Norden, Proc. Natl. Acad. Sci. 2009, 106, 13248–13253.
[35] F. R. Svensson, P. Lincoln, B. Nordén, E. K. Esbjörner, Biochim.
Biophys. Acta 2011, 1808, 219–228.
[36] C. E. B. Caesar, E. K. Esbjörner, P. Lincoln, B. Nordén, Biophys. J.
2009, 96, 3399–3411.
[37] F. R. Svensson, P. Lincoln, B. Nordén, E. K. Esbjörner, J. Phys. Chem.
B 2007, 111, 10839–10848.
[38] E. J. van Kampen, W. G. Zijlstra, Adv. Clin. Chem. 1983, 23, 199–257.
[39] S. M. Kelly, T. J. Jess, N. C. Price, Biochim. Biophys. Acta 2005, 1751, 119–139.
[40] K. Matsuo, R. Yonehara, K. Gekko, J. Biochem. (Tokyo) 2004, 135, 405–411.
[41] D. Vorselen, S. van Dommelen, R. Sorkin, J. Schiller, R. van Wijk, R.
Schiffelers, G. Wuite, W. Roos, 2017.
[42] O. Rubin, G. Canellini, J. Delobel, N. Lion, J.-D. Tissot, Transfus. Med.
Hemotherapy Off. Organ Dtsch. Ges. Transfusionsmedizin Immunhamatologie 2012, 39, 342–347.
[43] M. J. A. Tanner, Curr. Opin. Hematol. 2002, 9, 133–139.
[44] J. A. Walder, R. Chatterjee, T. L. Steck, P. S. Low, G. F. Musso, E. T.
Kaiser, P. H. Rogers, A. Arnone, J. Biol. Chem. 1984, 259, 10238–
10246.
[45] P. Datta, S. Chakrabarty, A. Chakrabarty, A. Chakrabarti, Biochim.
Biophys. Acta BBA - Biomembr. 2008, 1778, 1–9.
[46] G. P. Gorbenko, Biochim. Biophys. Acta BBA - Biomembr. 1998, 1370, 107–118.
[47] A. Pieniazek, K. Gwozdzinski, Oxid. Med. Cell. Longev. 2015, 2015, 1–9.
[48] S. A. Mendanha, J. L. V. Anjos, A. H. M. Silva, A. Alonso, Braz. J.
Med. Biol. Res. 2012, 45, 473–481.
[49] L. Bossi, S. Alemà, P. Calissano, E. Marra, Biochim. Biophys. Acta BBA - Biomembr. 1975, 375, 477–482.
[50] M. Paoli, R. Liddington, J. Tame, A. Wilkinson, G. Dodson, J. Mol. Biol.
1996, 256, 775–792.
[51] T. Polenova, R. Gupta, A. Goldbourt, Anal. Chem. 2015, 87, 5458–
5469.
[52] C. Glaubitz, I. J. Burnett, G. Gröbner, A. J. Mason, A. Watts, J. Am.
Chem. Soc. 1999, 121, 5787–5794.
[53] X.-C. Bai, C. Yan, G. Yang, P. Lu, D. Ma, L. Sun, R. Zhou, S. H. W.
Scheres, Y. Shi, Nature 2015, 525, 212–217.
[54] A. N. Böing, E. van der Pol, A. E. Grootemaat, F. A. W. Coumans, A.
Sturk, R. Nieuwland, J. Extracell. Vesicles 2014, 3, 23430.
[55] Á. M. Lőrincz, C. I. Timár, K. A. Marosvári, D. S. Veres, L. Otrokocsi, Á. Kittel, E. Ligeti, J. Extracell. Vesicles 2014, 3, 25465.
[56] Y. Yuana, A. N. Böing, A. E. Grootemaat, E. van der Pol, C. M. Hau, P.
Cizmar, E. Buhr, A. Sturk, R. Nieuwland, J. Extracell. Vesicles 2015, 4, 29260.
For internal use, please do not delete. Submitted_Manuscript
Polarized light spectroscopy techniques, which are commonly used on model liposomes in biophysical and structural chemistry studies, can provide important information on red blood cell-derived extracellular vesicles. The Soret-band of linear dichroism spectra gives insight into the distribution and relative orientation of hemoglobin complexes associated to membrane components.
Dr. Imola Cs. Szigyártó, Róbert Deák, Dr. Judith Mihály, Dr. Sandra Rocha, Dr.
Ferenc Zsila, Dr. Zoltán Varga, Dr.
Tamás Beke-Somfai Page 1. – Page 6.
Flow-Alignment of Extracellular Vesicles:
Structure and Orientation of Membrane Associated Biomacromolecules Studied with Polarized Light