Glutamate-Oxaloacetate Transaminase
Hans-Ulrich Bergmeyer and Erich Bernt
Glutamate-oxaloacetate transaminase ( G O T ) has been detected in micro-organisms and in all human and animal tissues so far investigated. In humans
1
) the richest source is heart muscle, followed b y * ) : brain, liver, gastric mucosa, adipose tissue, skeletal muscle, kidney, etc., and finally serum with substantially smaller amounts.
Several possibilities exist for the measurement o f activity 2): paper chromatography o f the substrates or reaction products after incubation (refer to equation 1); spectrophotometric measurement o f the oxaloacetate formation at 280 mu.; manometric determination of, for example, glutamic acid with glutamic acid decarboxylase. The most widely used methods involve the measurement o f the oxalo
acetate formed from aspartate and a-oxoglutarate: 1. by an enzymatic indicator reaction with malic dehydrogenase and reduced diphosphopyridine nucleotide ( D P N H ) ; 2. by the use o f 2,4-dinitro
phenylhydrazine as a ketone trapping reagent.
The pyridoxal phosphate required as c o e n z y m e
3
.
4
) is present in sufficient quantities in serum and all tissue samples.
Determination with Malic Dehydrogenase as Indicator Enzyme
Principle
Glutamate-oxaloacetate transaminase ( G O T ) catalyses the reaction:
(1) L-Glutamate + oxaloacetate ; ^ L-aspartate -f- a-oxoglutarate
The activity o f the transaminase is measured by the increase of oxaloacetate with time as the reaction proceeds from right to left. The oxaloacetate is determined with the indicator reaction catalysed by malic dehydrogenase ( M D H ) :
(2) Oxaloacetate + D P N H + H+ , malate + D P N +
The oxidation o f D P N H , which is proportional to the amount o f oxaloacetate formed, is measured by the decrease in the optical density at 340 or 366 mu.. The following description for the measure
ment o f transaminase activity in serum is essentially that o f Karmen
5
\ although the substrate concen
trations have been modified
6
).
Optimum Conditions for Measurements
The optimum p H and substrate concentrations have been investigated by several workers
5
.
7
). In human serum the following relationship has been established for the enzyme originating from heart (after myocardial infarction) and from liver (in hepatitis)
6
): In the p H range 6 —8.5 the activity is depen
dent o n the aspartate concentration, but practically independent o f the a-oxoglutarate concentration.
With aspartate concentrations > 2 x 1 0
_1
M there is a wide activity o p t i m u m between p H 7 and 8.5.
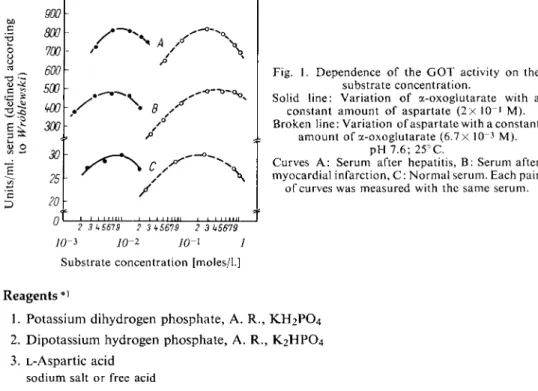
The activities measured with various substrate concentrations at p H 7.6 and 2 5 ° C are given in
*) Units/mg. tissue protein; if related to the fresh weight of tissue the order is different.
J
) F. W. Schmidt, Lecture Marburg/Lahn, Germany, Dec. 1959.
2
) See P. P. Cohen in S. P. Colowick and TV. O. Kaplan: Methods in Enzymology. Academic Press, N e w York 1955, Vol. II, p. 178.
3
) D. E. Green, L. F. Leloir and V. Nocito, J. biol. Chemistry 161, 559 [1945].
4) D. O'Kane and /. C. Gunsalus, J. biol. Chemistry 170, 425 [1947].
5) A. Karmen, J. clin. Invest. 34, 131 [1955].
6
> H.-U. Bergmeyer and E. Bernt, unpublished.
7
> E. Schmidt and F. W. Schmidt, personal communication.
838 Section C : Measurement of Enzyme Activity
Figure 1. Optimum values are obtained in phosphate buffer with a-oxoglutarate concentrations from 6 x l 0 ~
3
to 10~
2
M and aspartate concentrations from 2 x l 0
-1
to 5 x l 0
_1
M. Variation of the aspartate concentration from 3 x 10~
2
to 3X 1 0
-1
M in relation to the a-oxoglutarate concentration only leads to a slight alteration o f the optimum activity and vice versa.
Approximately optimum and technically favourable conditions for assay in normal serum after myocardial infarction and in hepatitis are: phosphate buffer p H 7.6, ca.lx 1 0
-3
M a-oxoglutarate a n d 2 x l 0
_1
M aspartate. A sufficiently rapid indicator reaction is assured by using 2 X 10~
4
M D P N H and 25 u.g. malic dehydrogenase per 3 ml. assay mixture.
Fig. 1. Dependence of the G O T activity on the substrate concentration.
Solid line: Variation o f a-oxoglutarate with a constant amount o f aspartate ( 2 x l 0
_1
M).
Broken line: Variation of aspartate with a constant amount of a-oxoglutarate (6.7 X 10~
3
M).
p H 7.6; 25°C.
Curves A : Serum after hepatitis, B : Serum after myocardial infarction, C : Normal serum. Each pair of curves was measured with the same serum.
2 3US679 2 3 k5619 2 3 kS619
10-1 10ri io-i
i
Substrate concentration [moles/1.]
Reagents *>
1. Potassium dihydrogen phosphate, A. R., KH2PO4 2. Dipotassium hydrogen phosphate, A. R., K2HPO4 3. L-Aspartic acid
sodium salt or free acid
4. a-Oxoglutaric acid
sodium salt or free acid; commercial preparation, see p. 1024.
5. Reduced diphosphopyridine nucleotide, DPNH
sodium salt, D P N H- N a 2 - Commercial preparation, see p. 1011.
6. Malic dehydrogenase, MDH
from pig heart, suspension in 2.8 M a m m o n i u m sulphate solution. Commercial preparation, s e e p . 988.
Purity of the indicator e n z y m e
The M D H preparation should have a specific activity of at least 2 0 0 0 units/mg. according to Bucher**, corresponding to > 7 5 0 0 units/mg. according to Ochoa
9
* or > 35 units/mg. according
** Complete reagent kits are available commercially, see p. 1036.
8
> G. Beisenherz, J. H. Boltze, Th. Bucher, R. Czok, K. H. Garbade, E. Meyer-Arendt and G. Pflei- derer, Z. Naturforsch. 8b, 555 [1953].
9
* S. Ochoa in S. P. Colowick and N. O. Kaplan: Methods in Enzymology. Academic Press, N e w York 1955, Vol. I, p. 735.
T3 O
7 3 ^
a 700 600 500
300 30 25 20 n
/
\
/ \ B / s JO / p
/
1 1 1 1 1 I1L1 1 L_L.il 1111 1 L 1 1 1 III!
to Racker
1Q
). It should not be contaminated by more than: 0.03 % glutamate-oxaloacetate trans
aminase (measured with ca. 0.2 \ig. pyridoxal phosphate per assay) or 0.03 % glutamic dehydro
genase (relative to the specific M D H activity).
Preparation of Solutions (for ca. 20 determinations)
To prevent the growth of micro-organisms, sterilize the containers.
I. Phosphate-aspartate solution (0.1 M phosphate buffer pH 7.6; 2.5 x 10 _1
M aspartate):
Dissolve 0.175 g. K H 2 P 0 4 , 1.742 g. K 2 H P 0 4 and ca. 3.9 g. Na-L-aspartate or 3.3 g.
L-aspartic acid in doubly distilled water and make up to 100 ml. If free aspartic acid is used adjust the pH of the solution to 7.6 with 1 N NaOH before dilution.
II. a-Oxoglutarate (ca. 0.2 M):
Dissolve ca. 114 mg. Na-a-oxoglutarate or 88 mg. a-oxoglutaric acid in doubly distilled water and make up to 3 ml. If the free acid is used adjust to pH 7.6 with 1 N NaOH before dilution.
III. Reduced diphosphopyridine nucleotide (1.2 x 10~2 M p-DPNH):
Dissolve 15 mg. DPNH-Na 2 in 1.5 ml. solution I.
IV. Malic dehydrogenase, MDH (0.5 mg. protein/ml.):
Dialyse the enzyme suspension in ammonium sulphate solution for three periods of 4 hours at0°C against 200 volumes of 0.01 M potassium phosphate (pH 7.6) each time.
Dilute the contents of the dialysis sac with glycerol to give 50% (v/v) glycerol-water and 0.5 mg. protein/ml.
Stability of the s o l u t i o n s
Store all solutions, stoppered, in a refrigerator at 0 to 4 ° C . Prepare the D P N H solution freshly each week and the a-oxoglutarate solution each fortnight. The remaining solutions are stable almost indefinitely. Deterioration of the solutions, especially the phosphate-aspartate solution, is usually caused by bacterial contamination. This can be prevented by the addition of 0.3 ml. chloroform.
Pour out the day's requirement of the solution; do not use a pipette.
Procedure
Spectrophotometric m e a s u r e m e n t s
Use only fresh serum free from haemolysis. If the serum to be examined is strongly coloured prepare a blank containing 2.5 ml. water + 0.5 ml. serum or 3 ml. water + 0.03 ml. DPNH solution (III). Measure against this blank. Otherwise measure against air or doubly distilled water.
Wavelength: 340mu. or 366 mu.; light path: 1 cm.; final volume: 3.0 ml.; temperature: 25°C (constant temperature cuvette holder).
io) / . Cooper, P. A. Srere, M. Tabachniek and E. Racker, Arch. Biochem. Biophysics 74, 306 [1958],
840 Section C: Measurement of Enzyme Activity
Pipette successively into the cuvette:
2.30 ml. phosphate-aspartate solution (I) 0.05 ml. DPNH solution (III)
0.05 ml. MDH solution (IV) 0.50 ml. serum.
Mix with a glass or plastic rod flattened at one end and equilibrate for ca. 5 —10 min. *>.
Mix in
0.10ml. a-oxoglutarate solution (II)
to start the reaction. After ca. 1 min. start a stopwatch and read the optical density every 2 min. for a period of 10 min. With very high GOT activity a period of 2 to 4 min. is sufficient.
AE/min. (366 mu.) should not exceed 0.030; if necessary, dilute the serum 5 to 10 times with solution I.
The traces of GOT in the MDH preparation should be determined for each MDH prepara
tion. For this, doubly distilled water containing 0.1 u,g. pyridoxal phosphate is substituted for serum and measurements are made against a cuvette containing doubly distilled water (blank).
Modification of the procedure
1. If a constant temperature cuvette holder is not available, mix solutions I, III, IV and the serum in a test tube and equilibrate in a water bath at 25° C for 10 min. Start the trans
aminase reaction by mixing in the a-oxoglutarate solution (II) and pour the mixture into a cuvette for the measurements. It is assumed that the room temperature is similar to the temperature of the measurements and that during the measurements the reaction mixture will not cool by more than 1 —2°C (error <10%).
2. To save time in a series of measurements proceed as described under 1. but measure the initial optical density immediately after the addition of a-oxoglutarate, pour the reaction solution back into the test tube, after 10 min. pour the reaction solution once more into the cuvette and read the final optical density. This procedure is valid, because a) volume losses need not be considered, b) the time course of the GOT reaction is linear and c) the temperature remains more constant than in the first case.
Calculations
Calculate the mean of the measured AE/min. values and subtract from this the blank value due to any traces of transaminase in the M D H preparation. U s e the difference for the calculations.
According t o
1 1
) a unit is the amount of transaminase in 1 ml. serum, which decreases the optical density of D P N H at 340 mu. by 0.001 in 1 min., in a 3 ml. assay mixture at 25° C. It follows that with 0.5 ml. serum:
( A E
3
40
/ m i n . ) X 1 0 0 0 x 2 = G O T units/ml. serum.For measurements at 366 mu. it is necessary to multiply by 1.89 because of the ratio of the extinction coefficients of D P N H at 340 and 366 mpt. Therefore:
(A
3 4
o/min.) x 2000 = ( A E3 6
6/ m i n . ) X 3780 = G O T units/ml. serum.*) Pyruvic acid, oxaloacetic acid and other substrates react with the respective DPN-linked enzymes in the serum resulting in the oxidation of D P N H . After preliminary incubation and addition of a-oxoglutarate only the transaminase reaction occurs.
n ) / . S. LaDue, F. Wroblewski and A. Karmen, Science [Washington] 120, 497 [1945].
Example
When 0.5 ml. normal serum was assayed the following optical densities were measured at 366 mu,:
before addition of a-oxoglutarate 0.310 after addition of a-oxoglutarate 0 min. 0.315
2 min. 0.303 4 min. 0.288 6 min. 0.278 8 min. 0.265 10 min. 0.252
M e a n :
Blank o f the M D H preparation: A E
B l k
/ m i n . = 0.001/min.; AE/min. — EB
i k /m i n
- = 0.0053/min.
0.0053 X 3780 = 20 G O T units/ml. serum.
A E - 0.012 A E = 0.015 A E = 0.010 A E - 0.013 A E = 0.013 A E = 0.0126/2 min.
A E = 0.0063/min.
C o n v e r s i o n to other u n i t s According to BUcher et al.
8
> a unit o f D P N or TPN-dependent dehydrogenases is the amount o f enzyme contained in 1 ml., which alters the optical density of D P N H ( T P N H ) at 366 m\i by 0.100 in 100 s e c , with a light path o f 1 cm. and at 25°C. Therefore:
1 unit (BUcher): A E
3 6 6
/ 1 0 0 sec. = 0.100/100 sec. 1 unit (Wroblewski):AE34o/min. = 0.001/min.
A E
3 6
6 / m i n . = 0.060/min.AE34o/min. = 0.113/min.
for an assay volume of 3 ml.: AE34o/min. = 0.0377/min.
37.7 units (Wroblewski) = 1 unit (BUcher); 0.0265 units (BUcher) = 1 unit (Wroblewski).
T o calculate directly from the measured optical density difference:
for 340 mpi: (AE/min.) X 2000 = units (Wroblewski)
(AE/min.) X 2000 X 0.0265 = (AE/min.) X 53 = units (BUcher) for 366 mu,: (AE/min.) X 3780 = units (Wroblewski)
(AE/min.) X 3780 X 0.0265 = (AE/min.) X 101 = units (BUcher)
For conversion to other units, see p. 33.
Stability of the Enzyme in the Serum Sample
According to
1 2
> the G O T activity in serum decreases by about 22 % after 24 hours at r o o m temperature, by about 1 5 % at + 4 ° C and by about 5 % at - 2 0 ° C.
Sources of Error
The presence of glutamic dehydrogenase in the sample interferes with the reaction, because it cata
lyses the reduction of a-oxoglutarate with the simultaneous oxidation of D P N H . Glutamic dehydro
genase is barely present in normal serum, but in pathological serum it may be present in significant amounts. If the presence o f a m m o n i u m ions is avoided in the assay (by use of a solution o f M D H in glycerol-water), then the glutamic dehydrogenase reaction cannot proceed. The Michaelis con
stant of this enzyme for a m m o n i u m ions is so large (5.6 X 10~
2
M) that it remains inactive even with the raised ammonia concentrations which occur in some pathological sera.
12) H. SUdhof and E. Wotzel, Klin. Wschr. 38, 1165 [I960].
842 Section C: Measurement of Enzyme Activity
Effects of Therapeutic Agents
Therapy with cortisone and its derivatives significantly decreases the raised serum G O T activity in hepatitis within a few hours.
Details for Measurements in Tissue
According to Bucher et al.
13
> G O T belongs to both the intra- and extramitochondrial located enzy
mes. Simple homogenization in a Potter-Elvehjem apparatus (refer to p. 49) is not sufficient to c o m pletely extract the enzyme. The activity is therefore determined in a homogenate prepared according to
1 4
\ but the measured units are related to the soluble protein in the supernatant as determined by the biuret method after centrifuging at high speed. For measurements on, for example, liver punc
tures, 1 mg. fresh weight is sufficient.
The optimum conditions for human serum are not necessarily valid for sera from other species or for other tissues. The position of the activity optima for human serum shown in Fig. 1 may be displaced considerably. In preliminary experiments o n mouse liver h o m o g e n a t e
5
) two to five times higher concentrations of L-aspartate and a-oxoglutarate were necessary to obtain optimum activity.
Animal organs, especially liver, kidney and brain D are rich in glutamic dehydrogenase. It is necessary to determine the amount o f interference due to this enzyme, since this occurs in spite of the use of ammonia-free reagents: the phosphate-aspartate buffer is substituted by one containing a-oxo
glutarate and the G O T reaction is started with L-aspartate after measurements of the glutamic de
hydrogenase activity. The difference of the two AE/min. values is used for the calculation o f the G O T activity.
Colorimetric Determination with 2,4-Dinitrophenylhydrazine
The G O T activity can be measured colorimetrically by the use of two points, because the course o f the reaction is linear with time. The first colorimetric method was described b y
1 5
) : The reaction product oxaloacetate was quantitatively decarboxylated to pyruvate with aniline citrate as catalyst and the pyruvate was determined as the 2,4-dinitrophenylhydrazone. Some later workers (e.g.
16
)) rejected this method in favour of a more simplified procedure, although other workers (e.g. n - i 9 ) ) retained it. The simplified procedure has proved more successful ( e . g .
2 0
) ) .
Principle
After a fixed time the 2,4-dinitrophenylhydrazone of the reaction product, oxaloacetate, formed according to equation (1), (see p. 837), is determined spectrophotometrically in alkaline solution.
Some of the oxaloacetate decarboxylates spontaneously to pyruvate. The assay mixture therefore contains oxaloacetate, pyruvate and a-oxoglutarate, all o f which form 2,4-dinitrophenylhydrazones with absorption maxima at different wavelengths (Fig. 2). In order to keep the contribution of the a-oxoglutarate hydrazone to the colour low, the measurements are made at wavelengths (about 500 to 550 m[i) higher than the wavelength of maximum absorption since this allows the greatest differentiation between the optical densities of the three hydrazones.
13) Th. Bucher and P. Baum, Lecture Berlin 1958.
14) E. Schmidt, F. W. Schmidt and E. Wildhirt, Klin. Wschr. 36, 179 [1958].
1
5
) N. E. Tonhazy, N. G. White and W. W. Umbreit, Arch. Biochem. Biophysics 28, 36 [1950].
16) S. Reitman and S. Frankel, Amer. J. clin. Pathol. 28, 56 [1956].
17) P. Cabaud, R. Leeper and F. Wroblewski, Amer. J. clin. Pathol. 26, 1101 [1956].
18) U. C. Dubach, Schweiz. med. Wschr. 87, 185 [1957].
19) D. F. Ashman, Acta ci. venezolana 10, 14 [1959].
20) A. P. Hansen, Nordisk Med. 61, 799 [1959].
The extinction coefficients of the 2,4-dinitrophenylhydrazones of pyruvate or oxaloacetate cannot be used for the calculation of the experimental results for the reason which has been explained above.
The method is best standardized by direct comparison with the spectrophotometric method using M D H as indicator enzyme (see above). For routine use it is sufficient to use standards containing
Fig. 2. Absorption spectra of equimolar alkaline solutions of the 2,4-dinitrophenyl
hydrazones of (A) a-oxoglutarate, (B) oxa
loacetate and (C) pyruvate (according to
1 6
>).
I 1 1 . I 390 k30 k70 510
Wavelength [mfx]
different amounts of pyruvate, but with a constant molecular amount o f pyruvate + a-oxoglutarate.
The standard curves (abscissa: G O T activity; ordinate: optical density) are non-linear. Oxaloacetate is not suitable as a standard because of its instability in aqueous solution.
Reagents *>
1. Potassium dihydrogen phosphate, A. R., KH2PO4 2. Dipotassium hydrogen phosphate, A. R., K2HPO4 3. L-Aspartic acid
sodium salt or free acid.
4. a-Oxoglutaric acid
sodium salt or free acid; commercial preparation, see p. 1024.
5. Sodium pyruvate
commercial preparation, see p. 1027.
6. 2,4-Dinitrophenylhydrazine 7. Hydrochloric acid, A. R., I N 8. Sodium hydroxide, A. R., as pellets
Preparation of Solutions (for ca. 50 determinations)
To prevent the growth of micro-organisms, sterilize the containers.
I. Substrate-buffer solution (0.1 M phosphate buffer, pH 7.4; 0.1 M L-aspartate; 2 x 1 0 _ 3
M a-oxoglutarate):
Dissolve 1.50 g. K 2 H P 0 4 , 0.20 g. K H 2 P 0 4 , 0.039 g. Na-a-oxoglutarate or 0.030 g. a-oxo
glutaric acid and 1.57 g. Na-L-aspartate or 1.32 g. L-aspartic acid in <100 ml. doubly distilled water. Adjust the pH to 7.4 with 0.4 N NaOH (solution III) using a glass electrode and dilute to 100 ml. with doubly distilled water.
II. Ketone reagent (10~
3
M 2,4-dinitrophenylhydrazine):
Dissolve 20 mg. 2,4-dinitrophenylhydrazine in 1 N HC1 and make up to 100 ml.
*) Complete reagent kits are commercially available, see p. 1036.
844 Section C : Measurement of Enzyme Activity
III. Sodium hydroxide (0.4 N):
Dissolve 16 g. NaOH in doubly distilled water and make up to 1000 ml.
IV. Sodium pyruvate (2 x 10⁻³ M):
Dissolve 22 mg. Na pyruvate in doubly distilled water and make up to 100 ml.
Stability of the s o l u t i o n s
The N a O H and ketone reagent are stable indefinitely if well stoppered. Store the substrate-buffer and pyruvate solution at 0 —4°C. So long as the growth of micro-organisms is prevented (by addition of a few drops of chloroform) the solutions are stable for at least a month.
Procedure
Use only fresh serum free from haemolysis.
Enzymatic reaction
Wavelength: 530 or 546 mu.; light path: 1 cm.; temperature: 37°C (water bath). A blank in which the serum is added after the incubation is required for each sample. Measure against this blank.
Pipette into test tubes:
Experimental Blank 1 ml. substrate-buffer solution (I) 1 ml. substrate-buffer solution (I)
0.2 ml. serum — mix by inversion and incubate do not incubate. Add
for exactly 60 min. Add
1 ml. ketone reagent (soln. II) 1 ml. ketone reagent (soln. II)
— 0.2 ml. serum
Allow to stand for 20 min. at room temperature. Mix into the experimental and blank tubes 10 ml. NaOH (solution III)
and after 5 min. read the optical density of the experimental tube against the blank. With results of over 150 units repeat the measurements with serum diluted 1 :10 with physiological saline.
Standard curve and table of v a l u e s
Pipette successively into test tubes:
Na pyruvate Buffer-substrate Test tube No. solution (IV) solution (I)
[ml.] [ml.]
1 0.0 1.0
2 0.05 0.95
3 0.10 0.90
4 0.15 0.85
5 0.20 0.80
6 0.25 0.75
Pipette into each test tube:
0.2 ml. water
1.0 ml. ketone reagent (solution II).
Mix and allow to stand for 20 min. at room temperature. Add 10.0 ml. NaOH (solution III)
to each tube, mix and after 5 min. read the optical densities against tube No. 1. Plot the optical densities (ordinate) against GOT units (abscissa). By comparison with the spectro
photometric method (MDH as indicator enzyme) the following relationship was found:
Test tube No. 2 = 21 GOT units/ml. serum Test tube No. 3 = 42 GOT units/ml. serum Test tube No. 4 = 64 GOT units/ml. serum Test tube No. 5 = 97 GOT units/ml. serum Test tube No. 6 = 140 GOT units/ml. serum
By direct comparison of the two methods the following table was constructed for measure
ments at 546 mu..
Optical density Units Optical density Units (according to
1 0 )
) (according to 1 0 )
) 0.020 8 0.160 71 0.040 16 0.180 83 0.060 24 0.200 100 0.080 32 0.220 118 0.100 40 0.240 140 0.120 49 0.260 167 0.140 59
Calculations
Either read off the units for the measured optical densities from the standard curve, or for measure
ments at 546 mu, obtain the units from the above table.