HEDGING UNDER LIQUIDITY CONSTRAINTS
1Barbara Dömötör
ABSTRACT
Although risk management can be justifi ed by fi nancial distress, the theoreti- cal models usually contain hedging instruments free of funding risk. In practice, management of the counterparty risk in derivative transactions is of enhanced importance, consequently not only is trading on exchanges subject to the pres- ence of a margin account, but also in bilateral (OTC) agreements parties will require margins or collateral from their partners in order to hedge the mark-to- market loss of the transaction. Th e aim of this paper is to present and compare two models where the fi nancing need of the hedging instrument also appears, infl uencing the hedging strategy and the optimal hedging ratio. Both models con- tain the same source of risk and optimisation criterion, but the liquidity risk is modelled in diff erent ways. In the fi rst model, there is no additional fi nancing resource that can be used to fi nance the margin account in case of a margin call, which entails the risk of liquidation of the hedging position. In the second model, the fi nancing is available but a given credit spread is to be paid for this, so hedging can become costly.2
JEL codes: G17, G32
Keywords: risk management, hedging, fi nancing liquidity
1. INTRODUCTION
Th e rationale of corporate risk management is justifi ed in fi nancial theories by market imperfections or incentives. Models analysing the eff ects of taxes, trans- action costs, information asymmetry or the costs of fi nancial distress all con- clude that a perfect hedge is optimal in most cases3 (Dömötör, 2014). Th eories
1 Th is paper is based on Barbara Dömötör: Market Risk Hedging under Liquidity Constraints.
2 Th e study was supported by the project entitled “Research into Innovative Mathematical Models for Measuring Institutional Risks Defi ned by the Basel Regulation and Calculating Capital Require- ments in the Areas of Market, Operational, Liquidity and Secondary Risks, as well as Behavioural Price Movement Forecasting of Financial Products,” fi nanced by the New Széchenyi Plan (project code: PIAC_13-1-2013-0073), with the use of European Union funding.
3 Th e process of corporate risk management and the Hungarian practice is detailed in Walter (2014).
vindicating corporate risk management for funding or incentive-based reasons are supported by empirical experience, while explanations connected to taxation or transaction costs have not been corroborated (Hommel, 2005).
Th e fi nancial crisis that began in 2007 proved that inadequate management of li- quidity can be a source of serious problems, and that no market participant has access to unlimited fi nancing. Consequently, the issue of fi nancing cannot be ne- glected in models of market risk management, while liquidity constraints also apply to hedging positions, given that losses on derivatives generate a credit risk exposure.
Th is paper initially provides a short overview of the appearance of fi nancing in models of corporate risk management, then presents two models focusing on the eff ects of funding risk on hedging positions. Finally the models and their results are compared.
2. THE EFFECT OF FINANCING ON RISK MANAGEMENT
Th e starting point for theories that fi nd an explanation for the value of hedging in corporate fi nancing is that if a fi rm lacks internal funds, it must make use of an external funding source, which is, in contrast to the Miller-Modigliani theorem (1958), expensive or not even possible at all. Funding-related costs can be either direct (administrative) costs or agency costs arising from information asymme- try (Myers, 1984, Tirole, 2006). Hedging decreases corporate cash fl ow dispersion, and as a result, the probability of fi nancial distress is also reduced. Th e costs of fi nancial distress can appear in the form of transaction costs, while higher ex- pected bankruptcy costs can cause a direct decrease in the fi rm’s value (Smith and Stulz, 1985). Financial distress can result in a fi rm’s partial or complete inability to realize its positive net present value investments, which likewise reduces the value of the fi rm (Lessard, 1990, Froot et al, 1993).
Two basic models explaining the value of corporate hedging from the point of view of limited fi nancing resources are the models of Froot et al (1993) and Tirole (2006). Both models assume a risk-free corporate utility function (linear in profi t) and costly external fi nancing. Th e cost function is given exogenously in the model of Froot et al, but in the Tirole model it derives from agency-based considerations, as the provider of the external fi nancing requires a certain level of own funds from the investor, in the absence of which it does not take the risk of fi nancing even for a credit spread.
Both models conclude that the costs or even the unavailability of external fi nanc- ing justify the rationale of hedging, as through hedging a certain level of internal fi nancing resources can be ensured to implement the investments with positive net present value.
In both models, corporate production and hedging is described as a two-period decision, where hedging itself is made for a single period, so a hedging decision has to consider exclusively the production and price distribution at maturity. As there are no interim periods in hedging, the hedging position creates no cash- fl ow and hence no further risk.
In practice hedging positions need fi nancing for several reasons: upfront fees have to be paid for derivatives with an asymmetric payout function (such as options);
or there is a mismatch of the hedging position with the underlying risk (basis risk); or the daily mark-to-market settlement of futures4 has cash-fl ow conse- quences. In the case of exchange trading, a certain amount of initial margin is required and also a minimal level – the so-called maintenance margin – has to be ensured during the entire lifetime of the transaction. Although profi t or loss on derivatives on the over-the-counter (OTC) market does not need to be settled on a daily basis, in practice in most cases the partners require some initial or interim collateral to reduce the counterparty risk (Korn, 2003). Th e new European Market Infrastructure Regulation (EMIR, 2012) prescribes central clearing for even OTC transactions above a certain level, in order to reduce counterparty risk and so the vulnerability of the fi nancial system.
Contracts of the ISDA (International Swaps and Derivatives Association), which provides the legal framework of derivatives trading, are essentially credit contracts, their annexes also containing credit risk-mitigating elements such as collateral ob- ligations or covenants. As a consequence of the crisis, these documents were supple- mented by the Credit Support Annex (CSA), which contains mutual collateraliza- tion obligations even in the case of the largest and supposedly safest counterparties or banks. Furthermore, even if a fi rm has no fi nancing obligation connected to its derivative transactions, the non-realized loss of the position increases the expo- sure of the bank toward the fi rm and restricts the availability of further fi nanc- ing. Consequently not only exchange-traded derivatives, but also OTC positions are path-dependent, their profi t depending on price evolution during the term.
As a consequence of all this, the availability of fi nancing is critical for a hedging position as well. Th e maturity of derivatives used for hedging can oft en be meas- ured in years, and their fi nancing needs aff ect a fi rm’s fi nancing opportunities.
Although the analysis of Froot et al. (1993) mentions the trade-off between the variability of future cash-fl ow and the fl uctuation of cash in the interim period if the hedging position is to be fi nanced, they do not analyse this problem further.
Th e issue of fi nancing needs for hedging positions appears in the analysis of Anderson and Danthine (1983). In their multi-period model, hedging occurs on several dates and the mark-to-market value of the hedging position (futures) is
4 Th e diff erences in trading and hedging of forwards and futures are detailed in Berlinger et al (2005).
settled in each interim period. Nevertheless the model does not include any fi - nancing constraint or credit spread, so that cash-fl ow can be converted simply to the date of maturity at the risk-free rate.
Th e liquidity risk of the hedging position appears in theoretical models in the 2000s. Mello and Parsons (2000) investigate optimal hedging strategies by con- sidering liquidity aspects, concluding that fi nancial constraints lead to the sub- optimality of both cash-fl ow variance-minimizing and corporate value variance- minimizing hedging strategies. Optimal hedging minimizes the variance in the marginal value of corporate cash; it switches cash to the outcomes where the mar- ginal utility is the highest.
In the models detailed in this paper, the optimisation criterion is not the maxi- mization of the expected profi t, but the maximization of the (concave) corporate utility function. Liquidity risk appears in two forms: fi rstly, through the model- ling of the margin account, providing that the fi rm has no or only a limited source of fi nancing in case of a margin call (Deep, 2002). Th e unavailability of fi nancing derives from the fact that internal resources are too expensive to hold for this purpose while external investors are not willing to provide fi nancing or require a spread because of information asymmetry, as it cannot be ascertained from out- side whether the losses on derivative positions are caused by prudent hedging or irresponsible speculation.
Th e other way of modelling liquidity risk is based on the fi nancing costs deriving from the credit spread to be paid to collateralize the loss of the position (Korn, 2003).
3. HEDGING IN CASE OF LIMITED MARGIN AVAILABILITY – DEEP MODEL
Th e risk investigated by Deep (2002) can be perfectly eliminated by futures hedg- ing. Th e future corporate output (π) is given; the risk derives from the uncer- tainty of the future price of the product. Th e price is assumed to follow geometric Brownian motion with a drift equal to the risk-free rate.
, (1)
where St is the spot price in time t, r stands for the risk-free interest rate, σ is the volatility of the price change and dwt – the change in the Wiener process – de- notes the stochastic part of the price movement.
As the expected growth of the price is the risk-free rate, the evolution of the for- ward rate – using Itō’s lemma – is a martingale process.5
5 Th e drift of the forward rate process is the diff erence between the drift of the underlying asset and the risk-free rate, which is zero in our case.
t t t
t rS dt Sdw
dS
. (2) With this simplifi cation, the speculative motive of the hedge can be eliminated and the profi t or loss of the hedging position has no impact on the optimal hedging.6 Th e fi rm hedges its exposure with short futures, where the hedged amount (θt) can be adjusted on any interim date. Th e value of the hedge (futures) position is settled on the margin account (Xt) on each interim date, so the value of the mar- gin is also stochastic:
. (3)
Th e fi rm has a certain amount of cash (X0) to use as a margin in order to open the hedging position, but it cannot get further fi nancing if the margin account drops below a minimal (K) level that has to be maintained and the fi rm receives a margin call. Th e inability to meet the margin obligation leads to liquidation of the position, and so the original exposure becomes unhedged. Although the model assumes the unavailability of fi nancing, a credit line can be built into the model by adjusting the values of K and the initial margin of X0.
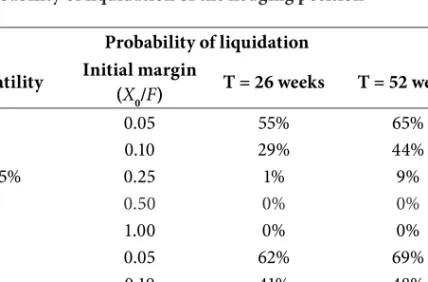
Table 1 shows the probability of liquidation of the hedging position for diff erent maturities, initial margin amounts and price volatility. Th e price follows the geo- metric Brownian motion described in Equation (1).
Table 1
Th e probability of liquidation of the hedging position Probability of liquidation Volatility Initial margin
(X0/F) T = 26 weeks T = 52 weeks
0.05 55% 65%
0.10 29% 44%
15% 0.25 1% 9%
0.50 0% 0%
1.00 0% 0%
0.05 62% 69%
0.10 41% 48%
20% 0.25 8% 13%
0.50 0% 1%
1.00 0% 0%
Source: own calculation based on Deep (2002)
6 Th e expected return of a derivative position is analysed in Berlinger (1998).
t t
t Fdw
dF
t t t
t rX dt dF
dX
Th e above results are based on a Monte Carlo simulation by running 1,000 re- alizations. In the case of an initial margin requirement of 10%, the probability of liquidation of a 1-year position within term is 44%. As the initial margin is in reality below 10%, the hedging fi rm has to calculate a future fi nancing need that has to be managed without fi nancial distress.
Th e goal of corporate management is to maximize the expected utility of corpo- rate value – the sum of the production and the margin account – at maturity. As- suming constant relative risk aversion (CRRA)7 in the corporate utility function, the optimal hedge maximizes the following equation:
8 , (4)
subject to Xt ≥ K.
Deep solves the optimisation with the help of stochastic dynamic programming.
Th e optimal hedging problem is a stochastic control problem that has only a nu- merical solution because of the non-linearity of the partial diff erential equation to be solved.
Factors infl uencing the optimal hedging strategy are: corporate exposure, ma- turity of the hedge, volatility of the risk factor, available fi nancial resources and corporate risk attitude.
When deciding about hedging, corporations have to choose between two types of risk: the lesser the uncertainty over the future price of production (value risk), the greater the risk of liquidation of the position within term (cash-fl ow or liquid- ity risk). Th e latter risk, i.e. the probability of falling beneath the minimum level of the margin account, clearly diminishes as the time to maturity decreases, and grows as the volatility of the price increases. It can also be seen intuitively that a higher margin account balance means less constrained liquidity.
Chart 1 shows the eff ect of available fi nancing sources and the time to maturity, assuming the risk factor follows geometric Brownian motion with annual volatil- ity of 15% and a drift rate equalling the risk-free rate (5%), while the level of corpo- rate risk aversion (1–γ) is 0.5.
7 Th is means that the attitude toward risking a certain ratio of assets is constant. Th e measures of investors’ risk preferences are formalized in the works of ARROW (1970) and PRATT (1964).
8 Here γ denotes not the measure of risk aversion, but (1 minus risk aversion). As DEEP uses a risk aversion of 0.5, the two values are equal.
)
max t t (XT FT ; 0 < γ < 1
Chart 1
Optimal hedge ratio as a function of initial margin and maturity
Source: Deep (2002), Chart 5.1
Th e optimal hedge ratio is thus a negative function of the time to maturity, and a positive function of the available fi nancing resources. Th e corporate risk aversion is in inverse proportion to the level of fi nancing resources. Higher risk aversion has a similar eff ect as higher liquidity constraints; namely, both reduce the opti- mal hedge ratio, since the utility reduction deriving from the termination of the hedge is larger.
Deep’s model explains underhedging as a fi nancing decision. Th is model of opti- mal hedging leads to the conclusion that fi nancial diffi culties in maintaining the position result in the reduction of the corporate hedge ratio of the predetermined output.
4. FINANCING COST OF THE HEDGE POSITION – KORN MODEL Th e liquidity risk of the hedging transaction is due in the model of Korn (2003) not to the potential liquidation of the position, but to the extra cost of fi nancing.
Th e model assumes that the fi rm is able to secure fi nancing on the market, albeit at a cost since it cannot obtain such fi nancing at the risk-free interest level (r). Th e higher the corporate-specifi c credit spread (s), the higher the cost of fi nancing and hence the liquidity risk of hedging. Although the model contains a constant credit spread, it can be extended with a need-dependent credit spread, while unavailable fi nancing can also be simulated by increasing the spread to infi nity.
Hedge- ratio
Initial margin (X0/F) Time to maturity (weeks)
In Korn’s basic model, the fi rm decides about the quantity of production (Q) that will be realized in 2 periods. Th e selling price of the output (P) is stochastic, gen- erating the risk to be hedged. Forward agreements are used for the hedge, with the evolution of the forward rate presumed to be a martingale (as in the previous model). Th e fi rm can conclude hedging deals at both dates, initially and also in the interim period.
Chart 2 depicts the process, with indices representing time.
Chart 2
Th e process of corporate operation in the model of Korn
0 1. 2.
Source: own design, based on Korn (2003)
Th e corporate profi t realized at the end of the second period (Π) consists of three parts: the operating profi t, the profi t or loss of hedging positions, and the cost of collateral of the hedging deal.
(5)
Th e parameters of the equation are defi ned above.
Th e optimal hedging strategy, maximizing expected utility (E[U(Π)]), is to be de- termined in two steps retrogressively.
In order to calculate the amount to be hedged at the fi rst (interim) date (h1), equa- tion (5) is to be maximized at the already known levels of Q, F1 and h0:
. (6)
;0
1 ) min (
) ( ) ( )
( 0 0 2 1 1 2 0 0 1
2 r
F h F
s P F h P F h Q c Q P
Operating
profi t P/L of the hedge Cost of the hedge
] , , ) ( [
maxh1E1U F1 Q h0 Decision about production (Q) Hedging quantity (h0)
Hedging price (F0)
Sales of output (P2)
P/L of hedge (F0 – F1) New hedging (h1) New hedging price (F1)
Th e prime condition ensuring the existence of the maximum, as the utility func- tion is concave:
. (7)
As the expected value of the forward rate at maturity is presumed to equal the forward rate at time 1, (E1(F2)=F1), the equation is held if the covariance of the two terms of the product is zero, namely the profi t function is independent of F2. Accordingly, the optimal hedging amount at time 1 is:
h1* = Q – h0. (8)
At the fi rst date the entire output is to be hedged, irrespective of the corporate fi nancing cost (s), as no further collateral obligation will arise. At time zero, sub- stituting equation (8), the profi t function is the following:
. (9)
In the absence of fi nancing costs (s=0), the expected utility can be maximized, if:
. (10)
Similarly to the above-presented hedging at time 1, the independency of the profi t function from the forward rate (F1) can be ensured by hedging the entire produc- tion, so:
h0*=Q* and h1*= 0. (11)
In Korn’s model the production quantity is also an endogenous variable that can be determined through equation (9) and the corporate utility function:
, (12)
which holds if:
. (13)
In the optimum the covariance term is zero, if equation (11) holds, so the optimal output is at the level where the marginal cost of production equals the initial forward price (F0). Th is result suggests a perfect fi nancial hedge, similarly to the model of Froot et al.
If fi nancing is costly (s > 0), hedging increases value by reducing the uncertainty of corporate profi t, but on the other hand it also has a cost that aff ects the ex- pected profi t negatively. Consequently, the optimal output will be less than in the cost-free case and the optimal hedging ratio is below 1. Korn proves that a hedge ratio less than zero – that is, an exposure in the same direction as the original risk – cannot be optimal due to the costs of any derivative position. Th e optimal hedge ratio can be calculated in knowledge of the corporate utility function and the evolution of the forward price. Th e analysed model assumes the forward rate
0 )]
)(
( '
[ 1 2
1U F F
E
;0
1 ) min (
) ( ) (
* 1 0 0 1 0 0 1
r F h F
s F F h Q c Q F
0 )]
*)(
( '
[ 0 1
0 U F F
E
0 ))]
( '
*)(
( '
[ 1
0U F c Q
E
0 ]
*), ( ' [ cov )) ( '
*)](
( '
[ 0 0 1
0 U F c Q U F
E
0
is lognormally distributed and the utility function refl ects constant relative risk aversion (CRRA). Based on these assumptions, Korn indirectly proves the follow- ing limits of the optimal hedge ratio9:
, (14)
where c stands for the average cost of a unit produced.
In order to calculate the optimal hedge ratio, Korn adopts the same parameters as Deep: a risk-free interest rate of 5% and volatility of the forward price (σ) of 15%.
Th e cost function is not defi ned, the average cost is 0.1, and both periods of the model are 1 year.
Th e optimal hedge ratio is given by maximizing the expected value of the utility (15).
, (15)
where:
U: utility
∏*: profi t in case of optimal hedging γ: risk aversion.
Solving the optimisation numerically with the above parameters, Chart 3 shows the optimal hedge ratio as a function of the corporate credit spread (s) and risk aversion (γ)10.
Chart 3
Optimal hedging in Korn’s model
Source: own simulation, with antithetic variates based on Korn (2003)
9 If the hedge ratio falls outside these limits, a loss (negative profi t) occurs with positive probability, which cannot be optimal for a risk-averse company.
10 Risk aversion is zero in the case of risk neutrality, while the upper extreme value of 2 is the indi- vidual risk aversion determined by Blume and Friend (1975).
0
*
0/ * /
1
1 h Q c F
s r
r
1
*) ( (1 ) U
Hedging ratio
Credit spread (s)
As Chart 3 illustrates, a perfect hedge is optimal if the fi rm secures fi nancing at the risk-free interest rate. A one percentage-point increase in the credit spread leads to a fi ve percentage-point reduction in the optimal hedge ratio in case of a corporate risk aversion of 0.5 (γ = 0.5).
As the risk aversion decreases (decreasing γ), the optimal hedge ratio also declines, since the utility of the hedge off setting the interest cost of the hedge is lower.
Th e costs of production impact the hedging policy signifi cantly. Th e ratio of the average cost of production to the forward price represents the lower limit of the optimal hedge ratio, as this level of hedge ensures that the revenue at least covers the costs of operation.11
Th e increase in average cost raises the minimal level of the hedge ratio, since profi t will be lower and the slope of the utility function is higher with smaller val- ues (the fi rm is more sensitive to negative outcomes), so that the utility achieved by the hedge is also higher. However, it is important to note that the above rela- tionship refers to the hedge ratio, while the optimal level of output – and hence the amount of the hedge – can substantially decrease in the presence of fi nancing costs.
Th e volatility (standard deviation) of the risk factor has a dual eff ect on the opti- mal hedge. On the one hand, the higher the volatility of the forward rate (higher risk), the greater the optimal hedge ratio of a risk-averse fi rm. On the other hand, higher volatility also increases the expected value of the fi nancing costs of the hedge, which has a negative eff ect on the optimal hedging level. Th e result of these two contradictory eff ects is not obvious. In the case of the parameter set exam- ined by Korn (r=5%, γ=0.5, average cost=10%, F0=1, F lognormal with a mean of 1, and three diff erent values of volatility: σ=0.1; 0.15; 0.2), increasing volatility causes a rise in the optimal hedge ratio.
Th e question arises of how the optimal hedging strategy evolves if options trans- actions are also available, as bought options do not induce a fi nancing need dur- ing their lifetime. However, the upfront fee on options makes this strategy too expensive and hence suboptimal for a fi nancially constrained fi rm.
5. COMPARISION OF LIQUIDITY-ADJUSTED HEDGING MODELS Th e two models detailed above describe the funding liquidity risk deriving from the fi nancing need of the hedge position in diff erent ways, and their conclusions also partially diff er.
11 Assuming the initial forward price exceeds the average cost; otherwise it is not worth investing in the project.
Th e selling price of production (P) is a risk factor in both models, and therefore corporate revenue and profi t are also stochastic. Th e product is traded on the market and can be sold by (short) forward or (short) futures agreements at any time, in any quantity, at the prevailing market price (Ft). Another aspect common to the two models is that the spot and forward rates of the underlying asset follow geometric Brownian motion and the drift of the spot price equals the risk-free rate of return, consequently the progress of the forward rate is a martingale. Th is assumption simplifi es the calculations, as the expected value of the hedge posi- tion is zero, so that forward or futures sales have no speculative motive. Both models investigate optimal hedging based on a corporate utility function that refl ects constant relative risk aversion (CRRA).
Th e main diff erence between the models is in the hedging position. Deep uses futures for the hedge, the value of which is settled on a daily basis on the margin account, so that the liquidity risk derives from the fi nancing limits in case of a margin call. In the Korn model, hedging occurs through forward agreements that have to be collateralized (in cash) in case of a loss at a single interim date during the term. Th e liquidity risk appears in the form of the credit spread of the loan taken out to meet the collateral obligation.
Th e model of Deep does not include production costs; optimization is based on profi t that is the sum of operating income (price of the output at maturity) and fi nancial income (value of the margin account). Th e produced quantity is an ex- ogenous variable of the model; while in the Korn model production costs aff ect both optimal output and the minimal hedging ratio.
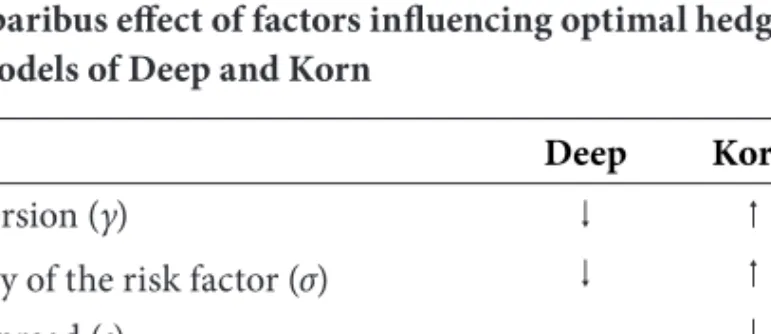
Table 2 summarizes the ceteris paribus impact of the parameters infl uencing the optimal hedge ratio, which can diff er in the two models, using the parameter values specifi ed above.
Table 2
Ceteris paribus eff ect of factors infl uencing optimal hedging in the models of Deep and Korn
Deep Korn
Risk aversion (γ)
Volatility of the risk factor (σ)
Credit spread (s) --
Financing resource (X) --
Hedging period (t)
Production costs (c(Q)) --
Source: own design, based on Deep (2002) and Korn (2003)
Increasing risk aversion leads to a decreasing optimal hedge ratio in the model of Deep, as the risk of liquidation of the hedge can be lowered by a smaller derivative exposure. However, in the Korn model, a higher risk aversion leads to higher util- ity achieved by the hedge; consequently, in spite of the enhanced fi nancing costs, the optimal hedge ratio will be higher.
Th e volatility of the risk factor aff ects both the potential loss from the underlying exposure and the costs of the hedge. Th ese contrary eff ects have diff erent result in the two models: in Deep’s model, the latter is more signifi cant, so that increas- ing volatility leads to a lower optimal hedge ratio, while in the Korn model the enhanced utility of the hedge exceeds the costs, so that the optimal hedge ratio increases in tandem with volatility.
Th e parameters of liquidity risk have the same eff ect in both models: a higher credit spread or lower margin amount results in the reduction of the optimal hedge ratio.
Th e time to maturity has an impact similar to that of volatility, increasing the risk of liquidation of the hedge position. It therefore lowers the optimal hedge ratio in the model of Deep, while in Korn’s model the enhanced utility of the hedge due to volatility increases the level of the optimal hedge. Longer maturity means a longer hedging period, but the fi nancing need appears only at a single date in the Korn model.
6. SUMMARY
As a consequence of the crisis, regulations and the risk management of fi nan- cial institutions increasingly focus on monitoring and controlling counterparty risk. Th e daily settlement of derivative positions is being introduced even on OTC markets, so that such positions are exposed to liquidity risk. Consequently risk managers have to consider the fi nancing need of hedging derivatives in their hedging decisions, which may explain the wide range of derivative instruments off ered and the common practise of overhedging and underhedging.
Th e present article presents and compares two theories incorporating the fi nanc- ing need of hedging. Th e optimal hedge ratio – which is the ratio of the hedging position to the exposure – is determined in both models by the trade-off between the increased utility arising from volatility reduction and the costs of fi nancing of the hedge. However, the approaches to modelling liquidity risk are fundamentally diff erent, so that the conclusions and the impact of certain infl uencing param- eters are partly contradictory.
REFERENCES
Anderson, R. W. – Danthine, J. (1983): Th e Time Pattern of Hedging and the Volatility of Futures Prices. Th e Review of Economic Studies 50 (2), pp. 249–266. DOI: http://dx.doi.org/10.2307/2297415.
Arrow, K. J. (1974): Th e Th eory of Risk Aversion. In: Essays in the Th eory of Risk-Bearing. Amster- dam: North-Holland Publishing Company.
Berlinger, E. – Jáki, E. – Walter, Gy. (2005): Határidős ügyletek (Forward transactions: exam study material). Budapest: Közép-Európai Brókerképző Alapítvány (Foundation for Central Eu- ropean Training Centre for Brokers).
Berlinger, E. (1998): Th e Expected Yield on Derivatives Products. In: Bácskai, T., Király, J., Mar- moly, J., Májer, B., Sulyok-Pap, M. (eds.): On Banks, Money and Stock Exchanges: Selected Lectures at the Institute for Training and Consulting in Banking, 1988–1998. Budapest: Institute for Training and Consulting in Banking Ltd., pp. 314–337.
Blume, M. – Friend, I. (1975): Th e Asset Structure of Individual Portfolios and Some Implica- tions for Utility Functions. Th e Journal of Finance 30 (2), pp. 585–603. DOI: http://dx.doi.
org/10.2307/2978737.
Deep, A. (2002): Optimal Dynamic Hedging Using Futures under a Borrowing Constraint. Working Paper, Basel: Bank for International Settlements. DOI: http://dx.doi.org/10.2139/ssrn.846326 Dömötör, B. (2014): Market Risk Hedging under Liquidity Constraints. PhD dissertation, Doctoral
School of Business Administration, Corvinus University of Budapest.
European Market Infrastructure Regulation (2012): Regulation (EU) No. 648/2012 of the European Parliament and of the Council of 4 July 2012 on OTC derivatives, central counterparties and trade repositories. http://eur-lex.europa.eu/legal-content/EN/TXT/?uri=CELEX:32012R0648.
Froot, K. A. – Scharfstein, D. S. – Stein, J. C. (1993): Risk Management: Coordinating Corporate Investment and Financing Policies. Th e Journal of Finance 48 (5), pp. 1629–1658. DOI: http://
dx.doi.org/10.1111/j.1540-6261.1993.tb05123.x.
Hommel, U. (2005): Value-Based Motives for Corporate Risk Management. In: Risk Management, Chapter 3, Berlin Heidelberg: Springer, pp. 455–478. DOI: http://dx.doi.org/10.1007/3-540-26993- 2_23.
Korn, O. (2003): Liquidity Risk and Hedging Decisions. Working Paper, Mannheim: University of Mannheim. DOI: http://dx.doi.org/10.2139/ssrn.424362.
Lessard, D. (1990): Global Competition and Corporate Finance in the 1990s. Journal of Applied Cor- porate Finance 3 (4), pp. 59–72. DOI: http://dx.doi.org/10.1111/j.1745-6622.1991.tb00564.x.
Mello, A. S. – Parsons, J. E. (2000): Hedging and Liquidity. Th e Review of Financial Studies 13 (1), pp. 127–153. DOI: http://dx.doi.org/10.1093/rfs/13.1.127.
Miller, H. M. – Modigliani, F. (1958): Th e Cost of Capital, Corporation Finance and the Th eory of Investment. Th e American Economic Review 48 (3), pp. 261–297.
Myers, S. C. (1984): Th e Capital Structure Puzzle. Th e Journal of Finance 39 (3), pp. 575–592. DOI:
http://dx.doi.org/10.3386/w1393.
Pratt, J. W. (1964): Risk Aversion in the Small and in the Large. Econometrica 32 (1-2), pp. 122–136.
DOI: http://dx.doi.org/10.2307/1913738.
Smith, C. W. – Stulz, R. (1985): Th e Determinants of Firms’ Hedging Policies. Th e Journal of Finan- cial and Quantitative Analysis 20 (4), pp. 391–405. DOI: http://dx.doi.org/10.2307/2330757. Tirole, J. (2006): Th e Th eory of Corporate Finance. Princeton and Oxford: Princeton University
Press.
Walter, Gy. (2014): Corporate Risk Management. In: Walter, Gy. (ed.): Corporate Financing in Practice: Opportunities and Decisions on the Hungarian Market. Budapest: Alinea, pp. 225–238.