El-Meouch, Nedim Márton
1– Tésits, Róbert
2– Alpek, B. Levente
3Measuring Spatial Distribution in the Banking System in Hungary 4
ABSTRACT
Over the past decade, due in part to the global economic crisis, a significant part of the bank branches have been closed in the European banking system, but in Hungary this proportion has been significantly higher than the European average. Therefore, the aim of the present study is to explore what aspects of commercial banks are taken into account when deciding where to be present within bank branches.
This will also reveal the spatial dimension of public access to financial services. The present study seeks to answer the question of which socio-economic factors and in what form they affect the spatial structure of bank branches. The settlement-level examination can also provide additional indication of which settlements may be affected by further bank branch closures. Linear regression based on Ordinary Least Squares (OLS) parameter estimation was used to explore the factors influencing the location of bank branches. In addition, the possible clustering of bank branches was observed, i.e., whether spatial autocorrelation was present at certain stages of the analysis. Geographically Weighted Regression (GWR) was also estimated in the present study. Based on the results of the research, the resident population, the proportion of enterprises per capita, the average income, the number of neighbouring bank branches and the type of settlement all proved to be significant factors that may encourage decision-makers to establish a bank branch.
Keywords: bank branches, location, spatial, autocorrelation, Hungary
1 PhD student, University of Pécs, Doctoral School of Earth Sciences, Faculty of Sciences, 7624 Pécs, Ifjúság útja 6. Phone:
+36-30-272-6516. Email: nedu02@gmail.com https://orcid.org/0000-0002-2861-1036
2 Associate Professor, University of Pécs, Faculty of Sciences, Institute of Geography and Earth Sciences, Dept. of Human Geography and Urban Studies, 7624 Pécs, Ifjúság útja 6., Phone: +36-20-336-7611, Email: tesits.robert@gmail.com https://orcid.
org/0000-0002-9575-3309
3 Assistant professor, University of Pécs, Faculty of Sciences, Institute of Geography and Earth Sciences, Dept. of Human Geogra- phy and Urban Studies, 7624 Pécs, Ifjúság útja 6., Phone: +36-30-872-0003, Email: alpeklevente@gamma.ttk.pte.hu https://orcid.
org/0000-0001-9637-3693
4 Prepared with the professional support of the Doctoral Student Scholarship Program of the Co-operative Doctoral Program of the
INTRODUCTION
Bank branches have been one of the most important factors in the implementation of banks’ core activities since the appearance of commercial banks, as from the beginning banks have come into direct contact with the public and businesses through these institutions most of the times. Although the digital revolution of recent decades has significantly changed the way we think about the role of bank branches, and they now seem somewhat less of a major tool for market acquisition than they did many decades ago, they continue to play an important role in banking, especially concerning one of its most fundamental tasks, lending. The current relevance of the issue of the bank branches’ role is also confirmed by the trend of branch closures happening since the 2008/2009 economic crisis, with 28 per cent5 of bank branches in the European banking system closed by 2018 since the peak of 2008, according to the ECB (2020). In the case of Hungary, this ratio exceeds the European average, its rate of 36 percent between 2008 and 2018 is the 12th largest bank closure rate in the European Union.
In the process of closing EU and Hungarian bank branches, which, in addition to digitalisation, is also driven by the pursuit of efficiency, it may be important to take a snapshot and examine what aspects – and with how much weight – commercial banks take into account when deciding where to be present with bank branches. In addition to a better understanding of the operation of banks, the analysis of this issue is also important from the point of view that one of the dimensions of the Hungarian population’s access to financial services can be revealed through it. Based on all this, the study seeks to answer the question of which socio-economic factors – and in what form – affect the spatial distribution and the spatial structure of bank branches in Hungary. In the course of the settlement-level examination, we can get an idea of the characteristics that are most responsible for the presence of bank branch(es) or the lack of which are the main determinants of the lack of branches, which may even provide additional indications on which other settlements can be affected by branch closures.
THEORETICAL BACKGROUND
The impact of not only financial institutions (Eszes, 2020) but also the settlement network on various services has been examined by several articles in this journal (Eördöghné Miklós, 2014; Tánczos- Szabó, 2021; Szalai & Fabula, 2021; Lempek & Tésits, 2021). The segment of the literature on the location of bank branches most closely related to the present research is divided into three major groups: 1) articles concerning the development of decision-supporting software, 2) studies examining the location of bank branches in a general, theoretical way or studies identifying behavioural patterns related to bank locations, and 3) empirical research, which examines the location of bank branches, and the reasons of bank branch openings and closures. In the case of the research belonging to the first group, we can get to know the decisive variables used to decide on opening or closing a bank branch,
5 Due to their exit from the EU, UK bank branch data are not considered. Together with the United Kingdom, and including its latest available data from 2014, the rate of bank branch closures in the European Union is similar at 27 per cent.
so we can get a closer picture on what factors may play a role in making these decisions in practice.
It is then assumed that the locations of bank branches are decided at least partly by considering such or similar software and the characteristics implemented in them. The second group can help to better understand the economic logic of banks’ site selection by learning about the general theories and the presented behavioural patterns, thus giving a broader view of the topic and its regularities. The aims of the studies in the third group are the closest to the present research, as they examine the factors influencing the location of bank branches or bank branch expansion in a given area (typically in a country) for a given period.
Regarding the first group of articles written for decision-making models, the variables used in the models were the most relevant for the research, so in their description, the study focuses on the presen- tation of these variables. In his study, Willer (1990) examines the characteristics of an optimal bank location within a city, for which it uses the American Banking Association’s “A Guide to Selecting Banking Locations” (1968) as a starting point, which highlights socio-economic and demographic characteristics of consumers, competition in the banking market and consumer habits as significant influencing factors. In his article, Cinar (2009) compares 6 cities in Turkey using his decision-suppor- ting software and then selects the optimal location. It organizes the factors used for the decision into five main groups: demographic, socio-economic, sectoral employment, banking and trade potential groups, and then divides them into sub-factors. Cabello (2019), as well as Allahi and Vafadarnikjoo (2015) offer suitable locations for opening a bank branch, their decision factors also include social, demographic and banking competition indicators, additionally they emphasize the market potential of the area and the development of the infrastructure. Another important source was the work of Zhao et al. (Zhao & Garner, 2001; Zhao et al., 2004; Zhao, 2002), which modelled branch closures based on the example of Sidney in Australia. In these studies, profitability is approximated both by macro- and micro-based variables, of which macro variables are interesting for settlement-level research that captures the resident population, its growth rate, age composition, income and employment status of residents, number of enterprises, and banking competition. The assumption that commercial banks may use decision-supporting models detailed above or similar to them for their decisions on bank branches is well supported by the article by Hopmans (1986), which presents a system for building a banking network developed by Rabobank in the Netherlands.
In the second group of literature articles examining general theories and patterns of behaviour, studies analysing the clustering of bank branches play a significant role. According to the study by Chang et al. (1997), in addition to the basic clustering of demand for banking services, the phenomenon is partly explained by “rational herding”, that is, independently whether it can lead to sub-optimal results, it can be rational for individual actors to copy the behaviour of other actors, in this case to open a bank branch where other banks already have one. The reason for this, in their view, may be that information from bank branches operating in a given location dominates information from other sources, or that decision-makers try to protect their own position by choosing less risky locations that have proven themselves to be profitable for other banks. Qi et al. (2018) trace clustering back to information sharing and its quality. They come to the conclusion that with the increase of the level of information sharing (they typically mean the introduction and development of the credit information
system by that) the grouping of bank branches increases, because although banks open branches even in places where they do not yet have one, these are typically locations where other banks already have a branch. These studies draw attention to the spatial autocorrelation of the location of bank branches, while also looking for its reasons, the examination of which is also included in the present analysis.
Mahajan et al. (1985) evaluate the location of bank branches in a theoretical framework, addressing the issue as a product-market problem. They develop a portfolio matrix that characterizes product strength and market attractiveness in its two dimensions. This makes it possible to create indexes for different locations, which can then be an important decision-supporting tool. Similarly, the study of Vance (2000) allows for the development of indices, with the difference that it has the performance of bank branches in its focus which it tries to explain with the help of the Opportunity Index developed from micro factors. Lee and Fukui (2003) examine the strategies of the 5 major commercial banks within Tokyo. In their analysis, consumers are segmented by cluster analysis at the district level based on socio-demographic factors, and then the location of these consumer segments within the city is compared with the bank branch presence. Huang and Yin (2011) show that although the Internet increases the performance of banks, spatial and regional characteristics are still dominant factors reg- arding it, and it is important to take these into account even in the age of the World Wide Web. Burton (1990) points out based on the example of the United Kingdom, that the increase in competition has on the one hand changed the functions of bank branches and their staff composition, and on the other hand brought the issue of bank branch location even more to the forefront.
The third group is comparable not only in its topic but also in its results to the present research, as it empirically seeks to break down the location of bank branches, in some cases their expansion, into various influencing factors and to determine their direction and significance. Hannan and Hanweck (2008) examine the factors influencing the number of branches in 2,000 US markets based on data from 1988 to 2004 and conclude that in addition to population and per capita income, interest income on interest-bearing assets increases while market concentration decreases the number of branches.
Ansong et al. (2014) examine the factors influencing banking coverage in the case of Kenya, and their results suggest that population, urban population rate, labour force size, and literacy rates best explain the fact that the urbanized southern part of the country is much more banked than the rural northern part areas. Based on the research of Okeahalam (2009) on South Africa, aggregate income signifi- cantly influences the number of bank branches in a given settlement, in addition the study also draws attention to the clustering of bank branches. Gorfu and Mamo (2013) analyse the Ethiopian banking network, and their results suggest that the location of bank branches is significantly influenced by the level of government capital expenditure, the size of the employed population, and the number of companies, vocational schools and university students. Calcagnini et al. (1999), whose analysis can be attributed to the expansion of bank branches experienced in Italy in the 1990s, examine the factors that can be used to explain new branch openings. They find that the existing market structure, own and competitors’ expansion in the past have a significant impact on expansion, that banks are setting up new branches in locations already covered by branches to exploit opportunities, and that pro- vincial-level economic development and dynamics are only weakly linked to new branch openings.
Alamá and Tortosa-Ausina (2012) examine the Spanish bank branch expansion happening between
1989 and 2008 and draw three main conclusions: 1) it is difficult to describe the relationship between the bank branch number and the various explanatory variables with a linear relationship, so a quantile regression is used for analysis, for which the reason is that 2) depending on the type of company (bank, savings cooperative, etc.) and the quantiles of the number of branches, the location and geographical diversification strategies differ, and 3) the territorial expansion has led to the financial exclusion of certain communities. These empirical studies also use a wide range of demographic, socioeconomic, banking market and banking competition data for the analysis, explaining the number of bank bran- ches in a given area with variables taken and created from these topics. Most often, population data, labour market variables, income data, urbanization level variables, and – for bank branch expansion studies – banking competition variables are used in the analyses.
The spatial nature of the Hungarian banking system and the location of Hungarian bank branches are comprehensively presented in Gál’s (2005) study, which analyses the changes that have taken place since 1990. He explains that in 1990 the Hungarian banking system was a system operating in a very centralized structure, and in a spatially concentrated and unbalanced form. In the 1990s, this one-sidedness eased, and commercial banks began to expand in western counties too – which were neglected due to industrialization in the socialism –, a direction that later broadened to include the big cities in the east and south. As a result, an increase in the number of bank branches was observed until the writing of that article, and then until the crisis of 2008/2009 (ECB 2020). In addition to the expansion of domestic banks with bank branches, the study also attributes a large role to foreign-ow- ned banks in branch expansion and thus in increasing the coverage of rural areas. Regarding the logic of branch expansion in Hungary, it took place based on urbanization levels, where the primary goal was to reach the larger cities, followed by smaller cities. According to the study, in addition to urbanization levels, income conditions and economic activity can be related to the location of branches. The study of Kovács (2017), which examines the differences between urban and rural areas at different levels of the settlement hierarchy, also deals with the Hungarian branch network, paying special attention to the differences between commercial banks and cooperative credit institutions.
Based on its results, at the higher settlement hierarchy levels, the branches of commercial banks, while at the lower hierarchical levels, the branches of savings cooperative institutions predominate, which stems from their basic operational characteristics. In addition, the article highlights that the closures of previous years will further strengthen the concentration of financial services in district centres, which is already developing due to basic processes, thus increasing the time needed to reach bank branches. Vinkóczi (2018) deals with the location of the branch network of Hungarian financial institutions and its rearrangement over time, within which the integration of savings cooperatives is given greater emphasis. The main finding of the study is that the integration of the saving cooperatives couldn’t create regions or associations of the same or similar extent, meaning that the areas covered by these institutions are significantly different from each other. All of these studies show that the Hungarian credit institution sector is in the midst of a great transformation regarding its’ physical presence providing financial service, thus it is worth examining the characteristics and influencing factors of this topic.
Another study on the Hungarian branch network is the work of Temesvary (2011), which models competition in the Hungarian banking sector, in which the decision on the size of the branch network appears as one of the important factors. She finds that the decision on the size of the branch network is decisive in terms of the lending rates and the deposit rates, larger network results in higher lending rates and lower deposit rates. In addition, the size of competitors’ branch networks also influences banking behaviour, lowers lending rates and increases deposit rates. Furthermore, the size of com- petitors’ branch networks increases, and the size of own branch network reduces the likelihood of opening an own branch. Based on all of this, it can be said that the role of decisions on the location of branches is also decisive in terms of the strategies of Hungarian banks. In his study, Farkas (2019) draws attention to the fact that the financial intermediation system and their financial instruments play a decisive role in the formation of territorial cohesion in Hungary and in the promotion of local economic development by summarizing the relevant results and analysing them. In this context, it highlights the role of the financial instruments in the development policy, as the distribution of EU funds, which aim to help reduce territorial inequalities. The article of Gál (2014) even shows that spatial differences in economic development can be a direct consequence of the access to financial products, i.e. the financial flows to the area, which can be unbalanced, adversely affecting peripheral areas. According to the study, one of the main reasons for the unbalanced financial flows can be the information asymmetry, since the centre does not have the needed information pool concerning local information of the peripheral areas, thus increasing the cost of granting loans to these areas. Taken together, the last two mentioned studies show us the importance of getting financial products to every area in Hungary in economic development in which bank branch coverage plays a decisive role.
METHODS
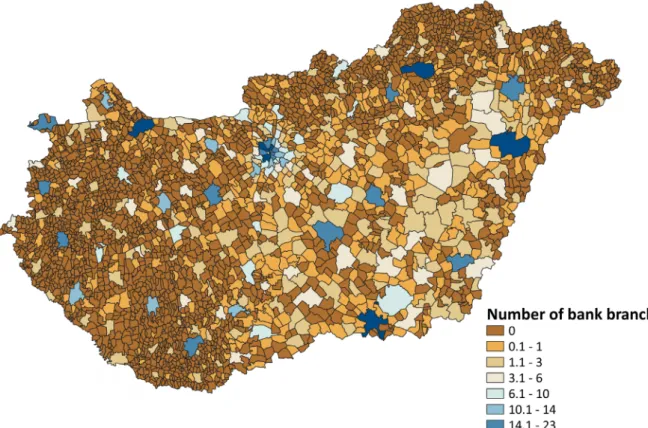
The data on bank branches are based on the National Bank of Hungary’s (MNB) P56 data service called “Data on the location of network units and ATMs handling payment services and the services provided”, within which credit institutions and savings cooperatives must provide detailed infor- mation on their branches and their characteristics. With the help of this, the spatial location of the Hungarian branch network for 31.01.2020 was created. At that time, there were no bank branches in 2,452 of the 3,173 settlements in Hungary, of which, except for 9 cities, they were all villages, regarding their settlement type. It can be clearly seen in Figure 1 that the supply of bank branches in the eastern part of the country is significantly more favourable than in the case of the western settlements, which is partly related to the characteristics of the settlement network in this area. While in the eastern counties the coverage for settlements with bank branches is 33 per cent, in the western counties this proportion is only 14 per cent. At the same time, this phenomenon has partly historical reasons, as before 1990 the eastern industrial cities were in the focus of economic planners, so a larger proportion of bank branches and thus, banking services appeared in the settlements in the eastern part of the country (Gál 2005). This disproportion was only partially offset later by the expansion of the banking system to the western part of the country following its transformation after 1990.
Apart from that, the disproportion can be explained further by the previously mentioned, fragmented settlement structure of the western part of the country. The expansion of the bank branch network lasted until the economic crisis of 2008/2009, but after the crisis the trend was reversed, between December 2008 and January 2020 the number of branches decreased by 45 percent (MNB 2020). In light of this, a reduction in the inequality in east-west coverage can hardly be expected in the future, at most an eastern predominance of further branch closures can make the situation more balanced. In January 2020, in the 721 settlements with bank branches, a total of 1,913 bank branches were located.
43 percent of the branches were in cities, 18 percent in capital districts, 19 percent in villages, and 20 percent in county seats or cities with county status.
Figure 1. Number of bank branches in Hungarian settlements (2020).
Source: Own editing based on MNB data
The development of the branch network in banks’ decision-making process is primarily based on profitability and (size)efficiency aspects. The inclusion of these factors in the analysis is not possible for two reasons: 1) data on profitability or on other revenues and expenses are not available at the branch level; 2) in the case of settlements without a bank branch, profitability data at the branch level are not available for commercial banks either. Accordingly, the profitability of bank branches (and thus indirectly the decision on the existence of branches) should be assessed with other characteristics
of the spatial unit served by the given bank branch, since in the absence of lending and operating data, market potential and competition are likely to play a role in decision-making.6
The procedure chosen in this research is similar to that used in the literature, according to which - in accordance with the settlement-level analysis - the driving forces of the decision on bank branches are captured with the characteristics of the settlements. Accordingly, the research tries to explain the number of bank branches in a given settlement with demographic, economic and labour market variables, which is primarily based on the Hungarian Central Statistical Office’s (HCSO) regional database containing 2017 data in the National Spatial Development and Spatial Planning Information System (TeIR) and the 2011 census data also found in the TeIR.7 The demographic variables in the analysis include resident population, active population rate,8 population density, net demographic rate,9 and the share of foreign nationals. The group of economic variables consists of the share of operating enterprises per capita, the share of joint enterprises, the share of enterprises operating in agriculture and industry and the share of small and medium-sized enterprises (SMEs).10 The share of jobseekers and university graduates to the resident population was included as labour market variables. In addition to the market potential, an important factor in the decision to install or close bank branches is the proportion or prevalence of internet banking, in connection with this the share of internet subscriptions from the regional database is used as a proxy variable.11 Apart from these, the average annual income12 variable describing the economic situation of households was included in the variables, which was based on National Tax and Customs Administration’s (NTCA) 2017 annual personal income data found in the TeIR. Furthermore, the share of foreign companies belonging to a given settlement was determined based on the 2017 NTCA tax returns of the companies performing double-entry bookkeeping. Finally, the functional distance13 and settlement type variables were also included in the analysis. The main statistical indicators of all variables included in the analysis are found in the annex.
Based on the above variables, a linear regression using the Ordinary Least Squares (OLS) parame- ter estimation was used to examine the factors influencing the location of bank branches, in which the number of bank branches was the dependent variable, while the explanatory variables were chosen from the characteristics listed in the previous paragraph during model selection. In addition, however, as it was suggested in the literature review, we paid attention to the possible clustering of bank bran- ches during the analysis, i.e., whether spatial autocorrelation was present at each stage of the analysis.
6 It has to be mentioned that nowadays, the difference between the operation of commercial banking and savings cooperatives and their goals of establishing a branch - which has caused significant differences in previous years - is becoming more and more blurred in Hungarian practice due to the multi-year integration of the latter sector.
7 Variables which are from the 2011 census are the share of foreign nationals and the share of university graduates.
8 The active population rate is the share of the population aged 15-64 within the resident population.
9 The net demographic rate is understood as the ratio of the difference between the sum of immigrations live-births and the sum of emigrations and deaths to the resident population.
10 The last four variables are to be understood in terms of the proportion of operating enterprises.
11 The number of internet subscriptions were available for the settlements, but not for the districts of Budapest, so in the case of the latter, the calculations were performed with data characterizing the whole of Budapest.
12 The NTCA’s personal income data (total income, total number of earners) in the TeIR were available by income bands, so these bands were used to construct the average income variable.
13 Functional distance is the distance between the given bank branch and the bank’s decision centre, measured in kilometres. This measure might be called operational or decision-making distance in other articles, but in this study, we use the functional distance name for this variable.
Spatial autocorrelation is the phenomenon when the distance between individual observations is not independent of the spatial distribution of a given criterion. Thus, for example, we can speak of a positive spatial autocorrelation if the spatial differences are significantly influenced by the neigh- bouring conditions, and the observations closer to each other are more similar to each other (Tóth
& Kincses, 2011). One of the classical tests of spatial autocorrelation is the calculation of Moran’s I statistics, the value of which is given by the following equation (Moran, 1948):
(1.)
where n is the number of observations (settlements), is the value of the analysed variable for obser- vation i, is the unweighted average value of the analysed variable, A is the number of neighbouring relationships, and is 1, if i and j are adjacent, otherwise 0. The Moran’s I indicator can take a value between -1 and 1, positive values indicate positive autocorrelation, negative values indicate negative autocorrelation, and 0 implies no autocorrelation. The closer the positive value is to 1 and the closer the negative value is to (-1), the stronger the degree of spatial autocorrelation is.
For the Moran’s I statistics, which is used to calculate the existence of spatial autocorrelation, the definition of neighbourhood is crucial. There are two possible ways to do this: in the first case a neighbourhood matrix must be compiled and the calculations are made using it, in the second case the observations are assigned to points, then the neighbourhood can be determined by adjacent areas and zones or by the distance between the points, in which case more and more distant observations can be considered with less and less weight (Tóth, 2003). In the present settlement-level research, global Moran’s I statistics are compiled based on neighbourhood, in which the location of settlements is also used. When calculating the statistics, the input neighbour number parameter (n) is of great importance, since the nearest n observations are considered as neighbours and the value of the statistics showing the existence of spatial autocorrelation is calculated based on this. The calculation of the spatial autocorrelation of the number of bank branches was made using the R software package called lctools.14
The relationship between the number of bank branches and the explanatory variables is analysed using linear regression. The linear model equations calculated by OLS parameter estimation takes the following form during the research:
(2.)
where denotes the number of bank branches in settlement i, is the constant, is the vector of the explanatory variables of settlement i, is the vector of the coefficients of the explanatory variables, and is the error term. The main conclusions of the study, the evaluation of the relations between the variables used are mainly based on the results of these modellings. Since excessive correlation between explanatory variables leads to multicollinearity, which can distort the interpretation of the effect of the given explanatory variables, a selection process is carried out before running the model
to filter out over-correlating explanatory variables. The decision as to which of the overly correlated variables should be retained was based on which variable was more significant in the literature.
Excessive correlation was defined as a correlation greater than 0.4 in absolute value.
In the present study, Geographically Weighted Regression (GWR) is also estimated. The reason for running this spatially weighted regression as a robustness test was to get to know the spatial stability and robustness of the effect of the explanatory variables, which was made with the help of the R soft- ware package called spgwr.15 This model also uses an OLS estimator but differs from the basic model in that it multiplies the matrices of the explanatory and outcome variables by weight matrices in the parameter estimation. The degree of weights assigned to each variable depends on the geographical distance between the observation to which that variable belongs and the observation at the centre of the estimation (or a central location outside the observations) (Charlton and Fotheringham 2009).
By implication, the closer an observation is to the observation in focus, the more weight it gets. The geographically weighted regression version of the OLS estimate looks as follows:
(3.)
where the notation embodies a relationship around a u site and is u site-specific (Charlton and Fot- heringham 2009). This means that the weights in the parameter estimator vary depending on which observation site (or non-observation site) is taken as the centre of the estimation. Of course, all of this can only be done if the observations can be placed in space, which is the case in the case of settle- ments. Based on all this, the geographically weighted regression runs the OLS parameter estimation in as many ways as many central locations we want to examine the distance-weighted relationships between the variables around. In the research, this means that in practice, a separate parameter esti- mate is made for each settlement included in the estimation, then the location of the given settlement is the centre of the estimation, i.e. the estimation is made from the point of view of the settlement.
For each regression, a so-called “bandwidth” parameter must be specified as an input parameter, i.e.
the degree of closeness inside which the observations are included in the estimation. The value of this parameter was determined by the optimization procedure provided in the software package, and then the value thus obtained was given as an input parameter for the models.16 In the parameter estimation, the weights assigned to the neighbours were determined by a Bi-Square17 function, which, of course, gives the greater weight to an observation the closer it is to the settlement around which the regression is estimated. As for the methodology of the works described in the literature review, the studies analyzing Hungary typically did not operate with a regression methodology (Gál, 2005; Kovács, 2017;
Vinkóczi, 2018; Farkas, 2019; Gál, 2014), but the results and correlations learned there all significantly helped to prepare the current analysis. Regression modelling was more typical in the case of foreign studies (Ansong et al., 2014; Okealaham, 2009, Hannan & Hanweck, 2008, Alamá & Tortosa-Ausina,
15 https://www.rdocumentation.org/packages/spgwr/versions/0.6-33, downloaded: 2020.05.20.
16 The model groups were also run with other “bandwidth” values, which led to similar results and the same conclusions as in the case described within the study.
17 The function assigned weights to the observations according to the following equation: wij(g) = (1-(d2ij/d2))2, where dij is the distance between the observations and d is the distance outside which the observations are given 0 weights.
2012, Calcagnini et al., 1999, Gorfu & Mamo, 2013), the study of a wide range of methodologies and the consideration of the relevant components appearing there facilitated the preparation of the present study and the clarification of the analytical framework.
RESULTS
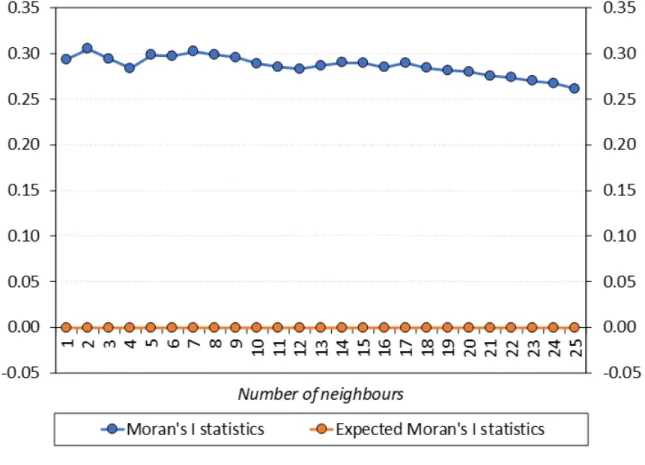
For the first step of the analysis, spatial autocorrelation of bank branches is assessed. As presented in the methodology, it is important to determine the number of neighbours for the Moran’s I statistics.
Accordingly, Moran’s I statistics were run for all neighbour number values between 1 and 25, the results of which are shown in Figure 2. Based on the results, significant spatial autocorrelation can be observed in terms of the number of bank branches, with all neighbouring number values set. Moran’s I statistics range from 0.261 to 0.305, which in each case differs significantly from the expected Moran’s I value of -0.0003. The fact that we get the same result for the spatial autocorrelation tests regardless of the neighbour input parameter remains valid for further tests in the analysis, henceforth the study presents Moran’s I statistics with 5 neighbours selected, which seems intuitive when exami- ning settlement neighbourhood. Thus, the number of bank branches, measured at the settlement level, is spatially autocorrelated, showing a Moran’s I statistic of 0.2981 with 5 neighbouring sets.
Figure 2. Moran’s I test statistics for number of bank branches as a function of the selected neighbouring number (2020).
Source: Own editing based on MNB data
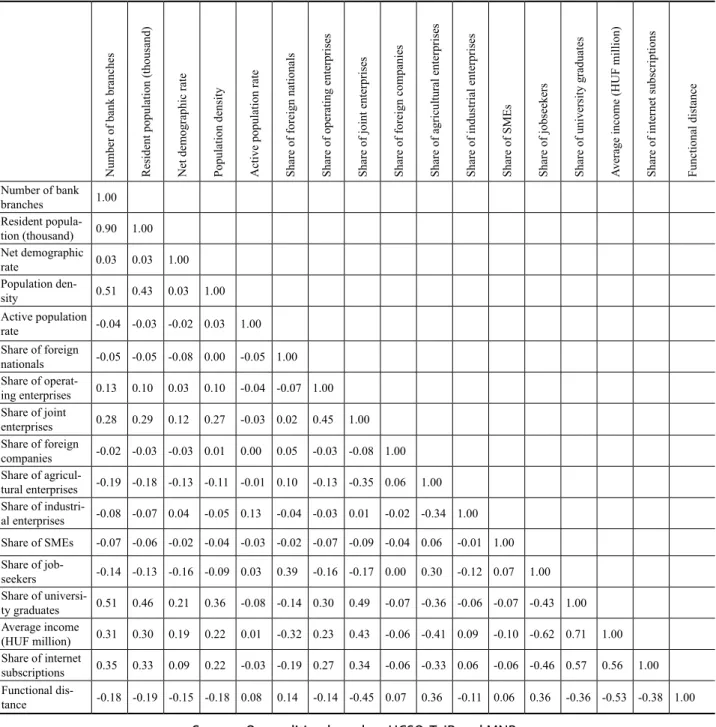
The next step in the analysis is to examine the correlations between the variables (dependent and all possible explanatory variables). The results are shown in Table 1. It can be seen that the residential population is highly positively correlated with the number of bank branches, 0.9 is the value of the correlation between the two variables, in addition the population density and the share of university graduates (0.51 correlations) and the share of internet subscriptions (0.35) and average income (0.31) correlate significantly with the number of bank branches.
Table 1. Correlation matrix of the dependent variable (bank branch number) and possible explanatory variables (2020).
Number of bank branches Resident population (thousand) Net demographic rate Population density Active population rate Share of foreign nationals Share of operating enterprises Share of joint enterprises Share of foreign companies Share of agricultural enterprises Share of industrial enterprises Share of SMEs Share of jobseekers Share of university graduates Average income (HUF million) Share of internet subscriptions Functional distance Number of bank
branches 1.00 Resident popula-
tion (thousand) 0.90 1.00 Net demographic
rate 0.03 0.03 1.00
Population den-
sity 0.51 0.43 0.03 1.00
Active population
rate -0.04 -0.03 -0.02 0.03 1.00 Share of foreign
nationals -0.05 -0.05 -0.08 0.00 -0.05 1.00 Share of operat-
ing enterprises 0.13 0.10 0.03 0.10 -0.04 -0.07 1.00 Share of joint
enterprises 0.28 0.29 0.12 0.27 -0.03 0.02 0.45 1.00 Share of foreign
companies -0.02 -0.03 -0.03 0.01 0.00 0.05 -0.03 -0.08 1.00 Share of agricul-
tural enterprises -0.19 -0.18 -0.13 -0.11 -0.01 0.10 -0.13 -0.35 0.06 1.00 Share of industri-
al enterprises -0.08 -0.07 0.04 -0.05 0.13 -0.04 -0.03 0.01 -0.02 -0.34 1.00 Share of SMEs -0.07 -0.06 -0.02 -0.04 -0.03 -0.02 -0.07 -0.09 -0.04 0.06 -0.01 1.00 Share of job-
seekers -0.14 -0.13 -0.16 -0.09 0.03 0.39 -0.16 -0.17 0.00 0.30 -0.12 0.07 1.00 Share of universi-
ty graduates 0.51 0.46 0.21 0.36 -0.08 -0.14 0.30 0.49 -0.07 -0.36 -0.06 -0.07 -0.43 1.00 Average income
(HUF million) 0.31 0.30 0.19 0.22 0.01 -0.32 0.23 0.43 -0.06 -0.41 0.09 -0.10 -0.62 0.71 1.00 Share of internet
subscriptions 0.35 0.33 0.09 0.22 -0.03 -0.19 0.27 0.34 -0.06 -0.33 0.06 -0.06 -0.46 0.57 0.56 1.00 Functional dis-
tance -0.18 -0.19 -0.15 -0.18 0.08 0.14 -0.14 -0.45 0.07 0.36 -0.11 0.06 0.36 -0.36 -0.53 -0.38 1.00
Source: Own editing based on HCSO, TeIR and MNB.
Note: the settlement type category variable is not included in the table.
To avoid the bias caused by multicollinearity, we filtered the analysis from variables with high cor- relation. Accordingly, prior to the modelling, the resident population, the net demographic rate, the active population rate, the share of foreign nationals, the share of operating enterprises, the share of foreign companies, the share of SMEs and the average income remained among the possible explana- tory variables, which was expanded with the settlement type category variable.
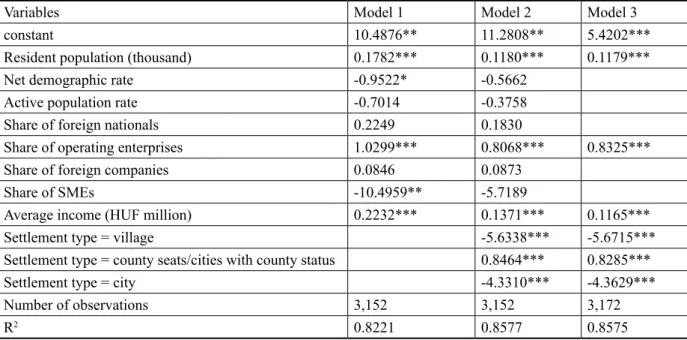
Among the results of the modelling, the results of models containing all explanatory variables without settlement type (model 1), supplemented with settlement type (model 2) and containing only variables significant at the 5 per cent significance level (model 3) are presented in Table 2.
Table 2. Results of model variants explaining the number of bank branches (2020).
Variables Model 1 Model 2 Model 3
constant 10.4876** 11.2808** 5.4202***
Resident population (thousand) 0.1782*** 0.1180*** 0.1179***
Net demographic rate -0.9522* -0.5662
Active population rate -0.7014 -0.3758
Share of foreign nationals 0.2249 0.1830
Share of operating enterprises 1.0299*** 0.8068*** 0.8325***
Share of foreign companies 0.0846 0.0873
Share of SMEs -10.4959** -5.7189
Average income (HUF million) 0.2232*** 0.1371*** 0.1165***
Settlement type = village -5.6338*** -5.6715***
Settlement type = county seats/cities with county status 0.8464*** 0.8285***
Settlement type = city -4.3310*** -4.3629***
Number of observations 3,152 3,152 3,172
R2 0.8221 0.8577 0.8575
Source: Own editing based on HCSO, TeIR and MNB data
Note: The dependent variable for each model is the number of bank branches. The coefficients of the variables are displayed in each cell. Indication of significance levels: p<0,01 ***, p<0,05 **, p<0,1 *
In the model without settlement type, the resident population, the share of operating enterprises, the share of SMEs and the average income were significant variables at 5 per cent significance level.
Based on their coefficients, the share of SMEs has a negative, while the other three variables have a positive effect on the number of bank branches. Presumably, the share of SMEs correlates with the settlement type variable and partly shows its effect in the first model, since as soon as the settlement type was included in the second model, it lost its weight. The variable categories of the settlement type all proved to be significant, compared to the reference category of the capital district, the village or city settlement type in itself significantly reduces, while the county seats/cities with county status settlement type significantly increases the number of bank branches. The resident population, the share of operating enterprises and the average income all retained their significant character in this model variant as well. The signs of the coefficients of the variables with a significant effect correspond to intuition, based on the results the number of bank branches in the given settlement is closely related to the size of the resident population, the share of operating enterprises, the average income and the
settlement type. Most of these results are in line with the results of the literature, in which both the resident population and the average income emerged as key explanatory variables in many articles.
The results of the modelling also show similar results to those described in Gál’s (2005) article pre- senting the Hungarian banking system, as the variables highlighted there all proved to be significant in the present analysis. In the article, income conditions, the level of urbanization and the economic activity appear as the main driving forces in terms of the expansion of the Hungarian branch network, the former two variables seem to be significant influencing factors in the present research too, while the share of operating enterprises is largely related to economic activity, and can be seen as its proxy variable. The explanatory power of the models is very high, the explanatory variables account for the development of the number of bank branches in the range of 80–86 per cent.
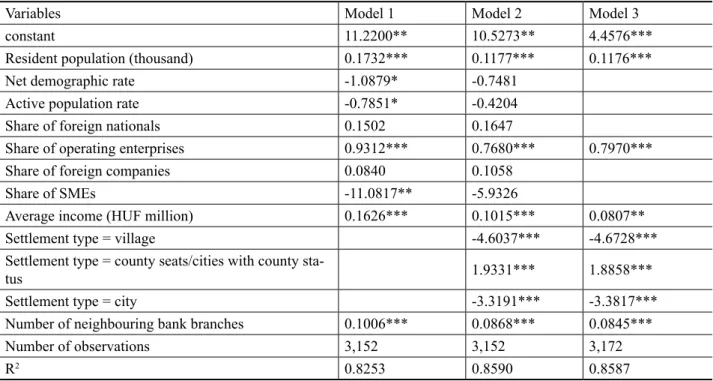
Following the modelling, the existence of spatial autocorrelation was re-examined. The Moran’s I test was run also on the error term of the final model containing only the significant explanatory variables, also with neighbour number parameter set as 5. The initial Moran’s I statistic of 0.2981 was reduced to 0.1711 as a result of controlling with explanatory variables, but the error term of the model still includes spatial autocorrelation. This residual spatial autocorrelation presumably captures the banking competition, which then is included in the model in such a way that in the new model the number of branches in each settlement is also explained by the average number of branches in the five nearest settlements, thus, the model is supplemented by the average number of bank branches in the five neighbouring settlements. The results of the supplemented models are shown in Table 3.
Table 3. Results of model variants explaining the number of bank branches based on models supplemented with a variable on the number of neighbouring branches (2020).
Variables Model 1 Model 2 Model 3
constant 11.2200** 10.5273** 4.4576***
Resident population (thousand) 0.1732*** 0.1177*** 0.1176***
Net demographic rate -1.0879* -0.7481
Active population rate -0.7851* -0.4204
Share of foreign nationals 0.1502 0.1647
Share of operating enterprises 0.9312*** 0.7680*** 0.7970***
Share of foreign companies 0.0840 0.1058
Share of SMEs -11.0817** -5.9326
Average income (HUF million) 0.1626*** 0.1015*** 0.0807**
Settlement type = village -4.6037*** -4.6728***
Settlement type = county seats/cities with county sta-
tus 1.9331*** 1.8858***
Settlement type = city -3.3191*** -3.3817***
Number of neighbouring bank branches 0.1006*** 0.0868*** 0.0845***
Number of observations 3,152 3,152 3,172
R2 0.8253 0.8590 0.8587
Source: Own editing based on HCSO, TeIR and MNB data
Note: The dependent variable for each model is the number of bank branches. The coefficients of the variables are displayed in each cell. Indication of significance levels: p<0,01 ***, p<0,05 **, p<0,1 *
The variables which were significant up to this point remained significant in the supplemented models as well, and the number of neighbouring bank branches variable included in the models due to the spatial autocorrelation also proved to be significant. This result shows that the decision on bank branches can be significantly influenced by the number of bank branches in the vicinity of the given settlement, behind which the dynamics of banking competition may lie. The more bank branches (and banks) are present in a settlement, the more likely a bank is to establish a bank branch at that location. A further explanation for the spatial autocorrelation and the significant effect of the number of neighbouring branches can be that banks presumably are more likely to set up a branch either in locations they already know better due to their own experiences, or in locations whose profitability they have better confidence in due to other banks’ operating branches in the area.
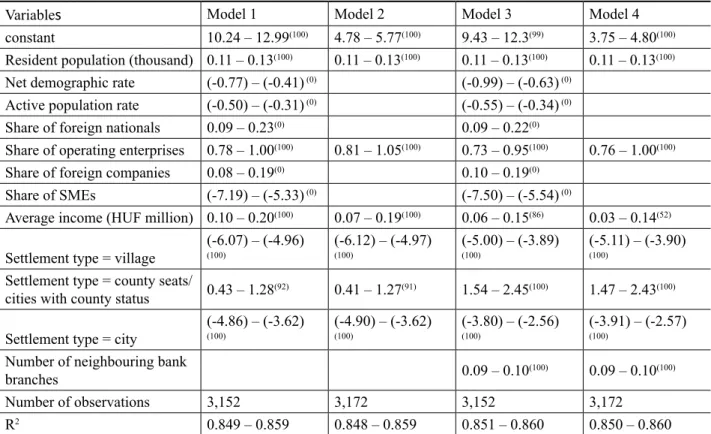
As the next step, the geographically weighted regressions were run and analysed. In the case of regressions weighted by geographical distance, the regression runs with each settlement in focus, so we get a band for the effect of each explanatory variable. Table 4 shows the results of four models: 1) Full model, without the number of neighbouring bank branches variable; 2) Model with only signifi- cant variables, without the number of neighbouring bank branches variable; 3) Full model, including the number of neighbouring bank branches variable and 4) Model with only significant variables, including the number of neighbouring bank branches variable.
Table 4. Results of the geographically weighted regression (2020).
Variables Model 1 Model 2 Model 3 Model 4
constant 10.24 – 12.99(100) 4.78 – 5.77(100) 9.43 – 12.3(99) 3.75 – 4.80(100) Resident population (thousand) 0.11 – 0.13(100) 0.11 – 0.13(100) 0.11 – 0.13(100) 0.11 – 0.13(100) Net demographic rate (-0.77) – (-0.41) (0) (-0.99) – (-0.63) (0)
Active population rate (-0.50) – (-0.31) (0) (-0.55) – (-0.34) (0) Share of foreign nationals 0.09 – 0.23(0) 0.09 – 0.22(0)
Share of operating enterprises 0.78 – 1.00(100) 0.81 – 1.05(100) 0.73 – 0.95(100) 0.76 – 1.00(100) Share of foreign companies 0.08 – 0.19(0) 0.10 – 0.19(0)
Share of SMEs (-7.19) – (-5.33) (0) (-7.50) – (-5.54) (0)
Average income (HUF million) 0.10 – 0.20(100) 0.07 – 0.19(100) 0.06 – 0.15(86) 0.03 – 0.14(52) Settlement type = village (-6.07) – (-4.96)
(100) (-6.12) – (-4.97)
(100) (-5.00) – (-3.89)
(100) (-5.11) – (-3.90)
(100)
Settlement type = county seats/
cities with county status 0.43 – 1.28(92) 0.41 – 1.27(91) 1.54 – 2.45(100) 1.47 – 2.43(100) Settlement type = city (-4.86) – (-3.62)
(100) (-4.90) – (-3.62)
(100) (-3.80) – (-2.56)
(100) (-3.91) – (-2.57)
(100)
Number of neighbouring bank
branches 0.09 – 0.10(100) 0.09 – 0.10(100)
Number of observations 3,152 3,172 3,152 3,172
R2 0.849 – 0.859 0.848 – 0.859 0.851 – 0.860 0.850 – 0.860
Source: Own editing based on HCSO, TeIR and MNB data
Note: The dependent variable for each model is the number of bank branches. The bands formed from the coefficient values obtained for the variables in the regressions are shown in the cells. The value in the superscript shows that for what percentage of the settlements chosen as central (i.e., for what percentage of the regressions)
Based on the results of the geographically weighted regressions, the relations observed between the number of bank branches and the individual explanatory variables are stable from a spatial point of view.
None of the non-significant variables in the basic models were significant at the 5 per cent significance level in any of the settlement-centred regressions run, in any of the models. Regarding significant vari- ables in the basic models, the resident population, the share of operating enterprises, the categories of village and city of the settlement type variable and the number of neighbouring bank branches (if inclu- ded in the model) remained significant in all the settlement-centred regressions run in all of the models.
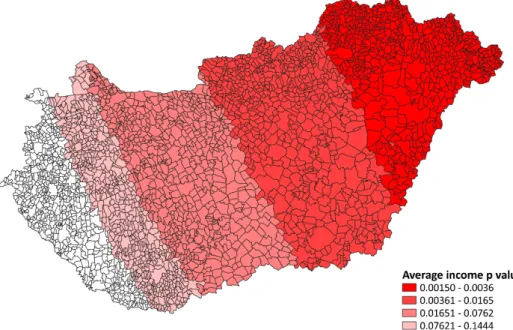
In addition, of course, the coefficient bands of these variables obtained in the geographically weighted regressions have the same sign as the related coefficients obtained in the basic models, and these bands also includes those coefficients. In two cases, the significance is not clear for all settlement-centred regressions, these are the average income variable and the category of county seats/cities with county status of the settlement type variable. In the case of the latter, the picture is clear in the case of the final models containing the number of neighbouring bank branches variable, the category is significant in the regressions run for each settlement. The average income is more scattered, while in the case of the first model it is significant in 100 percent of the settlement regressions, in the fourth model it can only be considered significant in 52 percent of the settlement regressions. The spatial distribution of the significance of the effect is shown in Figure 3, which shows the results of the fourth model, which is the most scattering in terms of the effect. The east-west division is re-emerging, the effect of the average income is becoming more and more significant from west to east. While for the majority of the western settlements it does not seem to be a significant explanatory variable, the average income is a significant explanatory variable in the whole eastern part of the country. The heterogeneity seen in the effect may be related to the fact mentioned in the presentation of the databases that the western part of the country is proportionally less covered by bank branches than the eastern part.
Figure 3. East-west division of average income in terms of the significance of the variable in the fourth model (2020).
Source: Own editing based on HCSO, TeIR and MNB data
Overall, the results can be considered robust from a spatial aspect, i.e. in terms of which settlement’s point of view the regression runs from. The observed relationships between the number of bank branches and the various explanatory variables and their significance can be considered stable, only in terms of the significance of the average income variable there is some territorial heterogeneity in the fourth model.
CONCLUSIONS
The aim of the study was to examine which factors influence the location of bank branches in Hungary and to which characteristics the settlements with favourable bank branch coverage can attribute their position. Direct bank branch profitability data were not available, nor do they exist in the case of settlements without bank branches, so, in accordance with the literature, the characteristics describing the market potential were considered for the approximation of the decision variables of the banks. During the analysis, the spatial distribution of the number of bank branches was examined in the dimensions of several socio-economic variables. The analysis showed that the location of bank branches is positively spatially autocorrelated, i.e. clustered, so an additional, average number of neighbouring bank branches variable was included in the analysis, which can also be interpreted as a proxy variable for banking market competition. Based on the results of the research, the resident population, the share of operating enterprises per capita, the average income in the settlement, and the number of neighbouring bank branches all proved to be significant factors that may encourage decision-makers of banks to establish a bank branch. In addition, settlement type also seems to be an important factor in banks’ decision-making, as compared to the districts of the capital, villages and cities have a decreasing, while county seats or cities with county status have an increasing effect on the number of bank branches, which can also be related to infrastructural and other differences between settlement types. The results obtained are strongly in line with the literature, as resident population, settlement type, economic activity, and income conditions all proved to be important influencing factors in the relevant articles. The results proved to be robust spatially, the results of the geographically weighted regression models were largely the same as the results of the basic modelling and confirmed them. In connection with the research, analysing the development of the number or existence of bank branches over time, with special regards to the trends in bank closure observed in recent years; examining the effects of the strengthening of internet banking on bank branches; and understanding the implications of the location of bank branches on the financial inclusiveness may provide further directions for future research.
REFERENCES
Alamá, L., & Tortosa-Ausina, E. (2012). Bank branch geographic location patterns in Spain: some implications for financial exclusion. Growth and Change – A Journal of Urban and Regional Policy 43(3) 505–543. https://doi.org/10.1111/j.1468-2257.2012.00596.x.
Allahi, S., & Vafadarnikjoo, A. (2015). An Integrated AHP-GIS-MCLP Method to Locate Bank Bran- ches. Proceedings of the 2015 Industrial and Systems Engineering Research Conference. https://
www.semanticscholar.org/paper/An-Integrated-AHP-GIS-MCLP-Method-to-Locate-Bank-Alla- hi-Mobin/a81948b079e990c48b5e69ab0807dd64ffd45061
American Bankers Association (1968). A Guide to Selecting Bank Locations. A.B.A. Marketing Research Aids Series Number 2, New York: American Bankers Association.
Ansong, D., Chowa, G., & Adjabeng, B. K. (2014). Spatial analysis of the distribution and determi- nants of bank branch presence in Ghana. International Journal of Bank Marketing, 33(3), 201–222.
https://doi.org/10.1108/IJBM-09-2013-0103, https://www.emerald.com/insight/content/doi/10.1108/
IJBM-09-2013-0103/full/html
Burton, D. (1990). Competition in the UK retail financial service sector: some implications for the spatial distribution and function of bank branches. The Service Industries Journal, 10(3), 571–588.
https://doi.org/10.1080/02642069000000060.
Cabello, J. G. (2019). A decision model for bank branch site selection: Define branch success and do not deviate. Socio-Economic Planning Sciences, 68. https://doi.org/10.1016/j.seps.2017.09.004 https://www.sciencedirect.com/science/article/pii/S0038012116302889
Calcagnini, G., De Bonis, R., & Donald D. H. (1999). Determinants of Bank Branch Expansion in Italy, Prepared for the 40th Società Italiana degli Economisti Meeting, University of Ancona, October 29-30, 1999. https://www.semanticscholar.org/paper/Determinants-of-Bank-Branch-Ex- pansion-in-Italy-Calcagnini-Bonis/41048cbd012c4416b4c415d0295aa3a2e8d0b1b3/abstract
Chang, A., Chaudhuri, S., & Jayaratne, J. (1997). Rational Herding and the Spatial Clustering of Bank Branches: an Empirical Analysis. Department of Economics, Columbia University Department of Eco- nomics Discussion Papers, 9697–24. https://academiccommons.columbia.edu/doi/10.7916/D8DF73DH Charlton, M., & Fotheringham, A. S. (2009). Geographically weighted regression – white paper.
https://www.geos.ed.ac.uk/~gisteac/fspat/gwr/gwr_arcgis/GWR_WhitePaper.pdf
Cinar, N. (2009). A Decision Support Model for Bank Branch Location Selection. World Academy of Science, Engineering and Technology, 60. https://doi.org/10.5281/zenodo.1074926, https://zenodo.
org/record/1074926
ECB (2020. Statistical Data Warehouse - SSI - Banking Structural Financial Indicators.
https://sdw.ecb.europa.eu/browse.do?node=9689719, Downloaded: 2020. 05. 20
Eördöghné Miklós, M. (2014). A vízi infrastruktúra jellemzőinek vizsgálata kistelepüléses térszerke- zetben. Modern Geográfia, 9(1), 19–28.
Eszes, D. (2020). A kínai pénzügyi intézményrendszer hozzájárulása a Belt and Road program finan- szírozásához. Modern Geográfia, 15(1), 1–17.
Farkas, S. (2019). Financial Institutions Matter for Territorial Development: Challenges to Achieve Growth and Positive Impact on Local Economies in Hungary (2007–2013). Corvinus Regional Studies, 4(1–2.), 99–116. http://www.crs.uni-corvinus.hu/fileadmin/user_upload/en/departments/
businessadministration/t_gazdasagfoldrajz/CRS/crs19_1_2_farkas_s.pdf
Gál, Z. (2005). The development and the polarised spatial structure of the Hungarian banking system in a transforming economy. In Hungarian Spaces and Places: Patterns of Transition, edited by Barta Gy., G. Fekete É., Szörényiné Kukorelli I., Timár J., (pp. 197–219) Pécs: Centre for Regional Studies of the Hungarian Academy of Sciences, 2005. http://www.regscience.hu:8080/xmlui/handle/11155/327 Gál, Z. (2014). A pénzügyi piacok földrajzi dimenziói: a pénzügyi földrajz frontvonalai és vizsgálati
területei, Földrajzi Közlemények, 138(3). 181–196. https://www.foldrajzitarsasag.hu/downloads/
foldrajzi_kozlemenyek_2014_138_evf_3_pp_181.pdf
Gorfu, A., & Mamo, A. (2013). Determinants of the Geographical Distribution of Bank Branches:
A Case in Ethiopian Commercial Banking Industry. Research Paper Submitted To the Research, Graduate Studies & CBEOffice, Department Of Accounting College of Business & Economics, Jimma University https://opendocs.ids.ac.uk/opendocs/handle/20.500.12413/9680
Hannan, T. H., & Hanweck, G. A. (2008). Recent Trends in the Number and Size of Bank Branches: An Examination of Likely Determinants, FEDS Working Paper, No. 2008-02, https://doi.org/10.2139/
ssrn.1327057, https://papers.ssrn.com/sol3/papers.cfm?abstract_id=1327057
Hopmans, A. C. M. (1986). A spatial interaction model for branch bank accounts. European Journal of Operational Research, 27(2), 242–250. https://doi.org/10.1016/0377-2217(86)90066-4, https://
www.sciencedirect.com/science/article/abs/pii/0377221786900664
Huang, J., & Yin, Z. (2011). Spatial Distribution of Branches, Internet Impact and the Performance of Investment Banks. In Advances in education and management, edited by Mark Zhou, International Symposium, ISAEBD 2011, Dalian, China, August 6-7, 2011, Proceedings, Part IV
Kovács, S. Zs. (2017). Város–vidék-kapcsolat a magyar pénzintézethálózatban. Területi Statisztika, 57(5), 495–511. DOI: 10.15196/TS570502 http://www.ksh.hu/docs/hun/xftp/terstat/2017/05/ts570502.pdf Lee, Y., & Fukui, H. (2003). Identifying the Relationship Between Area Characteristics by Social
Class and Bank Branches Distribution using GIS – Case Study of Tokyo 23 Wards, Map Asia 2003 Conference 2003 Poster Session.
Lempek, M. Z., & Tésits, R. (2021). A vidéki térségek turizmusalapú fejlesztési lehetőségei a Siklósi járás példáján. Modern Geográfia, 16(2), 87–112. https://doi.org/10.15170/MG.2021.16.02.05.
Mahajan, V., Srinivas, D., & Sharma, S. (1985). An application of portfolio analysis for identifying attractive retail locations. Journal of Retailing, 61(4), 19–34. http://connection.ebscohost.com/c/
articles/4668535/application-portfolio-analysis-identifying-attractive-retail-locations
MNB (2020). Data on the location of network units and ATMs handling payment services and the services provided, P56 data service.
Moran, P. A. P. (1948). The interpretation of statistical maps. Journal of the Royal Statistical Society.
Series B, 10(2), 243–251.
Okeahalam, C. (2009). Bank Branch Location: a Count Analysis. Spatial Economic Analysis, 4(3), 275–300. https://doi.org/10.1080/17421770903114695.
Qi, S., De Haas, R., Ongena, S., & Straetmans, S. (2018). Move a little closer? Information sharing and the spatial clustering of bank branches. EBRD Working Paper No. 223. https://doi.org/10.2139/
ssrn.3291522, https://papers.ssrn.com/sol3/papers.cfm?abstract_id=3291522
Szalai, Á., & Fabula, Sz. (2021). Az okos vidékfejlesztés lehetőségei és korlátai Magyarországon.
Modern Geográfia, 16(1), 59–79. https://doi.org/10.15170/MG.2021.16.01.04
Tánczos-Szabó, L. (2021). Bács-Kiskun megye térszerkezete és a telekárak (Területi különbségek a tár- sadalom értékítéletében). Modern Geográfia, 16(3), 57–146. https://doi.org/10.15170/MG.2021.16.03.04 TEIR (2020. HCSO Settlement T-Star data, BP-Star data of Budapest, NTCA personal income data Temesvary, J. (2011). Some determinants of commercial bank behavior, Doctoral Dissertation, Faculty
of the Graduate School of Cornell University, Degree of Doctor of Philosophy https://ecommons.
cornell.edu/handle/1813/30674
Tóth G. (2003). Területi autokorrelációs vizsgálat a Local Moran I módszerével. Tér és Társadalom, 17(4), 39–49. https://doi.org/10.17649/TET.17.4.914, https://tet.rkk.hu/index.php/TeT/article/view/914 Tóth G., & Kincses Á. (2011). A mai magyarországi bevándorlás térbeli autokorreláltsága,
Földrajzi Közlemények, 135(1), 83–91. https://www.foldrajzitarsasag.hu/downloads/foldrajzi_
kozlemenyek_2011_135_evf_1_szam.pdf
Vance, H. (2000). Opportunity Index Development for Bank Branch Networks. Doctoral Dissertation. The degree of Masters of Applied Science Graduite Department of Mechanical and Industrial Engineering, University of Toronto. https://tspace.library.utoronto.ca/bitstream/1807/14392/1/MQ54116.pdf
Vinkóczi, T. (2018). Pénzintézetek térbelisége Magyarországon, Tér-Gazdaság-Ember, 6(3), 67–92.
https://tge.sze.hu/images/dokumentumok/K%C3%B6tetek%20%C3%B6sszes%20cikkel/2018.%20 VI.%20%C3%A9vfolyam%203.%20sz%C3%A1m_Cikkek/03-vinkoczi-t-2018-03.pdf
Willer, D. J. (1990). A spatial decision support system for bank location: a case study.
Technical Report, 90–9. https://doi.org/10.1.1.471.878, http://citeseerx.ist.psu.edu/viewdoc/downlo- ad?doi=10.1.1.471.878&rep=rep1&type=pdf
Zhao, L. (2002). The Integration of Geographical Information Systems and Multicriteria Decision Making Models for the Analysis of Branch Bank Closures. Doctoral Dissertation. The degree of Doctor of Philosophy at the University of New South Wales Faculty of the Built Environment University of New South Wales. Sydney, Australia, May 2002 http://unsworks.unsw.edu.au/fapi/
datastream/unsworks:1751/SOURCE01?view=true
Zhao, L., Garner, B., & Parolin, B. (2004). Branch bank closures in Sydney: A geographical perspe- ctive and analysis. Geoinformatics 2004. Proc. 12th Int. Conf. on Geoinformatics − Geospatial Information Research: Bridging the Pacific and Atlantic. University of Gävle, Sweden, 7–9 June 2004, http://giscience.hig.se/binjiang/geoinformatics/files/p541.pdf
Zhao, L., & Garner, B. J. (2001). Developing GIS Tools to Integrate MCDM Models for the Ana- lysis of Bank Branch Closures. In 6th International Conference on GeoComputation. University of Queensland, Brisbane, http://www.geocomputation.org/2001/papers/zhao.pdf
Ez a mű a Creative Commons Nevezd meg! – Ne add el! – Ne változtasd! 4.0 nemzetközi licen- ce-feltételeinek megfelelően felhasználható. (CC BY-NC-ND 4.0)
https://creativecommons.org/licenses/by-nc-nd/4.0/
This open access article may be used under the international license terms of Creative Commons Attribution-NonCommercial-NoDerivatives 4.0 (CC BY-NC-ND 4.0)
https://creativecommons.org/licenses/by-nc-nd/4.0/