Network science-based analysis of human factors in systems engineering
PhD Thesis
by
László Gadár
environmental engineer
Supervisor
Dr. János Abonyi, DSc
The University of Pannonia
Doctoral School of Chemical Engineering and Material Sciences
July 2020
DOI:10.18136/PE.2020.758
Network science-based analysis of human factors in systems engineering
Thesis for obtaining a PhD degree in the
Doctoral School of Chemical Engineering and Material Sciences of the University of Pannonia
Written by:
László Gadár
Supervisor: János Abonyi, DSc
Propose acceptance yes / no ...
János Abonyi, DSc The PhD-candidate has achieved ... % in the comprehensive exam.
Veszprém, ...
(Chairman of the Eximination Committee) As reviewer, I propose acceptance of the thesis:
Name of Reviewer: Dr. Balázs Lengyel yes / no ...
(reviewer)
Name of Reviewer: Dr. Péter Pollner yes / no ...
(reviewer) The PhD-candidate has achieved ... % at the public discussion.
Veszprém, ...
(Chairman of the Committee)
The grade of the PhD Diploma ... (……….%)
Veszprém, ... ...
(Chairman of UDHC)
Kivonat
Termelő rendszerek emberi tényezőinek vizsgálata hálózattudományi esz- közökkel
A dolgozat célja a negyedik ipari forradalom emberi tényezőkre történő hatásainak vizsgálata, cél-orientált hálózattudományi módszerek alkalmazásával és fejlesztésével.
A technológiai változások bevezetésének sikeressége az alkalmazók kompetenciáján, képességein, alkalmazkodásán is múlik. A szükséges kompetenciák egyik forrása az oktatási rendszer, valamint munkahelyi környezetben a szakmai vezetés, mentor rend- szer. A fejlesztési beruházások számára elengedhetetlen a befektetési tőke, amelynek eloszlása földrajzilag nem egyenlő, és egyes régiók vonzóképessége nagyobb. Három komplex rendszer vizsgálatára, a rendszerek jobb megismerésére alkalmas hálózattu- dományi eszközök fejlesztése a kutatás célja.
A dolgozatban bemutatott egyik újdonság, hogy az összes diplomást anonim mó- don tartalmazó, hazai diplomás pályakövetési rendszer adatain alapulva a felsőfokú végzettek diplomái és az általuk betöltött munkakörök egy kétoldalú hálózatba rendez- hetők. A hálózat moduljainak feltárásával megállapítható a szakok és a munkakörök horizontális illeszkedése, munkakörök kompetencia szükséglete.
A befektetési tőke számára vonzó régiók meghatározását a hazai cégtulajdonosi há- lózatból levezetett települési hálózat alapján mutatja be a dolgozat. A cégtulajdonosok lakóhelyének és a telephelyének hálózatában az élek kialakulásának valószínűsége tá- volságfüggő. A dolgozat bemutatja, hogy az élek becslése különböző null-modellekkel lehetővé teszi távolságfüggetlen modulok meghatározását, így a távolságtól független vonzóképességi tényezők feltárását.
A termelő rendszerekben dolgozók tanulási képessége egyenlőtlen, ezért a techno- lógia váltáskor ajánlott a szakmai mentor rendszer, betanulást támogató vezetés. Je- len dolgozat a termelő rendszerek munkahelyi szociális hálózatából határozza meg az Ipar 4.0 fejlesztések sikeres bevezetéséhez a kulcsembereket. A munkahelyi hálózatot többdimenziós kapcsolatokkal írja le az újonnan fejlesztett módszer. A kapcsolatok- ban rendszeresen együtt jelen levő dimenziók feltárásával lehetővé teszi a potenciális mentorok kijelölését, vezetők erősségének és gyengeségének meghatározását, szervezet- fejlesztési vagy egyéni fejlesztési területek meghatározását.
Abstract
Network science-based analysis of human factors in systems engineering The dissertation aims to investigate the effects of the Fourth Industrial Revolution on human factors by applying and developing goal-oriented network science methods.
The success of the introduction of technological changes depends, among others, on the competences, abilities and adaptation of the users. One of the sources of the necessary competencies is the education system, as well as the professional leadership and mentoring system in the work environment. Investment capital, which is essential for development investment, geographically differing and some regions has a higher attractiveness. The goal was the development of network science based tools suitable for a better understanding of these three complex systems.
One of the novelties presented in the dissertation is that the degrees of higher edu- cation programs and the jobs they hold can be arranged in a bipartite network. The network based on the data of the Hungarian graduate career tracking system, which includes all graduates anonymously. The horizontal match of the higher education de- grees and occupations, thus the competence requirement of the jobs can be determined by exploring the modules of the network.
In case of investment capital, the definition of attractive regions derived from the Hungarian company ownership network. The likelihood of the formation of edges decreases with increasing geographical distance. The dissertation shows that the es- timation of edges with different null models increasingly allows the determination of distance-independent modules, thus uncovering attractiveness factors.
The learning ability of those working in production systems is unequal, so when technology is changing, it is recommended to build a supporting leadership and men- toring system. This dissertation provides an efficient method to identify the key peo- ple from the social network of production systems for the successful implementation of Industry 4.0 developments. It describes the community of workplaces as a multidimen- sional network and exploring the dimensions that often occur together in the edges.
The newly developed method allows the selection of suitable mentors, the determina- tion of the strengths and weaknesses of leaders, as well as organizational development or individual development areas.
Abstrakt
Untersuchung der menschlichen Faktoren in Produktionssystemen mit netz- werkwissenschaftlichen Methoden
Ziel der Dissertation ist die Auswirkungen der vierten industriellen Revolution auf menschliche Faktoren durch Anwendung und Entwicklung zielorientierte netzwerkwis- senschaftlicher Methoden zu untersuchen. Der Erfolg der Einführung technologischer Veränderungen hängt auch von der Kompetenz, den Fähigkeiten und der Anpassung der Benutzer ab. Eine der Quellen für die erforderlichen Kompetenzen ist das Bildungs- system sowie das professionelle Management- und Mentorensystem im Arbeitsumfeld.
Investitionskapital, das geografisch ungleich ist und in einigen Regionen eine höhere Attraktivität aufweist, ist für Entwicklungsinvestitionen von wesentlicher Bedeutung.
Ziel der Forschung ist ein netzwerkwissenschaftliches Werkzeug zu entwickeln, die zur Untersuchung von drei komplexen Systemen und zum besseren Verständnis der Sys- teme geeignet sind.
Eine der in der Dissertation vorgestellten Neuheiten ist, dass die Hochschulab- schlüsse und durch Sie besetzte Positionen in einem wechselseitigen Netzwerk er- scheinen. Die verwendeten Daten stammen aus der Datenbank des Karriere-Tracking- Systems für Absolventen. Die Datenbank enthält anonym die Daten aller Absolventen.
Module wurden aus dem Netzwerk untersucht. Jedes Modul zeigt gut die horizontale Passform der Hauptfächer und Berufe der Hochschulbildung und damit den Bedarf an beruflichen Kompetenzen.
Durch Erkundung der Module des Netzwerks, der horizontalen Anpassung der Kur- se und der Arbeitskreis kann der Bedarf an der Kompetenz der Jobs bestimmt werden.
Die Definition von für Investitionskapital attraktiv Regionen wird in der Dissertation auf der Grundlage des aus dem ungarischen Geschäftsinhabernetzwerk abgeleiteten Abwicklungsnetzwerks dargestellt. Die Wahrscheinlichkeit der Bildung von Kanten im Wohn- und Geschäftsnetz von Geschäftsinhabern nimmt mit zunehmender geo- grafischer Entfernung ab. Die Dissertation zeigt, dass die Schätzung von Kanten mit unterschiedlichen Nullmodellen zunehmend die Bestimmung entfernungsunabhängiger Module ermöglicht und damit entfernungsunabhängige Attraktivitätsfaktoren unter- sucht.
Die Lernfähigkeit in Produktionssystemen arbeitenden ist ungleich, deswegen in Fall Technologie Änderung wird ein professionelles Mentoren System und eine Füh- rung empfohlen, die das Lernen unterstützen. Geeignete Methoden sind erforderlich, um geeignete Mentoren und Führungskräfte zu identifizieren. Diese Dissertation iden- tifiziert die Schlüsselpersonen aus dem sozialen Netzwerk von Produktionssystemen am Arbeitsplatz für die erfolgreiche Umsetzung von Industrie 4.0-Entwicklungen. Das Arbeitsplatznetzwerk wird in der neu entwickelten Methode durch mehrdimensionale Verbindungen beschrieben. Indem Sie die Dimensionen untersuchen, die regelmäßig in Beziehungen zusammen vorhanden sind, können Sie potenzielle Mentoren identi- fizieren, Stärken und Schwächen von Führungskräften festlegen und Bereiche für die Organisationsentwicklung oder die individuelle Entwicklung identifizieren.
Acknowledgements
I am grateful to my supervisor, Prof. Dr János Abonyi, who gave me professional support, encouragement, motivation, enthusiasm and adjustable deadlines. Without them, the work would not have been completed. It is an honour to work with him on a matter that we hope will get a better understanding of the world around us.
I would like to thank Tamás Szonda, the CEO and owner of Innopod Solutions Kft., for encouraging me to write this thesis. He was always curious and eagerly awaiting the next results, and he was proud of the developments.
Last but not least, I thank my family for allowing me to write and create separately, and they tolerated I spend time without them. I hope that when my children grow up, they will understand what I did in the closed room. I want to thank my wife, who patiently organized the family without me and encouraged me to write my thesis.
List of abbreviations
Table 1 Abbreviations in Chapter 2 Abbreviation Explanation
A adjacency matrix of the bipartite graph of educational programs and occupations
Aij element of the weighted adjacency matrix represents how many graduates of the i-th bachelor program are working on the j-th profession
A˜ij element of the purified weighted adjacency matrix con- sidering an α threshold parameter, defined by Eq. 2.6 U represents the set of educational programs in the bipar-
tite graph
V represents the set of occupations in the bipartite graph ki represents the number of students graduated in the i-th
program ki =P
jAij
kj represents the total number of employees having a given (j-th) profession kj =P
iAij
ksat the empirical value of degree of saturation
kcut the empirical value of degree of cut; the distribution of degrees can be considered linear in log-log scale between the range ksat and kcut
L represents the total number of links in the network, L= P
i,jAij
nc The number of communities in the network Cc The c-th community
Nc Set of nodes in c-th community
Lc Set of links connects nodes in c-th community
Mc The modularity value ofc-th community, defined by Eq.
2.3
ACc the sum of actual links in the c-th community
Abbreviation Explanation
PCc the sum of expected links in the c-th community, where expectation based on configuration model
LRCc the ratio of actual and expected links in thec-th commu- nity, the so called Louvain Ratio of the c-th community defined by Eq. 2.8
BSc/BA Bachelor of Science and Bachelor of Arts, the bachelor level of graduation
HEd Higher Education degree
ISCO International Standard Classification of Occupations STEM Science, technology, engineering, and mathematics
Table 2 Abbreviations in Chapter 3 Abbreviation Explanation
p person/investor who is equivalent to the owner of a com- pany
co company
[l] level of the settlement hierarchy (see Eq. 3.2)
entity[l] aggregation of an entity at level l of the settlement hi- erarchy
A[p,co] bi-adjacency matrix of person-company ownership net-
work
a[p,co]i,j an element (edge weight) of theA[p,co]bi-adjacency ma-
trix of person-company ownership network
A[p,l], A[co,l] incidence matrices of person-location and company-
location bipartite networks at the level l of the settle- ment hierarchy
A[l] simpler notation of an adjacency matrix of location net- work at l level of settlement hierarchy (see Eq. 3.3)
kj[l,in] in-degree of the j-th node (geographic region) at level l
of the settlement hierarchy
ki[l,out] out-degree of the i-th node (geographic region) at level
l of the settlement hierarchy
n[l,co]j , n[l,p]j numbers of companies and people in the j-th region at
level l of the settlement hierarchy
N[co], N[p] number of companies and people/owners/investors in the network
L number of links in the network
C set of communities (each node is member of exactly one community)
C[l] set of communities at level l of the settlement hierarchy (C1 denotes the set of towns)
n[l]c number of communities at levell of the settlement hier- archy
f(C) generally a metric as a function of community structure that indicates the goodness-of-fit of the community on the bases of the connectivity of nodes in it
f(C[l]) metric of the goodness-of-fit of the community structure which is the level l of the settlement hierarchy
Abbreviation Explanation
M a special f(C) defined by Eq. 3.18 called modularity of network
Mc modularity of community c (sum of the modularity of each community yields the modularity M of the net- work)
D[l,in]i , D[l,ex]i internal and external densities of thei-th community at level l of the settlement hierarchy, defined by Eq. 3.11 and Eq. 3.12
Oi[l] openness of the i-th community at level l of the settle- ment hierarchy, defined by Eq. 3.13
Ei[l] expansion of thei-th community at level l of the settle- ment hierarchy, defined by Eq. 3.14
LCA[l]i link-collection ability of i-th community at level l of the settlement hierarchy, defined by Eq. 3.15
CR[l]i cut ratio of the i-th community at level l of the settle- ment hierarchy, defined by Eq. 3.16
Table 3 Abbreviations in Chapter 4 Abbreviation Explanation
G labelled and directed multidimensional network G = (V, E, D)
V set of nodes
E set of edges, and E = {(u, v, d);u, v ∈ V, d ∈ D}; in directed network the edges (u, v, d) and(v, u, d)are dis- tinct
D set of labels on edges, defines the dimensions of edges, D={d1, d2, ..., dM}, wheredi is a dimension
M a multilayer network which is a pair M= (G,C), where G = {Gα;α ∈ {1, ..., M}} is a family of graphs Gα = (Vα, Eα) (called layers of M)
M the number of layers of M α a layer of M, α∈ {1, ..., M}
C the set of edges between nodes of the different layers Gα and Gβ with α 6= β; mathematically C= {Eαβ ⊆ Vα× Vβ;α, β ∈ {1, ..., M}, α 6= β}, Eα are called intralayer andEαβ(α6=β)are referred to as interlayer connections I a set of items in frequent pattern mining, I = {I1, I2, ..., IM} (in market basket analysis, Ii represents a given product)
T the set of transactions, T ={t1, t2, ..., tm}, where ti ⊆I D the database of all transactions, D= {T1, T2, ..., Tmax} E the database of all multidimensional edges, E =
{E1, E2, ..., Emax}, where Ek = {(u, v, d);u, v ∈ V, d ∈ D} is a multidimensional edge, which is a set of dimen- sions, Ek ⊆D
Euout represent the outgoing set of multidimensional edges of a node u ∈ V, Euout = {E1, E2, ..., Emax}, Ek = {(uout, vin, d);u, v ∈V, d∈D}
Euin represent the incoming set of multidimensional edges of u ∈ V, Euin = {E1, E2, ..., Emax}, El = {(vout, uin, d);u, v ∈V, d∈D}
C is a multidimensional edge C⊆E smin a user-specified minimum support
sT(C) represents the probability of multidimensional edge C, and if sT(C)≥smin then C referred to as frequent
Abbreviation Explanation
A antecedent of an A ⇒B association rule (A∩B =∅), A⊂D
B consequent of an A⇒B association rule (A∩B =∅), B ⊂D
cT(A⇒B) the probability of finding B under the condition that multidimensional edges also contain A, the confidence of an A ⇒ B association rule (A ∩B = ∅), cT(A ⇒ B) = P(B|A) = sTs(A∪B)
T(A)
l this is the so called lift(A⇒B), which means that how much B increases (lift) the likelihood of A
λ this is so called leverage (A ⇒ B), which means that how much more often A and B occur together, than expected under independence
Contents
Abstract ii
Acknowledgments vi
List of abbrevations vii
List of figures xviii
List of tables xix
1 Introduction 1
1.1 Measure the effect of digital transformation - a macroeconomic perspective 3
1.2 Measure human factors at workplaces - a microeconomic perspective . . 4
1.3 Uncertainties and research questions . . . 7
1.4 Aims and objectives . . . 8
1.5 Methodological aspects . . . 9
1.5.1 Methodological opportunities with networks . . . 9
1.5.2 Finding modules . . . 11
1.5.3 Application of multilayer networks . . . 12
1.6 Outline . . . 13
2 Modularity based node similarity in a bipartite network 15 2.1 Introduction . . . 15
2.2 Methods . . . 17
2.2.1 Bipartite graph model of the education to work transition . . . 17
2.2.2 Evaluation of the education-occupation match . . . 18
2.2.3 Simultaneous clustering the programs and the occupations . . . 18
2.2.4 Multi-resolution cluster analysis . . . 19
2.2.4.1 Improvement of the resolution . . . 19
2.2.4.2 Modified multi-resolution method . . . 20
2.3 Results and discussion . . . 21
2.3.1 Administrative data of the hungarian career path tracking system 21 2.3.2 Measuring overeducation . . . 22
2.3.3 Evaluation of the degree distributions . . . 24
2.3.4 Evaluation of education - occupation matching . . . 27
2.3.5 Degree correlation and centrality measures . . . 27
2.3.6 Clustering and visualisation . . . 28
2.3.7 Application of multi-resolution cluster analysis . . . 30
2.4 Conclusion . . . 32
2.5 Contributions to Industry 4.0 issues . . . 34
3 Modularity based attractivity in a spatial network 36 3.1 Introduction . . . 36
3.2 Problem formulation: settlement hierarchy and community structure in personal investment patterns . . . 39
3.2.1 Network representation of personal investment patterns . . . 39
3.2.2 Internal and external connection-based evaluation . . . 41
3.2.3 Evaluation of the community structure in the settlement hierarchy 42 3.2.3.1 Modularity of a region and level of a settlement hierarchy 43 3.2.3.2 Null models for representing regional attractiveness . . 44
3.2.3.3 Economic relations of the regions . . . 45
3.3 Results and discussion . . . 46
3.3.1 Description of the studied dataset . . . 46
3.3.2 Network topology analysis . . . 47
3.3.3 Measuring attractiveness . . . 49
3.3.4 The effect of geographical distance . . . 50
3.3.5 Comparison of the null models . . . 52
3.3.6 Evaluation of the modularities . . . 52
3.3.7 Forming communities . . . 56
3.4 Conclusions . . . 59
3.5 Contributions to Industry 4.0 issues . . . 60
4 Evaluation of network, clusters and node characteristics with over- lapping dimensions of multidimensional edges 61 4.1 Introduction . . . 61
4.2 Methods . . . 63
4.2.1 Multidimensional representation of organisational networks . . . 63
4.2.2 Frequent pattern mining of edge labels in multidimensional net- works . . . 65
4.2.3 Node characterisation based on incoming multidimensional edges 68 4.3 Results and discussions . . . 69
4.3.1 The studied organisational networks . . . 69
4.3.2 Analysis of the extracted association rules . . . 69
4.3.3 Characterisation of the leaders . . . 74
4.3.4 Clustering-based identification of the key persons . . . 76
4.3.5 Effects of the advice network . . . 77
4.4 Conclusions . . . 79
4.5 Contributions to Industry 4.0 issues . . . 79
Conclusion I
Contributions III
Theses IV
Publications VIII
References XXVIII
List of Figures
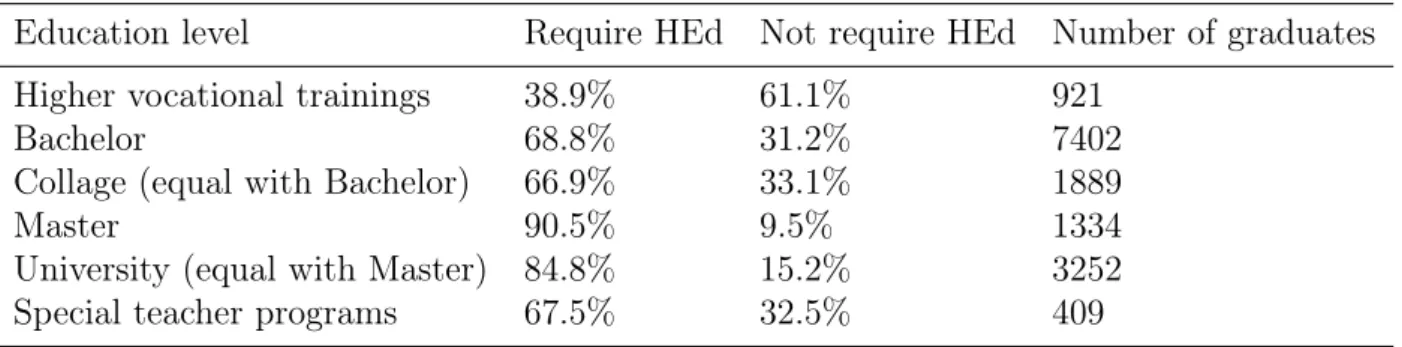
1.1 Schematic representation of a complex sociotechnological system pointed out the contents of thesis with dashed lines. . . 14 2.1 Distribution of bachelor graduates working in an occupation that re-
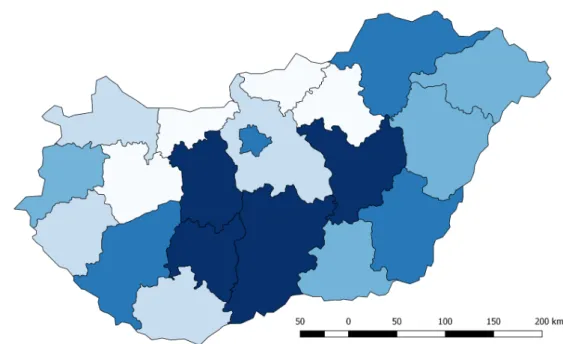
quires higher education degree. . . 23 2.2 Distribution of graduates that work on occupation which requiring higher
education degree by counties in Hungary . . . 25 2.3 Distribution of the weighted degrees of the occupations . . . 26 2.4 Distribution of the weighted degrees of the bachelor programs . . . 26 2.5 The modules obtained by the Louvain algorithm of purified program/occupation
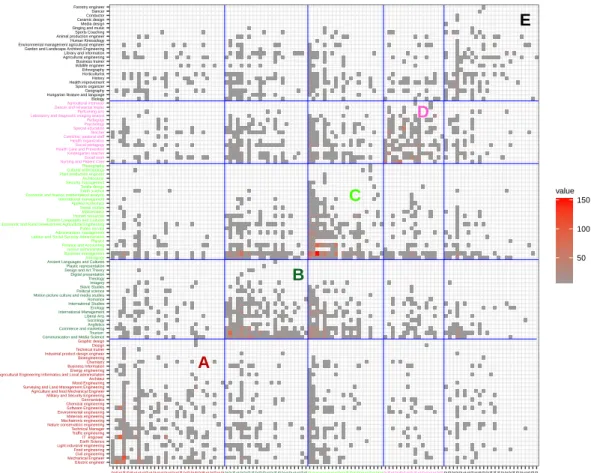
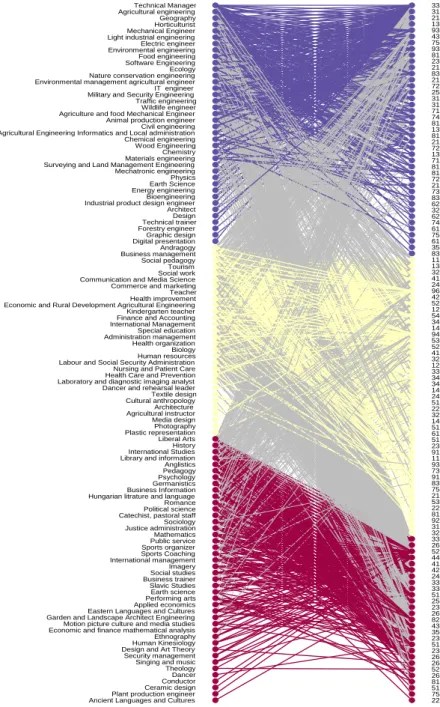
bipartite graph. . . 29 2.6 Clustering and reordering of the bipartite graph with Barber algorithm
(grey edges indicate connections between modules; blue, yellow, red edges are in the three modules) . . . 31 2.7 Distribution of the education - occupation significance values as the
ratio of the remaining edges after pruning with different α . . . 32 2.8 Number of clusters in case of differentα . . . 33 2.9 Relationship of clusters generated in step one and step three of the
multi-resolution analysis . . . 33 3.1 Company-ownership relations connect the elements of the settlement
hierarchy (Settlement (LAU 2), statistical sub-region (LAU 1), small- region (NUTS 3), region (NUTS 2)). . . 40 3.2 Map of the town-level company ownership network. Edges with more
than 10 ownership connections are shown. Edges connected to the cap- ital (Budapest) are denoted by green lines. . . 47 3.3 Distribution of the k[1,in]j edges at the LAU-2 settlement hierarchy level. 48 3.4 Local clustering coefficient as a function of the k[1,in]j node degrees . . . 49 3.5 Degree correlations of ownership network in LAU-2 settlement hierarchy 50 3.6 Network density as a function of the number of inhabitants on the level
LAU 1. . . 50
3.7 Openness of small regions (LAU 1 level) as a function of the number of their inhabitants. . . 51 3.8 Empirically derived deterrence function determined by Eq. (3.26), where
Ii[in]=n[1,p]i , Ij[in]=n[1,co]j . . . 51 3.9 Comparison between the number of the edge weights a[1]i,j and their es-
timated values p[1]i,j generated by different null models on the town level (LAU 2) settlement hierarchy whenIiout=ki[1,out] and Ijin=kj[1,in]. The +symbols represent the inner connections that form a separate cluster.
This plot directly reflects the goodness of fit as the model estimates the connections of the towns. . . 54 3.10 Comparison between the number of the edge weights a[2]i,j and their es-
timated values p[2]i,j generated by different null models at level LAU 1 of the settlement hierarchy when Iiout = ki[1,out] and Ijin = k[1,in]j . The + symbols represent the inner-connections that form a separate cluster.
This plot reflects that during the aggregation procedure, the qualita- tive behavior of the models does not change, furthermore, the same phenomena can be observed as in Fig. 3.9. . . 55 3.11 Comparison between the number of the edge weights a[2]i,j and their es-
timated values p[2]i,j generated by the gravity null model at level LAU 1 of the settlement hierarchy when Iiout =T DIi and Ijin =T DIj. The + symbols represent the inner-connections that form a separate cluster. . 55 3.12 Communities formed by the Louvain method and Newman-Girvan (NG)
null model (Ii=kiout and Ij=kjin) reflect the settlement hierarchy as the resultant communities are almost identical to the counties. . . 56 3.13 Communities formed by the Louvain method and gravitational null
models reflect the attractiveness of Budapest as only less developed closed regions were not assigned to the module of the capital. . . 58 4.1 Representations of a multidimensional network . . . 64 4.2 Six layers of the organisational network of Company A (left: light blue
is L1, orange is L4; middle: dark green is L8, magenta is L12; right:
dark yellow is L13, dark blue is L15. The nodes are coloured according to the departments they belong to. The shape of nodes corresponds to the positions as triangles represent leaders and circles stand for the employees.) . . . 70 4.3 Summary of rules (size is proportional to support, colour is proportional
to lift) . . . 72 4.4 The probability of dimensions in rows given the dimensions in the
columns in the case of all three companies . . . 73
4.5 Motivating leaders. For the sake of interpretability of the figures, a small amount of random variation is added to the location of each point to avoid overlapping and persons with more than four in-degree are plotted at Company C. . . 75 4.6 Clusters of key persons in Company A visualized by principal compo-
nent analysis. The numbers at the axes labels show the percentage of the variance represented by the principal component. . . 76
List of Tables
1 Abbreviations in Chapter 2 . . . vii
2 Abbreviations in Chapter 3 . . . ix
3 Abbreviations in Chapter 4 . . . xi
2.1 Variables of the dataset . . . 22
2.2 Distribution of graduates working in occupation category that requires higher education degree (HEd) . . . 23
2.3 Results of fitting power-law to bipartite graph . . . 26
2.4 Top 10 strongest connection . . . 27
2.5 Top 10 weakest connection . . . 28
2.6 Louvain ratios of the pairs of program-occupation clusters . . . 29
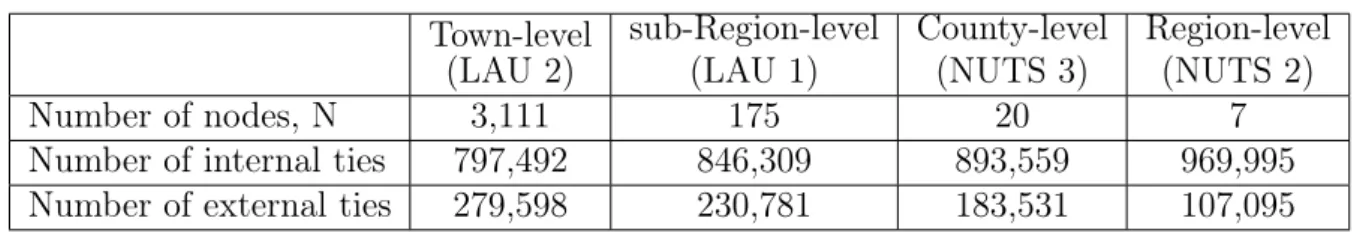
3.1 Number of edges inside the settlement hierarchies . . . 47
3.2 Parameters of the power-law distributions fitted to networks at different settlement hierarchy levels. . . 48
3.3 Performances of distance-dependent null models . . . 53
3.4 Coefficients of the parametric models that reflect the importance of the variables . . . 53
4.1 Corresponding nomenclature of frequent itemset mining and multidi- mensional networks . . . 67
4.2 Support values of the edge labels in the studied organisations . . . 70
4.3 Proportion of the number of dimensions in multi-edges . . . 70
4.4 Lift(L1⇒B) values at the studied companies . . . 77
4.5 Confidences of the ruleA⇒L1 of the companies . . . 78
Chapter 1 Introduction
Fourth Industrial Revolution (Industry 4.0) has started, and it is having an impact on more and more areas of our lives. The concept of Industry 4.0 was first introduced by the German government in 2013. Industry 4.0 is the trend towards automation and data exchange in manufacturing technologies and processes which include cyber- physical systems (CPS), the internet of things (IoT), industrial internet of things (IIOT), cloud computing, cognitive computing and artificial intelligence. Industry 4.0 initially took place in engineered cyber-physical systems, and now continually spreading and growing in our culture. The cyber system of the digital age, with its hyper computing power, communication infrastructure, algorithms and information processing, is changing many other systems, such as social systems, enterprise systems, biological systems.
In my thesis, I have attempted to develop network science-based problem-oriented methods, which I will apply to study the human factors in systems engineering at macro and micro level of economy related to Industry 4.0. While working as a data analyst in a personal and organisational development company, I encounter problems with human factors when examining production systems. Working as a researcher in a research group supported by the Hungarian Academy of Sciences, my goal is to study processes behind the various phenomena affecting higher education and/or affected by higher education. New types of problems present new types of challenges, and the solutions require advanced data analysis methods.
Before introducing the developed methodologies, I place my work in a broader context in the Introduction chapter. I do not wish to analyse the technical defini- tion, achievements, results and future directions of the Fourth Industrial Revolution, because it goes beyond the subject of the thesis. Nor do I want to deal with the microeconomic and macroeconomic issues of production systems.
The focus of Industry 4.0 is on increasing the efficiency in production. The result is a digital transformation that is changing not only production systems but also the work of other systems, from public administration to health care to education.
Digitalisation, the appearance of industrial robots, the large amount of available data, the analytical capabilities and algorithms, and the emergence of new tools pose new challenges for company staff. We are in the age of the growing demand for digital skills in the workplaces, in communication, in everyday life.
The changes have an impact on the labour market, education and organizations.
There is a shortage in the labour market for skilled employees, moreover, jobs are being lost and/or transformed. The rapid rearrangement of employee competencies is indicated by estimates that say, 65% of the positions that Generation Z will occupy do not yet exist[1]. The role of the man is changing in the digitalized and robotic work environment, and employees need to prepare for transformation. Human factors will always be present in places where people are, and this will be the case in production systems as well.
The impact of digital change on people and employees should be continuously mon- itored and measured at different measurement levels. The results of measurements help to prepare for future challenges, to forecast processes more accurately, to determine intervention points, and to make the right decisions.
In my thesis, I developed three measurement methods related to human factors using network science toolkit, narrowing the wide broad topic area: labour market matching of higher education programs, spatial characteristics of investment decisions, and identification of key people in workplaces. The common baseline of these issues is whether methodological tools of networks science can be used to better understand some human behaviour in production systems at different aggregation levels.
In the first section of the Introduction chapter, I focus on the macroeconomic mea- surement points that researchers take into account to predict the future, to determine the readiness of different levels of geographical regions to Industry 4.0. I believe that researchers in this field determine the best proxy indicators of areas related to human factors, and I investigate the relationships with my work.
In the second section, I consider the human factors in preparing for the changes taking place in the production systems, that are on the front lines of the 4th Industrial Revolution. The decline in human-human relationships and the increase in human- machine relationships raise several issues.
In the final part of the Introduction chapter, I review my goals and motivations for what tasks and problems I seek answers to and why I selected these research areas. I survey the network analysis methodologies that can support to achieve my goals and gives the direction how I would like to answers my research questions. Network science tools open new research possibilities, so I consider it important to review the field in this chapter.
1.1 Measure the effect of digital transformation - a macroeconomic perspective
The digitalisation and robotisation of production systems involve challenges for com- panies, for politics as well as the whole economics. It is interesting to survey the current state of science, what processes are brought to the researchers’ attention, and what measurement points have been selected to monitor changes. Developments and interventions at production site, settlement, region as well as country level are related to results of these measurements.
The impact of Industry 4.0 on increased investments in equipment and network infrastructure, on the personnel and material costs, on the patterns of demand ac- cording to occupations and skills, and on the increasing demand for goods are in the focus of scenario researchers [2]. Their results show that Industry 4.0 will accelerate the structural transformation towards more services and we have to be prepared to a significant labour force movement between sectors and occupations which will be higher than the change of the number of employees overall (considering entering new ones and leaving old ones).
Measurement points of change caused by Industry 4.0 can be well tracked through readiness research. Researchers of Industry 4.0 readiness carry out studies at different levels. A case study on Industry 4.0 readiness of Hungarian production plants inves- tigates the data collection and utilisation processes in terms of manufacturing, the strengths and weakness of implementation strategy, existing equipment, IT perspec- tive, innovation of products, training need of employees and issues related to national economic policy with a comprehensive questionnaire [3]. A research pointed out that the small and medium-sized enterprises sector showed the need to support in the aspect of preparations for revolution 4.0 [4], which indicate the fast-changing at a micro-level.
At city level Ref. [5] proposed a particular purposed measurement system called Smart Collaboration Index to assess innovation capabilities of cities which measures not only the current performance and the potential of the individual players of the ecosystem but also their collaboration capability and potential according to quadruple helix model.
Investigation of NUTS regions in terms of readiness is a gap in the literature.However, it has a significant effect both on companies and countries. Ref. [6] has attempted to identify open access indicators at the NUTS2 region level. Indicators which explicitly able to measure the readiness of regions related to higher education, labour market, innovation activities, investment, technological readiness. Their results show that the employment factors and the innovation activities are the main variables in the rankings of regions in terms of the Industry 4.0 readiness.
Authors analysed the Industry 4.0 readiness of Central and Eastern European
countries at the country level. They examined the technological, entrepreneurial and governance competencies [7]. The ”Invest east, export west“ policy of West European countries formed thanks to the lower labour costs, good skills, and improving local business conditions. Among all variables of so-called I-Com Industry 4.0 Index include indicators of the physical and human capital to support manufacturing. The use of technologies, such as the degree of 4G coverage, the percentage of STEM graduates, the share of ICT specialists in total employment, the extent to which firms provide ICT training to their staff and the share of data workers in total employment.
The Networked Readiness Index of World Economic Forum also measures assessing countries’ preparedness to reap the benefits of emerging technologies and capitalize on the opportunities presented by the digital transformation and beyond with 53 individ- ual but related indicators (that is why called networked index) [8]. Their readiness subindex measures skills among others and impact subindex infer the economic and social impact of new technologies. Whenever relevant, the Index looks at what the dif- ferent actors in society, both private and public, can do to contribute to the country’s networked readiness.
All indicator system suggest that the digitalisation and robotics brought by Indus- try 4.0 have a powerful on changing the skills of employees and members of society as a whole. Digital technologies are disrupting career paths creating the need for new skills. The number of graduates and the number of people working in the job are used to classify regions, but these two factors are related. However, it is complicated to determine the relationship between degrees and jobs.
1.2 Measure human factors at workplaces - a microe- conomic perspective
Many workers think that machines and automation steal people’s work, and this revo- lution is, therefore, dangerous [9]. Industry 4.0 does not endanger people’s work more than Ford’s moving assembly lines created for enhanced efficiency. The role of man in production is changing and shifting towards control and supervision rather than the specific physical work. In fact, workers need to be open to the evolving challenges and tasks, especially openness for digital competences, is required.
Human systems engineering (HSE) is the field and commonly used intended as a structured approach to influence the intangible reality in organisations in a desirable direction. HSE combines engineering and psychology to design systems consistent with human capabilities and limitations. In other words, making technology that works for humans. HSE provides a circle of the following steps: planning, analysis, design, test and evaluation. During the planning phase, the missions and scenarios are analysed.
The analysis phase contains function analysis, function allocation, task analysis. After
the planning and analysis step, the developed elements will be applied in practice in system design and in the test and evaluation steps. In the thesis, I focus on the analysis phase because developed methods in the thesis related to this step.
Man-man collaboration has been complemented with man-machine (e.g. engine, computer) and machine-machine cooperation to integrate each other’s strengths and to improve the efficiency of the production system. It is worth considering the differences, strengths and weaknesses of the machine and human competencies according to the given technical level when adjusting the level of automation and allocates tasks and function to human and/or machine.
Deciding which functions (tasks, jobs) of a human-machine system should be allo- cated to the human and which to the machine is one of the most essential activities within human factors research [10, 11, 12]. In 1951, the Fitts list [13] was the begin- ning of function allocation research and still the most widely used function allocation technique despite the severe criticisms [14, 15]. The original Fitts list is a list of 11 statements about whether a human or a machine performs a specific function better.
Those functions that are better performed by machines should be automated, while the other tasks should be assigned to the human operator. Although, not all of its 11 statements valid today because machines have improved significantly in the past time, but still an essential approximation that describes the most important regularities of automation [12].
In addition to taking into account the competences of the human and machine in the workflow, the desired level of automation needs to be examined in the function allocation step. Ref. [16] provides an intuitive flowchart of what should be automated.
For each type of automation (acquisition, analysis, decision, and action), a level of automation between low (manual) and high (full automation) is chosen according to automation criteria. The level is then evaluated by applying the primary evaluative principles of human performance consequence, and adjusted if necessary, in an iterative manner [16]. Sheridan and Verplank [17] introduced the list of 10 levels of automation which is based on the extent of decision and action done by man or machine in a task. Recent research emphasises the fact that automation introduces various problems such as behavioural adaptation, mistrust and complacency, skill degradation, degraded situation awareness, issues when reclaiming control and disruption to mental workload [12].
From the observations of how past function allocation methodologies have failed, some specific lessons learned. Additional techniques are needed to analyse human cognitive requirements [10]. Nowadays, the process is called cognitive engineering, whose goal is to provide a better fit between the human operator and the system so that the operator can more effectively perform tasks [18]. If hardware, software, and human interaction requirements are not integrated during design, it will fall on the human user/operator to do that integration in addition to the work demands of the job
at hand. System design deficiencies become operations problems and require highly skilled users (or mentors) to overcome these deficiencies. These skill requirements drive increased training demands.
At the design phase, the cognitive task analysis (CTA) is used to capture people’s tasks and goals within their work domain. It aimed at understanding tasks that require a lot of cognitive activity (e.g. decision making, problem-solving, memory, attention, judgement) from the user and is still an important technique to uncover system or operator level intervention points in a production workflow [19]. CTA is a structured framework specifically developed for considering the development and analysis of these complex socio-technical systems. These complex cognitive systems often involve people interacting with computers and also interacting with each other via computers in intricate networks of humans and technology. CTA can show what makes the workplace work and what keeps it from working as well as it might. [19]
CTA focuses on constraints, it develops a model of how work can be conducted within a given work domain, without explicitly identifying specific sequences of actions. [20]
Some example how Industry 4.0, the automation and robotics change the pro- duction nowadays with the involvement of operators. Smart factories increasing the automation and enhance the interaction between operators and machines, which is generated a vast amount of data via different sensors and carrying the potential for further improvement. The focus of the Factory2Fit project supported by the EU is a knowledge-sharing platform called "Solution" [21]. The aim of this system is to increase the worker’s motivation, satisfaction and productivity with becoming knowl- edge workers in a smart factory with fulfilling careers. The system collects data from operators’ work and shares best practices with others. Ref. [22] reviewed the recent trends on Human-Cyber-Physical Systems (H-CPS) that is integrate the operators into a flexible multi-purpose production system creating the Operator 4.0 paradigm [23].
Authors highlighted that smart sensors, Internet of Things infrastructure wearable devices and data-driven analytic and monitoring provide a significant added value and cost reduction solution to operators in a concept of the smart factory where human and machine cooperate with each other. The last example is the sequence-mining based analysis of sensor-generated alarm data from an automated process system highlighted the benefits of the application of temporal alarm suppression rules because related faults and root cause can be uncovered [24].
The lesson learnt is that people are an integral part of the technical transformation.
With the introduction of digitalization and robotics, it is necessary to develop new competencies in production systems, but learning and adoption of new knowledge are not the same for everyone. Production systems need good leadership, mentors who can support their colleagues to make technological change as smooth as possible. Fast, cheap, efficient, intelligent information discovery solutions are needed to find the right people and formulate organizational development proposals.
1.3 Uncertainties and research questions
It is still uncertain how Industry 4.0 will impact work, organisations, leadership, skills, education. Due to the rapid transformation of the labour market, it is questionable how education accommodates to the situation and how degrees match occupations at the labour market. In addition, the Industry 4.0 indicator systems presented above regularly use the number of graduates (e.g. STEM) and/or the number of people working in a given job. Questions arise, is there a reliable methodology for monitoring the relationship between education and the labour market? How well does education programs match with occupations? What types of professions match with the degree and which degree can be converted extensively? Is it a good readiness indicator which measures only the number of graduates in a given field? Or only the number of people working in a given job? Presumably, the relationship between degrees and jobs needs to be better examined. It is required an advanced methodology which can provide information about the matching of the labour market and education.
Developments require investment capital, as robotics and efficiency-enhancing solu- tions are money-intensive. Industry 4.0 readiness indicators provide information about an area or subregion for investors to make their decisions. Of course, it is questionable how much data is examined and whether it is obtained at all by them. However, how does investor capital move spatially? What are the driving forces behind investors who live in a locality investing in another? If we can draw a spatial network, how can we interpret connections? How much influence a city or capital its region? Which regions are attractive and to whom?
The impact of Industry 4.0 is most felt in workplaces. People’s digital footprint grows, organisations become more data-rich, and the need for data analysis increases.
Employees will be more demanded of flexibility, openness to innovation, adaptation, cooperation, training, problem-solving and communication. However, less monotony tolerance, memory, and precision will be required as machines and automation replace them. Managers increasingly need to act as leaders rather than managers. Their main tasks will be motivation, inspiration, knowledge management, performance anal- ysis, and creating a trusted climate. As the automation process intensifies, change management needs to become increasingly employee-focused for sustainability. [25]
Implementing changes and learning how human-machine relationships work properly, requires disseminating of competencies that need good leaders, good mentors, compe- tent professionals, and retention of key people. However, who are they? Of course, managers know their employees to some extent, based on everyday practice. Much valuable information can be lost as the size of the organisation increases. We have seen from the literature above that interview surveys exist to assess cognitive needs, and key persons but these are costly and time-consuming techniques, besides, it is difficult to summarise the information received in case of a large number of interviews.
Can it be determined with a cheaper and simpler methodology that who is an appro- priate mentor to develop his/her colleagues by transferring and/or sharing knowledge?
Is the manager capable of creating a trusting climate and can motivate her/his em- ployees? Who needs to be improved by a personal developer? Who is a key person in the organisation whose retention needs to be paid more attention? Who is influential and accepted among employees and why?
1.4 Aims and objectives
My goal is to find empirical answers to research questions with the usage and devel- opment new network science methodologies in a goal-oriented manner.
Specifically, my aim is to investigate the human factors of production systems listed below, using network science methods, considering the available reliable databases:
• the transition of knowledge acquired in education into work, that is to say, the competencies needed to fill a position or the qualifications need to jobs, and find horizontal similarity between educations and occupations,
• the spacial indicators of the decision situation in the business ownership network and to describe attractive regions,
• the nature of multidimensional relationships between the different types of con- nections in the social network of employees, and characterize actors with con- nection types and define similar (key) actors with similar multidimensional rela- tionships.
Examining the matching of education and occupations requires exploring the fre- quent career paths. Graduates with a specific competency package get the jobs that best suit them [26]. The Administration Database of Hungarian Authorities contains career paths of a grade cohort, which also summarises occupations they work with a specific graduate degree. A career path connects education with the job, where the links are the graduates. Thus, the problem of training-occupation matching is trans- formed to the uncover of modules of a bipartite network where one set of nodes are educations, and the other set of nodes are professions. My goal is to examine the career path data as a bipartite network to explore modules to determine the similarity of elements.
A network with specific properties emerge when the formation of relationships be- tween spatially embedded nodes effected by the costs and risks. An investor living in a settlement wish to minimize the risk [27]. The network of settlements in which the edges point to the direction of investment can be modelled with a spatial network. My goal in this decision-based network is to determine the attractiveness of settlements.
My methodological aim is to investigate the effects of different null models that ap- proximate the edge formation on the determination of attractiveness. My purpose is to use the ’regions’ (modules) where edges are more likely to appear than the null model predicts, to determine the factors of attractiveness.
Human relationships are multidimensional because feelings, evaluations, percep- tions, intentions, interests emerge between interacting people. One way to analyse a network with complicated connection types is to separate relationships by dimensions (layers). However, at the dyad level, the appearance of dimensions occur together is not likely to exist independently [28]. The presence of overlaps is the result of a com- bination of several phenomena. My goal is to develop a survey and analysing method to uncover the properties of multidimensional relationships of employees. My further aim is to develop a goal-oriented approach at the dyad level for analysing frequently together occur dimensions. Different actors contribute to varying extent to overlap- ping dimensions in him or her incoming or outgoing edges. My goal is to develop a method which finds similar entities by overlapping dimensions. With the help of this new method I want to examine motivating leaders, mentors, areas of required personal development.
1.5 Methodological aspects
I set my goals of applying and developing network science methodologies to answer my research questions, so in the Introduction chapter, I consider it important to provide an overview of the field of science. Two of the empirical chapters focus on search- ing modularity to find similar elements and one chapter pay attention to multilayer networks, so I open a discussion on them in the Introduction chapter.
Researchers have distinguished between complicated and complex systems. The main idea behind complex systems is that the ensemble behaves in a way not predicted by the components. The interactions matter more than the nature and the performance of the units. [29] If complex systems can be understood through connections, then network models should be used to study them. Network science provides a broad analytic tool for understanding multilevel, multi-label, multilayer networks. To better understand some selected phenomena related to Industry 4.0, I interpreted databases as a network, developed methods, divide elements to clusters and analysed them.
1.5.1 Methodological opportunities with networks
A network is a great model to represent connected entities, which is indicated with the revolutionary growth of new methodologies and articles since Erdős and Rényi [30]
through Watts and Strogatz [31], as well as Barabási [32] and Newman [33] to nowa- days. The dynamics and structure of the system of interconnected elements are being
knowledgeable by methods of network science. Among others, the following options are opened when analysing a system as a network. I would like to demonstrate that with the development of network science, a huge number of methodological possibil- ities open, but not all of them are applied in my empirical research, but they may emerge in my later research.
• defining the properties of nodes in a network
– determination the embeddedness of nodes in the network – centralities [34, 35]
– influential entities [36, 37]
– the role in a multilayer network [38]
– structurally and regularly equivalence (similarity) [33]
• defining densely connected subnetworks
– modules, communities of nodes [39, 40, 41, 42, 43]
– and steps for solving the resolution limit problem [44, 45]
– modules in a multilayer network [46]
• defining structural properties at the dyad level – reciprocity [47, 48, 49]
– transitivity, local and global clustering coefficient [33]
– overlaps of edges in a multirelational network [50]
• defining structural properties of the network – degree distribution of nodes [51, 52]
– components [33]
– paths and small world effect [31]
– homophily or assortative mixing [53]
• processes on networks
– spreading phenomena [54]
– percolation, resilience, robustness [55, 56, 57]
– dynamical systems [58]
There is a tremendous amount of analytical potential, which results from thinking in networks. It is impossible to use all available analytical method, and therefore goal-oriented selection is necessary, to get a better understanding of the system under investigation.
1.5.2 Finding modules
The analysis of vertical matching of the educations and occupations is equal to find densely connected elements in a bipartite network. Thus, the problem of the appli- cability of competences acquired in training can be transformed into finding modules in a bipartite network where the one set of nodes are educations and the other set of nodes are the occupations.
The likelihood of emerging links between spatially embedded vertices is usually distance dependent. Thus, evidently, the number of connections between nearby ver- tices is higher, so the random configuration model based modules will be geographic regions [41]. However, my goal is to find other attractiveness factors besides geograph- ical distance, so different null models should be used when exploring the modules.
Finding modules is one of the main analytical methods used in this work. Therefore some of its properties need to be discussed. A module is a unit whose structural elements are densely connected among themselves and relatively weakly connected to items in other community. A complex system can be managed by dividing it up into smaller pieces and looking at each one separately [59]. The presence of modules and the degree of modularity is one of the most important structural characteristics of the network. Network modularity, by definition, is a difference that compares the number of connections within a module to the expected number of links compared to the null model [60]. Community structure algorithms are maximizing the modularity and thus uncovering densely connected units of the network.
Define community structure is performed in two consecutive steps: first, detection of meaningful community structure, and the second, evaluation of the appropriateness of the detected communities. One of the main directions of community detection algo- rithms is greedy algorithms [61, 62]. Another leading trend in the defining community structure based on random walking like infomap method [63]. But there are several other methods developed by researchers [64].
Modularity based community detection has a resolution limit, and small commu- nities remain undetected. These algorithms fail to detect modules which contain less than √
Ledges, where Lis the total number of edges in the network [65]. RB [66] and AFG [45] methods can handle this resolution limit problem by modifying the modu- larity function with adjusting the contribution of the null model and adding self-loops to the nodes, respectively.
In addition to the resolution limit, another limitation of the community detection is that a node is only included in one module. Structurally, it may be possible for one or more vertices to belong to multiple modules. Identifying these a priori un- known building blocks is crucial to the understanding of the structural and functional properties of networks [43]. Palla et al. introduced an approach to uncover overlap- ping communities to understand the modular structure of complex systems better.
Since then, there have been developed many other methods of exploring overlapping communities. [67, 68, 69, 70]
The community detection in complex systems with spatially embedded nodes caused another challenge for researchers. The distance-dependent edge formation proved by the deterrence function shows that when the configuration model or Newman-Girvan modularity is previously applied as a null model, the communities overlook the spatial nature of the system and modules reflect geographical regions [41]. The selection of the reference network or null model determines the factors that the researcher consid- ers when finding modules as mesoscale structural elements of the network [71, 72]. If the null model better approximates the edge weights of the studied network, than the value of modularity decreases, however, the forces of formation modules less effected by geographical distance. If the reference network contains economic factors or gravity- like driving forces, the methodology may also be suitable for defining attractiveness factors.
1.5.3 Application of multilayer networks
It is easy to realize that treating all the network’s links on an equivalent footing is a too big constraint, and may occasionally result in not fully capturing the details present in some real-life problems, leading even to incorrect descriptions of some phenomena that are taking place on real-world networks [73]. A set of people in a social network interact with different patterns, different levels, people have different aims to contact others and connections are not equal. Strong and weak ties [74], multiple relationships are around us. A multilayer network is an intuitive model to describe complex systems.
The decomposition of a complex system into layers providing new insights into the structure and function. The multilayer modelling of human brain networks obtained new achievements based on magnetic resonance imaging and resulting in better un- derstand the functional connectivity of neurons [75]. Detect communities in a network with multiple connections by layers helps to define similar entities which frequently being in the same community [76]. The interlayer connected transport network model of a city where layers represent different modes of public transport (bus, tram, subway etc.) helps to find the intervention point to reach better diffusion of users and catego- rizing zones [77]. The degree of centrality of nodes distributed in different layers helps to characterize them by function [38, 78].
The coexistence of several types of interactions among the entities of a complex system is responsible for substantial differences in the kind and variety of behaviours.
Analysis of multilayer networks become a hot topic in the complexity science. How- ever, it has a various challenge in the future. [79] One of these is to find meaningful correlations between layers which is reflected in this thesis.
1.6 Outline
I have shown that Industry 4.0 is implemented in a socio-technological complex system where machine/computer/IoT cooperate. Complex systems are best known through relationships because some property of elements expresses in an interaction. Sys- tems need to analyse as network, separate into components to make conclusions. In my dissertation, I examine three (two macro and one micro-level) aspects of a socio- technological complex system related to human components with developing new meth- ods:
• the relationship between employees skills and university degrees
• the formation and characteristics of a network influenced by geographical dis- tance in the business owner network,
• multidimensional relationships of co-workers, leaders.
Graphical abstract of my thesis shown in Figure 1.1. I would like to represent the related examined elements with connections and separate the individual chapters that appear in the dissertation with dashed lines. Although each of the separated parts is a chapter of the dissertation, and they are also related. An employee with a specific higher educational degree and skills has a multidimensional relationship with her/his colleagues. Her/his work is influenced by the investor, who expects results and performance from her/him. I would also like to demonstrate with this figure that I do not deal with human-machine and human-IoT relation because the focus of my thesis is on human factors.
Chapter 2 (Modularity based node similarity in a bipartite network) provides a methodological innovation for the relationship between university degrees and occupations by establishing a bipartite network. I studied similar degrees and oc- cupations with uncovering the modules in the network. I also analyse which education and occupation have a focused or diffused relationship with the other set of nodes in the bipartite network.
In Chapter 3 (Modularity based attractivity in a spatial network) I ex- amine the network of settlements based on business ownerships. The network can represent the attractiveness of settlements for investors also in Industry 4.0 investment projects. Methodological development and difficulties in understanding the system are related to the spatial characteristics of the network.
Chapter 4 (Evaluation of network, clusters and node characteristics with overlapping dimensions of multidimensional edges) at the micro-level explores the multidimensional relationships of employees of companies. As a methodological development, I examine the multidimensional relationships between employees and use overlaps of several layers to qualify and cluster nodes.
Personality Needs Opinion Aims Competences Skills
Chapter 4 Thesis 3
Chapter 2 Thesis 1
Chapter 3 Thesis 2
Figure 1.1 Schematic representation of a complex sociotechnological system pointed out the contents of thesis with dashed lines.
Chapter 2
Modularity based node similarity in a bipartite network
Abstract To study education – occupation matchings we developed a bipartite net- work model of education to work transition and a graph configuration model based metric. The career paths of more than seven-thousand Hungarian students based on the integrated database of the National Tax Administration, the National Health Insurance Fund, and the higher education information system of the Hungarian Gov- ernment were studied. A brief analysis of gender pay gap and the spatial distribution of overeducation is presented to demonstrate the background of the research and the resulted open dataset. We highlighted the hierarchical and clustered structure of the career paths based on the multi-resolution analysis of the graph modularity. The results of the cluster analysis can support policymakers to fine-tune the fragmented program structure of higher education.
2.1 Introduction
Policymakers need solid information on how labour market evaluates higher education graduates. Institutions also should collect and analyse relevant information about their graduates for the management of their programs [80]. Since the salary and the chance of finding a job are important decision factors at the college attendance [81], university and program level public information about the career paths are also important to candidates of higher education [82].
Although self-reported data can have validity problems, questionnaire based da- tabases are useful to study education-occupation matches. Among these, the Reflex database is the most comprehensive information source in Europe. The analysis of this database showed that graduates working in the field of their study have higher income and satisfaction, so they are a happier members of the society [83].
Administrative data can replace traditional questionnaires to offer much more ob-
jective information for evidence-based educational policy in decision-making [84]. In Hungary, the 2007/CI law prescribes that governmental organisations should review their decisions by using administrative data. As a new element, under the Government Decree No. 389/2016, the basic financial support for Hungarian higher education in- stitutions changed based on the overeducation data calculated from the administrative databases. In Austria database of the whole state insurance system is accessible in anonymized form, which is also ready to career path analysis [85]. With administrative data, we can also measure the added value of higher education institutes by combin- ing information about persistence rates, graduation rates, and post-college earnings [86]. The use of administrative data has a long tradition in Northern Europe. Finland recently connected administrative and survey data sources [87]. Based on the register of Statistics of Finland some employers were suggested to be interviewed to study unemployment of young graduates and transition from higher education to work [88].
The Swedish Ladok database was used to determine the influence of higher education institutions on labour market by regression analysis. The availability of extensive, longitudinal data made it possible to the evaluate the matching of the occupation and the level of the degree among engineering, teaching, nursing, business specialisations [26].
In this work, a new method was developed to dig deeper by focusing a goal oriented network mining tool to evaluate the matching of programs and occupations on the more detailed, at program level.
In recent years, network-type models have been proven to be useful in understand- ing complex systems in different subject areas (e.g. sociology, economy, industry, and biology [89]). Real life entities (e.g. people, universities, educational programs) can be characterised by numerous categorical properties (e.g. education can characterise peo- ple). Relationships between entities and values of a selected property can be modelled with a two-mode network (also known as a bipartite graph) [90].
The proposed network model is based on the integration of the databases of the National Tax Administration, the National Health Insurance Fund, and the data ware- house of the Hungarian higher education. This administrative dataset covers 15 thou- sand people graduated in 2009/2010 academic year and worked in 2012 May. Based on the data of 7402 Bachelor students we defined a bipartite graph of 110 bachelor programs and 113 occupations encoded by the third level of International Standard Classification of Occupations (ISCO) code system. The nodes of the resulted network are connected by 7402 links that represent the employees who received their bachelor level in a given program and work in a given profession. To demonstrate the power of administrative database, we present a brief analysis of gender pay gap and the spatial distribution of overeducation.
The analysis of the bipartite network shows that both the programs and the oc- cupations follow a power law distribution which reflects there is a structure in the