Building a House From Lego Blocks: Using Cross Cultural Validation to Develop the Constructed Motivation Questionnaire (CMQS) in Science
Soeharto Soeharto1, Benő Csapó2
1 University of Szeged, Doctoral School of Education, 32–34 Petőfi Sandor Street, H-6722 Szeged, Hungary, soeharto.soeharto@edu.u-szeged.hu
2 University of Szeged, Institute of Education, 13 Dugonics Square, H-6722 Szeged, Hungary, csapo@edpsy.u-szeged.hu
Annotation. This study focuses on constructing an instrument based on cross cultural vali- dation. The constructed motivation questionnaire (CMQS) in science to measure student moti- vation. Exploratory factor analysis (EFA) and confirmatory factor analysis (CFA) were achieved with acceptable criteria. The reliability of latent factors in the CMQS ranges from 0.828 to 0.967.
There is no significant bias based on gender. The details about assessment for all latent factors were discussed in the full article.
Keywords: motivation for learning science, validation, constructed questionnaires, factor analysis.
Introduction
The rapid growth of science necessitates the provision for public policy in complex fields, such as health, engineering, genetic engineering, science, energy, and education. To contribute effectively to the society, individuals must possess and comprehend scientific knowledge and literacy to make well-informed decisions, and they should also be able to analyse various scientific questions and determine how human activities affect the natural world (OECD, 2007). Moreover, individuals must be first scientifically literate for gaining
ISSN 1392-0340 (Print) ISSN 2029-0551 (Online) https://doi.org/10.15823/p.2021.142.12 Pedagogika / Pedagogy
2021, t. 142, Nr. 2, p. 218–241 / Vol. 142, No. 2, pp. 218–241, 2021
further scientific knowledge to support this change. In the education field, it is not just essential to learn science but also to discover factors that motivate students to grasp this subject. Indonesian students obtained the 8th lowest rank on student performance in science according to the Programme for International Student Assessment (PISA) 2018 report. The performance of boys from Indonesia with regard to scientific knowledge is one of the lowest from among the countries and economies that are part of the PISA.
On the basis of the report, the average performance score in science of Indonesian stu- dents was 391 in 2018, which indicated a 12-point decrease compared with 2015, which placed Indonesia in a far worse position from that of the average score of other countries (OECD, 2018). A low performance score in science can be an indication of the lack of motivation in learning science; thus, educators must identify factors related to student motivation in science during the early years itself to improve their willingness to learn science (Lin-Siegler et al., 2016; Kusurkar et al., 2013; Hazrati-Viari, Rad, & Torabi, 2012).
Therefore, science motivation can be assumed as an essential construct that decides students’ achievements in the field.
In recent years, science education has contributed to the development of science and literacy (National Academy of Sciences, 2010). Students’ ability to understand scientific literacy issues that aid in grasping further knowledge is not a process that can be culti- vated spontaneously (Glynn et al., 2009). However, in contemporary education, students’
capabilities and interests are limited on the basis of standardised evaluations due to pre-determined benchmarks; hence, teachers fail to identify the factors that motivate students in science. Moreover, they are also unable to explain why students’ interest in science is pivotal to comprehend. This knowledge for the teacher has a direct correspond- ing effect and can improve student performances in learning science (Chen et al., 2014).
A decline in science learning achievement occurs when teachers fail to comprehend what motivates students in learning science, especially during middle and secondary school education (Chen et al., 2014). Wang and Liou (2017) suggested that student motivation in learning can increase with specific attention. Student motivation is a factor that in- fluences learning achievement, a rationale to learn science, student interest and beliefs about a specific task in science (Ho & Liang, 2015). Thus, student motivation in science can help teachers and students to improve science learning outcomes.
The self-determination theory (SDT) is a motivation and growth paradigm that is used to analyse ideal human activities and progress (Niemiec & Ryan, 2009). Intrinsic and extrinsic motivation are the basic tenets of the SDT, which is described in the more detailed cognitive assessment approach of Deci and Ryan (1985). Although some scholars differ in their perspectives, these two structures are part of a continuum. They are: (a) lack of motivation; (b) four levels of extrinsic motivation, which include external, introjected, identified and integrated regulations and (c) an intrinsic motivation (Deci & Ryan, 2000).
Achievement goal theory (AGT) focuses on the reasons why students choose to be involved in various activities and assignments in learning. Two aspects play an essential role in
learning goals, namely, mastery and performance goals. In turn, there are various other factors that affect student motivation and learning outcomes (Mayer & Alexander, 2016).
Students who endorse mastery goals want to invest their time and effort in the task due to their interest in learning further. In mastery goals, students tend to compare their past performances with their current ones in learning instead of comparing their abilities in learning with those of other individuals. Students who endorse performance goals are focused on demonstrating their capabilities to other individuals. Furthermore, they are concerned about exhibiting their competence and comparing their capabilities with those of others in the learning process (Skaalvik & Federici, 2016). Nonetheless, several other factors also influence student motivation in learning as outlined in the social cognitive theory (SCT), such as anxiety, self-esteem, self-efficacy and self-regulation (Senler, 2016).
Some constructs from three prominent theories are thus included in the questionnaire that was developed in the study in relation to student motivation and science learning.
Science teachers can help students who lack motivation in learning science through individual consultations or by creating like-minded groups for imparting education. In addition, these learning processes also provide information on what aspects underlie the motivation of students in learning (Altun, 2017). However, at the beginning of the learning process, how can science teachers identify which students lack motivation in learning science? What causes the lack of student motivation in learning science? Why are they not motivated to study science? These questions are adequate as primary instruments that can guide science teachers to motivate students based on their understanding of the general response to these questions. Nevertheless, answering these queries may be fairly difficult for teachers, especially for those who are preoccupied with administrative tasks and the evaluation of learning in an institution.
Moreover, assessing students personally is uncommon for institutions. To solve this problem, some researchers have developed a questionnaire to assess students’ motivation in science. Glynn et al. (2011) developed and validated student motivation questionnaires in science and non-science majors on the basis of the approach of SCT. Hsiao et al. (2005) also developed a questionnaire to measure student motivation in science learning on the basis of environmental influences and learning. However, in accordance with the initial search and literature review conducted in this study, a questionnaire from goal achievement, self-determination and social cognitive theories has not yet been developed. This research was thus directed to measure student motivation in science using advanced statistical analysis by establishing and validating divergent constructs related to student motivation in science and its peripheral aspects on the basis of three prominent motivation theories.
Questionnaires are a tool science teachers can employ to efficiently collect student information that is useful during consultation sessions of a more personal nature. In addition, questionnaires can investigate student motivation in science learning and the relationship of motivation to other aspects. Validation is the basic principle in develop- ing, evaluating, and revising a research instrument, mainly a questionnaire in research.
Validation in practice and theory is also crucial because it refers to the relationship be- tween theories and facts and is used in interpreting the results obtained in the form of a scored questionnaire (American Educational Research Association, 1999). Validity is a unitary concept and contributes to numerous evidence, and it has three types, namely, content validity, criterion validity, and construct validity (Osterlind, 2006). However, this research is focused on establishing constructs based on three motivation theories by doing cross-cultural adaptation several dimensions related to motivation in science learning. Thus, this research will use the principle of cross-cultural adaptation for as- sessment and instruments by Hambleton et al. (2004) who proposed the standards for test adaptation and development.
Theoretical Framework
A theoretical framework is necessary to support the measurement model and discuss the results. This section will elaborate on establishing constructs in the used questionnaire on the basis of the motivation theories. The motivation of students for science is essen- tial for their learning and achievements and for future career choices (Areepattamannil et al., 2011; Taskinen et al., 2013). Motivation is often considered a background aspect of learning and choices in science education research. This study represents some constructs related to the three motivation theories.
On SDT, three relevant constructs are included in this study, namely, intrinsic moti- vation, extrinsic motivation, and identified motivation. Participants in this construct are characterised by their intrinsic motivation as they are valued for being interesting, fun, and rewarding. Extrinsic motivation is described by the participants already involved in the scientific activity, not for its inherent value but for reasons linked to external values.
For instance, information on proper qualifications in science can be obtained (Ryan
& Deci, 2000). Identified motivation describes a person who respects the mission and embraces the regulatory process to some degree. Students who afford some extra time to study because they genuinely feel that they can maximise their ability, although they are not satisfied with the job (Deci et al., 1991).
Motivation has roots in student goals for learning science. Two student goals are emphasised in an achievement goal theory approach, namely, mastery and performance goals. Mastery goals have been theorised to produce similar effects as performance goals in any educational context and not to weaken each other (Dweck, 1986; Nicholls, 1984).
Performance and mastery goals illustrate the different values of the learning process and distinct views regarding what must be learned and why some scientific phenomena happen. These goals also relate to diverse factors, which are the reasons for engaging in multiple activities. Students oriented with mastery goals focus on doing tasks in learning and mastering new skills in science. Mastery goals are commonly associated
with high-quality learning approaches, high levels of willingness, and metacognition to evaluate current scientific knowledge (Senko et al., 2011). Students oriented with performance goals focus on mastering skills to compare their performances with those of other students. Students tend to link self-value with individual performance, such as intrinsic and extrinsic motivations. Mastery and performance goals are not two separate aspects, but they are factors that co-exist in motivation with the purpose of learning science (Hidi & Harackiewicz 2000). On the basis of its association with other factors, student achievement or orientation goal is central to many motivational and academic outcomes (Midgley & Urdan 2001; Pintrich, 2000).
On SCT, self-efficacy is chosen because in some studies, this construct is related to intrinsic motivation, extrinsic motivation, performance goal, and mastery goal (Maulana et al., 2016; Schumm & Bogner, 2016). Self-efficacy describes the perception of individuals regarding achieving goals and completing specific tasks. Students will be highly moti- vated to learn if they believe that they could obtain what students want (Bandura, 1986), whereas if they have low self-efficacy, then they would fear hard work because it would produce something negative (Glynn et al., 2011). Pajares (2002) affirmed that self-efficacy is an essential predictor in learning and is related to student achievement and learning goals. There is also a belief that self-efficacy is a determining factor that influences the decisions of students when they reach adulthood (Bandura et al., 2001).
Another factor included in the Constructed Motivation Questionnaire in Science (CMQS) is anxiety. Anxiety is a human emotional component that manifests itself in the form of apprehensive behaviour and restlessness with regard to endeavours in life. When this type of emotional aspect occurs concerning a state of testing or assessment, it is called anxiety of testing. However, this study focuses on test anxiety. Test anxiety is an experience that expresses itself in the mind and behaviour of the candidate in the form of fear of fail- ure or negative self-assessment. The more people are nervous or concerned about possible treatment for themselves, the more they become apprehensive, afraid, and powerless (Ola- toye and Afuwape, 2003). Additionally, test anxiety is a significant predictor of academic performance. Sgoutas-Emch et al. (2007) reported that the achievement of students in a science course was significantly predicted by the level of perceived preparedness, self- efficacy, previous exposure to the course materials, and test anxiety. Furthermore, Thomas and Gadbois (2007) verified that test anxiety was a significant predictor of examination grades. In the PISA 2015, test anxiety became one of the background factors that affected student learning and achievement in science (Kuger et al., 2016).
The seven factors or constructs related to student motivation in science that has been selected and adapted for the developed questionnaire are mastery goal, performance goal, intrinsic motivation, identified motivation, extrinsic motivation, self-efficacy, and test anxiety. After their adaptation for all of the related constructs, we combined all the con- structs to a questionnaire used in this study, and we named the questionnaire as the CMQS.
Present Study
After constructing the questionnaire, we conducted cross-cultural validation to demon- strate whether the developed instrument used is in accordance with the Indonesian context.
Cross-cultural validation aims to determine whether the developed instrument can be used in different cultures in similar studies, especially in the Indonesian or the non-western context (Huang & Wong, 2014). Before having been combined into questionnaires, the original constructs were in English, and they were used in the Indonesian version.
All of the processes in the adaptation of the questionnaire were referenced to the International Test Commission (ITC) guidelines for test adaptation by Hambleton, Merenda and Spielberger (2004). The adaptation and development of instruments have four main principles, namely, context, development and adaptation, administration and score interpretation. All the principles in the test adaptation guidelines were followed to adapt and develop the CMQS. Seven factors from different established constructs from previous research were combined in the developed questionnaire in this study (CMQS), namely, mastery goal, performance goal (Hellgren & Lindberg, 2017), intrinsic motiva- tion, extrinsic motivation (Nielsen, 2018), identified motivation (Maulana et al., 2016), self-efficacy (Schumm & Bogner, 2016) and test anxiety (PISA, 2015).
Validity and reliability in the measurement model will be essential aspects to inves- tigate in this study before exploring gender differences to measure student motivation in science using the CMQS in the Indonesian context. Reliability will also be calculated using internal consistency according to Cronbach’s alpha and composite reliability (CR).
Validity will be analysed using exploratory factor analysis (EFA) and confirmatory factor analysis (CFA). EFA provides preliminary information on how students construct their knowledge in learning science with psychometric factors from the motivation question- naire. EFA is also used because this study adapted, added and changed some statements in chosen constructs. The psychometric factors indicate that some motivational components are conceptualised differently. The factors formed are called latent factors, and these fac- tors must be the same based on the factors in constructs in the CMQS. CFA was used in this study to confirm the results from EFA. Furthermore, CFA will provide information related to confirming validity, especially convergent validity and discriminant validity, and the goodness of fit (GoF) indexes of the measurement model.
Finally, the research goals of this study are to investigate the validity and reliability in the measurement model and to explore the gender differences in student motivation in science using the CMQS. The following are the research questions related to goals in this study:
(1) How valid the CMQS is according to EFA and CFA to measure student motivation in science?
(2) How reliable the CMQS is according to internal consistency using Cronbach’s alpha and CR?
(3) Are there any differences of CMQS in model and dimension levels in measuring gender?
Methods
Participants
The participants were selected for the study using stratified random sampling. The study was conducted in West Kalimantan Province, Indonesia. We first conducted a power analysis using G-power software to calculate the minimum sample required (Faul et al., 2009). With an alpha level (5%), the needed power (95%), and a medium effect size (0.3), the sample size required according to G-power analysis was 111. In this study, 311 students in senior high school from 10th to 12th grades in science major from 10 different schools and 500 undergraduate students from three distinct universities in science major were also included in the study. The participants comprised a total of 811 students with 40.4%
males and 59.6% females. The participants were 15 to 24 years old. The questionnaire was constructed by the researcher using both paper and online resources. The online-based questionnaire was administered through the eDia platform, which is an online system for diagnostic assessments. This platform has been used for evaluations and assessments across learning research, ranging from pre-school to higher education (Csapó & Molnár, 2019). Table 1 describes the sociodemographic characteristics of the participants.
Table 1
Sociodemographic Characteristics of the Participants in this Study Baseline characteristic
Full sample
n %
Gender
Female 483 59.6
Male 328 40.4
School status
Private 557 68.7
Public 254 31.3
Highest educational level
Senior high school 500 61.7
University or postgraduate degree 311 38.3
Age
15–17 293 36.12
18–20 459 56.59
21–24 59 7.27
Note. N = 811; the participants were on an average 18.06 years of age (SD = 1.68, S.E = 0.59).
Procedures
This study developed, adapted, and added constructs in the questionnaire according to the four main principles of adapting and developing an instrument from the ITC guide- lines for test adaptation (Hambleton, Merenda, & Spielberger, 2004). The first principle is the context. Considering that the sampling target in this study comprises Indonesian students, researchers must eliminate the effect of cultural differences that are trivial to the main purposes of the study, such as language and wording for each item in the questionnaire. The researchers (one senior instructor from Pakuan University and one doctoral student in linguistics major from the University of Szeged) translated the items in the questionnaire using the back-forward translation from English to Indonesian and then from Indonesian to English. All the statements or wordings in the questionnaire were adjusted on the basis of the Indonesian context. Thereafter, the revised question- naire was initially constructed. To examine the clarity of each item, five postgraduate students were asked to provide comments and opinions related to each construct in the questionnaire and to check whether there was an overlapping construct to improve the questionnaire quality. According to their comments, three items in identified motiva- tion and two items in extrinsic motivation were paraphrased because the meaning was difficult to understand. Subsequently, a questionnaire named the CSMQ with 37 items was produced. The second principle is test development and adaptation, after ensuring the questionnaire that is adapted and developed considering the linguistic factors and cultural differences of the target sample, which is the Indonesian student. The researchers made a score assessment rubric and a questionnaire manual in the Indonesian language.
The next principles are administration and score interpretation. The researchers also requested ethical approval from the University of Szeged and registered a questionnaire using the eDia system. Scoring was performed using a point scale with a range from 1 to 5, except anxiety on the questionnaire, which was scored as per a range from 1 to 4. The test anxiety remained in the initial number form because this construct was adopted according to the PISA 2015 trial test. The scoring rubric was used to interpret data on paper- and online-based tests with the eDia system.
Instruments
The CMSQ was developed by adapting seven factors from well-established constructs with 37 items to measure student motivation in science. Four items of mastery goal and four items of performance goal were measured using adapted items from learning goal constructs (Hellgren, & Lindberg, 2017). Five items of intrinsic motivation and seven items of extrinsic motivation were measured using adapted items from motivated strat- egies for learning (Nielsen, 2018). Moreover, seven items of identified motivation were measured and adapted from the autonomous motivation subscale, and the original item is ‘four items’ (Maulana et al., 2016). Five items of self-efficacy were also measured using a
subscale of science motivation for adolescents (Schumm & Bogner, 2016), and the respons- es were used on a 5-point scale ranging from 1 = not at all like me to 5 = very much like me. Five items of the anxiety scale were measured using the adapted items from the PISA 2015 field trial, and the responses were used on a 4-point scale ranging from 1 = strongly disagree me to 4 = strongly agree. A student with a higher score had a higher factor in every component in the CMSQ. The result of the CMSQ will generate ordinal data, and the data were analysed as if interval data based on procedure and recommendation by Glynn et al. (2011) and Wu & Leung (2017).
Data Analysis
The results from data collection in this questionnaire will be analysed using the Sta- tistical Package for the Social Sciences (SPSS) version 22 and the Analysis of Moment Structure (AMOS) version 24. Primarily, this study applied data screening to check missing data and to exclude outliers using the Mahalanobis distance. In the initial data, we found 51 outliers out of 811 students, and 760 students were analysed. Three (0.39%) students had missing values in answering one item in extrinsic motivation and one item in performance goal. This study replaced data using mean nearby points to deal with the missing values. Descriptive statistics and zero-order correlations were calcu- lated for seven factors. EFA was used to analyse the questionnaire responses using the SPSS version 22. We used the maximum likelihood for the extraction method and the Promax rotation because after running EFA, we will apply CFA to check the model fit in the measurement model in the AMOS version 24. The Kaiser-Meyer-Olkin (KMO) analysis and the Bartlett sphericity check were tested for an examination of our sample appropriateness to run factor analysis using EFA (Kaiser, 1970). Very high (r > 0.9) and very low (r < 0.3) correlation matrices were checked. After the first analysis, three items from extrinsic motivation and one item from identified motivation were excluded due to having low loadings and high cross-loadings. Subsequently, factor analysis was applied again. We also reran the KMO test and calculated Cronbach’s alpha to determine internal consistency for the remaining 34 items and for each subscale. The Kaiser–Guttman test was used to determine the number of extract variables using the own value of a variable higher than one (Kaiser, 1960). In our analysis and in the communities, the number of variables suggests that this criterion should provide a precise solution (Stevens, 2009).
After finishing EFA and internal consistency using Cronbach’s alpha to check reliabi- lity to draw the measurement model, CFA was employed using a pattern matrix builder plugin in the AMOS (Gaskin & Lim, 2016). In CFA, we checked the factor loading of each item to constructs, model fit indices, reliability using CR, and construct validity. We also calculated the multi-group analysis or invariance across gender to check whether the measurement model measures the same factors across gender. For specific gender difference analysis, we ran a t-test for the independent sample with a corresponding 95%
confidence interval and an effect size to measure the power of differences using Cohen’s d.
The mean comparison was used for every factor using a bar chart and a standard error with gender as differentiated components.
Results and Discussion
Common Method Bias (CMB)
This study employed Harman’s single factor test analysis using the SPSS version 22 to ensure CMB and to determine whether a single variable appears for the greater part of the covariance between the measures using principal axis factoring with a single fac- tor to extract (Podsakoff et al., 2003). The result indicated that a single factor solution accounted for only 41.427% of the cumulative variance, and this value is less than 50%.
Therefore, CMB is not an issue in this study.
Exploratory Factor Analysis (EFA)
EFA is used in cases where the relationship between variables observed in an instru- ment is uncertain (Glynn et al., 2011). EFA must assess the responses of students to the questionnaire in this study because the CMQS is an instrument composed of seven factors based on aspects in the AGT and SCT with the Indonesian context. Findings from EFA corroborate that the means of Bartlett’s test of sphericity based on Chi-square = 28209.251, DF = 528, p < 0.001 and KMO measure of sampling adequacy, KMO = 0.942 indicating the instrument is distinct and reliable factors and presents samples having good quality for further analysis (Kaiser, 1970; Field, 2013). Using a maximum likelihood for factor analysis extraction and Promax rotation, data computation extracts seven factors with 37 items in latent factors having an absolute value of above 0.5 as the threshold (Hair et al., 2010; Kock, 2014). Some cross-loading items and low loadings from identified motivation (one item) and extrinsic motivation (three items) were excluded from the factor analysis, and the final form of the CMQS consists of 33 items (see Appendix 1).
Items in Appendix 1 (see Table 5) have loadings of above 0.5 for all latent factors;
however, three items in the mastery goal have cross-loadings of above 0.32 (Worthing- ton & Whittaker, 2006). The fixed number factor extraction is used for 7 latent factors.
The eigenvalues and the percentage of the variances of each latent factor were identified motivation (14.01, 42.46%), self-efficacy (4.23, 12.83%), extrinsic motivation (3.16, 9.58%), intrinsic motivation (2.71, 8.21%), performance goal (1.46, 4.44%), test anxiety (1.07, 3.24%) and mastery goal (0.71, 2.14%).
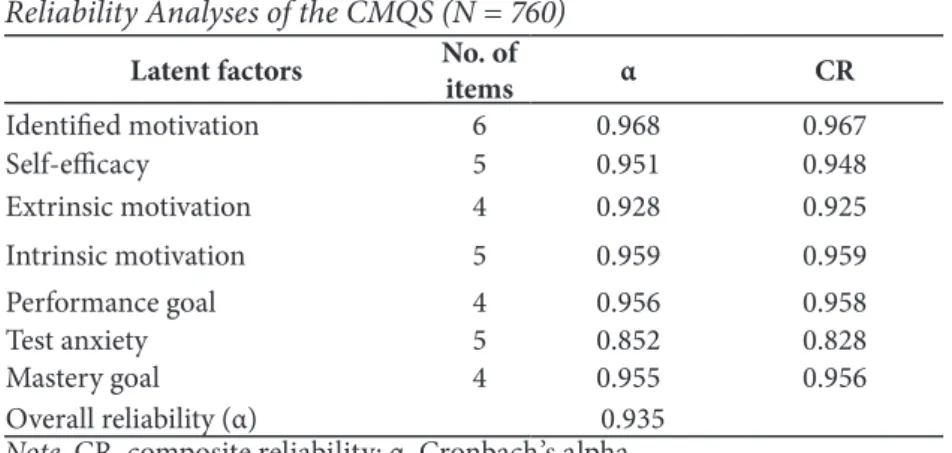
Reliability
Reliability is a measure of internal consistency in the responses of respondents across the items in questionnaires or other research instruments. Generally, all items in the research instrument are used to describe the same basic construct; hence, the scores of respondents should be correlated with one another (Wieland et al., 2017). This study used two techniques to measure the reliability, internal consistency assessed by Cron- bach’s alpha and CR. The evaluation of internal consistency reliability statistics using Cronbach’s alpha and CR was assessed in the CMQS having acceptable thresholds. The value of this threshold should be above 0.7 (Dijkstra and Henseler, 2015; Hair et al., 2019;
Streiner, 2003). The reliability of latent factors in the CMQS ranges from 0.828 to 0.967.
Table 2 shows Cronbach’s alpha and the CR values of mastery goal, performance goal, intrinsic motivation, extrinsic motivation, Identified motivation, self-efficacy, and test anxiety specifically. The overall reliability values of the CMQS show that the instrument used is highly reliable.
Table 2
Reliability Analyses of the CMQS (N = 760) Latent factors No. of
items α CR
Identified motivation 6 0.968 0.967
Self-efficacy 5 0.951 0.948
Extrinsic motivation 4 0.928 0.925
Intrinsic motivation 5 0.959 0.959
Performance goal 4 0.956 0.958
Test anxiety 5 0.852 0.828
Mastery goal 4 0.955 0.956
Overall reliability (α) 0.935
Note. CR, composite reliability; α, Cronbach’s alpha.
Construct Validity
Convergent validity
Convergent validity was used to measure the level of the correlation of multiple vari- ables in the same construct in an instrument, which means that convergent validity will be achieved if the variables in a factor are highly correlated. Achieve convergent validity, CR, factor loading and the average variance extracted (AVE) should be calculated (Ab Hamid, Sami & Sidek, 2017). Generally, the smaller the sample size, the higher the loading score required. It is best to have loading scores of more than 0.5 for each factor regardless of the sample size. The thresholds for the AVE should be above 0.5 for each composite factor, and CR should be 0.70 and above (Hair et al., 2019). However, when the AVE value
is below 0.5 and the CR is higher than 0.6, the convergent validity of the construct still meets the minimum thresholds (Fornell & Larcker, 1981; Malhotra and Dash, 2011).
The AVE and CR values were computed using master validity tools (Gaskin & Lim, 2016), and the factor loadings were computed in EFA. All the loading score values of items are more than 0.5 (See Appendix 1). For seven latent factors in the CMQS, the AVE values range from 0.497 to 0.852, and the CR value ranges from 0.828 to 0.967 (Table 2). There is a low value of AVE in anxiety (0.497), but we still can establish convergent validity and reliability from CR alone if AVE is often too strict (Malhotra & Dash, 2011).
Discriminant validity
Discriminant validity was used to determine the extent to which latent factors differ empirically from one another (Hair, Hult, Ringle, & Sarstedt, 2016). Fornell and Larcker (1981) recommended that discriminant validity is achieved when the square root of the AVE is higher than the AVE shared correlation on a particular latent factor. The square root of the AVE should be above 0.5 and greater than the inter-correlation of latent factors in the model (Hair, Black, Babin, & Anderson, 2010). Table 3 shows the validity measure- ment on the basis of the Fornell and Larcker criterion that contains the significance of correlation (p), matrix correlation between latent factors, the AVE values (in bold), the CR value, and the square root each latent factor as the diagonal part (in bold). All latent factors in the CMQS achieve the discriminant validity threshold, especially for the in- teraction between the square root of the AVE and the inter-correlation of latent factors.
Table 3
Validity Measurement Based on the Fornell–Larcker Criterion
CR AVE SMIDM SE SMEM SMIM LGPG ALATA LGMG
SMIDM 0.967 0.830 0.911
SE 0.948 0.787 −0.047 0.887
SMEM 0.925 0.756 0.325*** 0.049 0.870
SMIM 0.959 0.822 0.791*** −0.087* 0.331*** 0.907
LGPG 0.958 0.852 0.744*** −0.052 0.395*** 0.675*** 0.923
ALATA 0.828 0.497 0.105** −0.010 0.047 0.068† 0.110* 0.705
LGMG 0.956 0.845 0.834*** −0.068† 0.343*** 0.741*** 0.839*** 0.058 0.919 Note. Significance of correlations, † p < 0.100, * p < 0.050, ** p < 0.010, *** p < 0.001. SMIDM, identified motivation; SE, self-efficacy; SMEM, extrinsic motivation; SMIM, intrinsic motivation;
LGPG, performance goal; LGMG, mastery goal; ALATA; test anxiety.
This study also employed a new criterion to assess the discriminant validity using the HeteroTraitMonoTrait (HTMT). In the establishment of discriminant validity con- ceptually and differently, the threshold of HTMT values should be less than 0.9 and 0.85 (Henseler et al., 2015). The results in Table 4 explain that the CMQS is successful in
establishing discriminant validity on the basis of the HTMT0.85 criterion, in which all of the HTMT values are less than 0.85.
Table 4
Discriminant Validity Based on the HTMT0.85
SMIDM SE SMEM SMIM LGPG ALATA LGMG
SMIDM −
SE 0.048 −
SMEM 0.337 0.052 −
SMIM 0.788 0.080 0.336 −
LGPG 0.753 0.050 0.410 0.680 −
ALATA 0.072 0.022 0.052 0.051 0.105 −
LGMG 0.828 0.072 0.356 0.745 0.843 0.042 −
Note. SMIDM, identified motivation; SE, self-efficacy; SMEM, extrinsic motivation; SMIM, in- trinsic motivation; LGPG, performance goal; LGMG, mastery goal; ALATA; test anxiety.
Confirmatory Factor Analysis (CFA)
In covariance based on structural equation modelling (CB-SEM), there are two kinds of the model, namely, measurement and structural models. This study is an initial part to assess the measurement model using CFA using the AMOS version 24. CFA is employed to confirm latent factors in the measurement model that showed all latent factors operating adequately and GoF indexes achieved; thus, in the next study, researchers have more confidence for finding relationships between latent factors and constructing hypotheses in structural models (Byrne, 2001). For measurement quality according to the sugges- tion of Chuah et al. (2016), we conducted the analysis for CR, convergent validity, and discriminant validity (Table 2). We drew the CFA diagram in the measurement model using the pattern matrix builder plugin by Gaskin (2016) to assess the model fit. The CFA results validate that the model of fit was achieved in the first analysis, CMIN/DF = 3.943, p < 0.001, GFI = 0.872, AGFI = 0.848, TLI = 0.945, CFI = 0.950, RMSEA = 0.062, P close = 0.000. We analysed the report from modification indices and doing covariance with items in the same factor having values of more than 10 to generate an outstanding result and improve the model fit in CFA. The most appropriate for the modification in the measurement model is to covary error terms that are part of the same factor (Hermida, 2015). The better model fit achieved CMIN/DF = 2.720, p < 0.001, GFI = 0.812, AGFI = 0.891, TLI = 0.968, CFI = 0.972, RMSEA = 0.048, P close = 0.891 (see Figure 1). Figure 1 depicts the CFA diagram after modification indices and gives information on values for the GoF. According to cut off criteria for fit indices in covariance structure analysis by Hu and Bentler (1999), the CMQS has achieved excellent criteria in the measurement
model. The cut off criteria for fit indices for the excellent model fit are CMIN/DF > 1, CFI > 0.95, SRMR < 0.08 RMSEA < 0.06 and P close > 0.05.
Figure 1
CFA After Modification Indexes, Standardised Factor Loading and Correlation (N = 760)
Multigroup Analysis
We conducted multigroup analysis through CFA in measurement models by making two groups according to gender differences, females and males, to ensure that the measu- rement model in this study measures the same thing across gender. In other words, the instrument is not different if we measure two group levels, males and females. So, there is no bias on gender.Global test results confirm that there no significant differences exist across gender (p = 1), DF = 908, x2 unconstrained = 2094.908, x2 constrained = 2094.908.
We also recalculated the model fit for females and males. The result asserts that female and male groups meet the criteria of the GoF indexes.
Analysis of Scale Scores for CMQS Components
We compared the means of seven latent factors in the CMQS using the independent sample t-test according to gender differences to analyse the scale scores for all components in CMQS. We also checked for Cohen’s d effect size. The criterion of effect size consists of negligible (0–0.19), small (0.2–0.49), medium (0.5–0.79) and large (0.8 and above) (Cohen, 1992). According the independent sample t-test, we found the following: mas- tery goal (t(758) = 3.065, p < 0.05, Cohen’s d = 0.228), performance goal (t(758) = 2.799, p < 0.05, Cohen’s d = 0.228), test anxiety (t(758) = 1.169, p > 0.05, Cohen’s d = 0.117), self- efficacy (t(758) = −.732, p > 0.05, Cohen’s d = −0.071), identified motivation (t(758) = −.732, p > 0.05, Cohen’s d = 0.137), extrinsic motivation (t(758) = −.732, p > 0.05, Cohen’s d = 0.011) and intrinsic motivation (t(758) =2.235, p < 0.05, Cohen’s d = 0.166). From this analysis, we further found that mastery goal, performance goal and intrinsic motivation between males and females are different and have small effect sizes. Figure 2 illustrates the bar chart related to every subscale by gender differences in the CMQS.
Figure 2
Comparison of Seven Factors in the CMQS (N = 760)
Note. Error bars show 95% CI. Mean score for whole latent factors M ± SD = 3.49 ± 0.49.
According to the illustration in the form of a bar chart for all latent factors, we found some slight differences (more than 0.10) in the scale scores between males and females in the mastery goal, performance goal and intrinsic motivation components. Generally, the scale scores of the science motivation components are not different between males and females.
Conclusion
The developed instrument of the CMQS in this study is valid and reliable according to the statistical analysis. EFA shows that the means of Bartlett’s test of sphericity based on Chi-square = 28209.251, df = 528, p < 0.001 and KMO = 0.942 indicating the instrument can differ seven latent factors in the CMQS appropriately. Four items out of 37 items were excluded because of having low loadings of below 0.5. The reliability according to Cronbach’s alpha and CR was achieved, which ranged from 0.828 to 0.967. The convergent validity achieved with good criteria of all latent factors has AVE value above 0.5, except test anxiety (0.497), but the convergent validity still can be achieved because of the high value of CR (> 0.6) for all the components. There is no issue about discriminant validity because the findings validate that the CMQS meets the criteria from the Fornell–Larck- er criterion and the HTMT0.85. In CFA, the GoF index value is excellent for before and after modification indices. Multigroup analysis through CFA convinces that this model measures the same thing across gender differences indicatig the instrument has no bias in measure two group levels; males and females. For scale score analysis, small differenc- es emerge in the mastery goal, performance goal and intrinsic motivation components according to t-test and small effect sizes according to Cohen’s d criteria.
Limitations and Future Directions
Although this study provided knowledge about how to validate an instrument and how to measure the motivation component in science properly, our results have some limita- tions. First, this study merely assesses the measurement model without conducting further analysis on the relationship among latent factors. Second, this study is a cross-sectional study; hence, some disadvantages exist, including the challenges in analysing behaviour over a time period and collating samples on the basis of a variable on the studied popu- lation. Third, there is a possibility of some bias in the research although we had adopted appropriate procedures for data collection and necessary precautions.
In future studies, the researchers can conduct analysis on the structural model using covariance-based or partial least squares on structural equation modelling. Investigating test anxiety as a moderator variable in student motivation in science may be an exciting topic for future research. The results confirm that a correlation exists among latent factors in the CMQS, such as achievement goal and intrinsic motivation, but no clear model describes that interaction. Thus, modelling interaction among latent factors in the CMQS appears to be the next topic of interest for researchers.
Acknowledgement
The authors would like to appreciate the forum discussion of Doctoral School of Education at University of Szeged and the Tempus Public Foundation as a scholarship institution that supports the corresponding author degree through Stipendium Hunga- ricum Scholarship Program.
Conflict of Interest
The authors declare no potential conflict of interest in this study with respect to the authorship, research, and publication of this article.
References
Ab Hamid, M. R., Sami, W., & Sidek, M. H. (2017). Discriminant validity assessment: Use of Fornell
& Larcker criterion versus HTMT criterion. Journal of Physics: Conference Series, 890(12163).
Altun, S. (2017). The effect of cooperative learning on students’ achievement and views on the science and technology course. International Electronic Journal of Elementary Education, 7(3), 451–468.
American Educational Research Association, American Psychological Association, & National Council on Measurement in Education. (1999). Standards for Educational and Psychological Testing. Washington, DC: American Educational Research Association.
Areepattamannil, S., Freeman, J. G., & Klinger, D. A. (2011). Intrinsic motivation, extrinsic motivation, and academic achievement among Indian adolescents in Canada and India. Social Psychology of Education, 14(3), 427–439.
Bandura, A., Barbaranelli, C., Caprara, G. V., & Pastorelli, C. (2001). Self-efficacy beliefs as shapers of children’s aspirations and career trajectories. Child Development, 72(1), 187–206.
Byrne, B. M. (2001). Structural equation modeling with AMOS: Basic concepts, applications, and programming. Hillsdale, NJ: Erlbaum.
Chen, J. A., Metcalf, S. J., & Tutwiler, M. S. (2014). Motivation and beliefs about the nature of scientific knowledge within an immersive virtual ecosystems environment. Contemporary Educational Psychology, 39(2), 112–123.
Chuah, S. H. W., Rauschnabel, P. A., Krey, N., Nguyen, B., Ramayah, T. and Lade, S. (2016), Wearabletechnologies: the role of usefulness and visibility in Smartwatch adoption. Computers in Human Behavior, 65(1), 276–284.
Cohen, J. (1992). A power primer. Psychological Bulletin, 112, 155–159.
Csapó, B., & Molnár, G. (2019). Online diagnostic assessment in support of personalised teaching and learning: The eDia System. Frontiers in Psychology, 10(1), 1–14.
Deci, E. L., & Ryan, R. M. (1985). Intrinsic motivation and self-determination in human behavior.
New York: Plenum.
Deci, E. L., & Ryan, R. M. (2000). The “what” and the “why” of goal pursuits: Human needs and the self-determination of behavior. Psychological Inquiry, 11(1), 227–268.
Deci, E. L., Vallerand, R. J., Pelletier, L. G., & Ryan, R. M. (1991). Motivation and education: The selfdetermination perspective. Educational Psychologist, 26(1), 325–346.
Deci, E. L., Vallerand, R. J., Pelletier, L. G., & Ryan, R. M. (1991). Motivation and education: The self-determination perspective. Educational Psychologist, 26(3), 325–346.
Dijkstra, T.K. and Henseler, J. (2015) ‘Consistent partial least squares path modeling’, MIS Quarterly, 39(2), 297–316.
Dweck, C. S. (1986). Motivational processes affect learning. American Psychologist, 41(1), 1040–1048.
Educational Testing Service & German institute for International Educational Research. (2014).
PISA 2015 Field Trial Analysis Plan for Questionnaire Data. Paris: OECD
Faul, F., Erdfelder, E., Buchner, A., Lang, A.-G., 2009. Statistical power analyses using G*Power 3.1: tests for correlation and regression analyses. Behavior Research Methods, 41, 1149–1160.
Field, A. P. (2013). Discovering statistics using IBM SPSS statistics. London: Sage.
Fornell, C., & Larcker, D. F. (1981). Evaluating structural equation models with unobservable variables and measurement error. Journal of Marketing Research, 18(1), 39–50.
Gaskin, J. & Lim, J. (2016a), “Master validity tool”, AMOS Plugin. Gaskination’s StatWiki. http://
statwiki.gaskination.com/index.php?title=Main_Page
Gaskin, J. & Lim, J. (2016b), “Model fit measures”, AMOS Plugin. Gaskination’s StatWiki. http://
statwiki.gaskination.com/index.php?title=Main_Page
Glynn, S. M., Brickman, P., Armstrong, N., & Taasoobshirazi, G. (2011). Science motivation questionnaire II: Validation with science majors and nonscience majors. Journal of Research in Science Teaching, 48(10), 1159–1176.
Glynn, S.M., Taasoobshirazi, G., & Brickman, P. (2009). Science motivation questionnaire:
Construct validation with nonscience majors. Journal of Research in Science Teaching, 46(2), 127–146.
Hair Jr, J. F., Hult, G. T.M., Ringle, C., & Sarstedt, M. (2016). A primer on partial least squares structural equation modeling (PLS-SEM). Thousand Oaks, CA: Sage.
Hair, J., Black, W., Babin, B., & Anderson, R. (2010). Multivariate data analysis (7th ed.). Upper Saddle River, NJ: Prentice-Hall.
Hair, J. F., Risher, J. J., Sarstedt, M. and Ringle, C.M. (2019) ‘When to use and how to report the results of PLS-SEM’, European Business Review, 31(1), 2–24.
Hambleton, R. K., Merenda, P. F., & Spielberger, C. D. (Eds.). (2004). Adapting educational and psychological tests for cross-cultural assessment. Taylor & Francis: Psychology Press.
Hazrati-Viari, A., Rad, A. T., & Torabi, S. S. (2012). The effect of personality traits on academic performance: The mediating role of academic motivation. Procedia-Social and Behavioral Sciences, 32(1), 367–371.
Hellgren, J. M., & Lindberg, S. (2017). Motivating students with authentic science experiences:
changes in motivation for school science. Research in Science & Technological Education, 35(4), 409–426.
Henseler, J., Ringle, C. M. and Sarstedt, M. (2015). A new criterion for assessing discriminant validity in variance-based structural equation modeling. Journal of the Academy of Marketing Science, 43(1), 115–135.
Hidi, S., and J. M. Harackiewicz (2000). Motivating the academically unmotivated: A critical issue for the 21st century. Review of Educational Research, 70 (2), 151–179.
Ho, H.-N. J., & Liang, J.-C. (2015). The relationships among scientific epistemic beliefs, conceptions of learning science, and motivation of learning science: A study of Taiwan high school students.
International Journal of Science Education, 37(16), 2688–2707.
Hsiao-Lin Tuan, Chi-Chin Chin & Shyang-Horng Shieh (2005) The development of a questionnaire to measure students’ motivation towards science learning, International Journal of Science Education, 27(6), 639–654.
Huang, W. Y., & Wong, S. H. (2014). Cross-cultural validation. In: A.C. Michalos. (Eds.), Encyclopedia of quality of life and well-being research (pp.1369–1371). Dordrecht: Springer.
Kaiser, H. F. (1970). A second generation little jiffy. Psychometrika, 35(4), 401–415.
Kock, N. (2014). Advanced mediating effects tests, multi-group analyses, and measurement model assessments in PLS-based SEM. International Journal of e-Collaboration, 10(3), 1–13.
Kuger, S. (2016). Curriculum and learning time in international school achievement Studies. In S.
Kuger, E. Klieme, N. Jude, & D. Kaplan (Eds.), Assessing contexts of learning: An international perspective. Dordrecht: Springer.
Kusurkar, R. A., Ten Cate, T. J., Vos, C. M. P., Westers, P., & Croiset, G. (2013). How motivation affects academic performance: a structural equation modelling analysis. Advances in Health Sciences Education, 18(1), 57–69.
Lin-Siegler, X., Ahn, J. N., Chen, J., Fang, F.-F. A., & Luna-Lucero, M. (2016). Even Einstein struggled: Effects of learning about great scientists’ struggles on high school students’
motivation to learn science. Journal of Educational Psychology, 108(3), 314–328. https://doi.
org/10.1037/edu0000092
Li‐tze Hu & Peter M. Bentler (1999) Cutoff criteria for fit indexes in covariance structure analysis: Conventional criteria versus new alternatives. Structural Equation Modeling: A Multidisciplinary Journal, 6(1), 1–55.
Malhotra, N. K., & Dash, S. (2011). Marketing research: An applied orientation. London: Pearson.
Maulana, R., Helms-Lorenz, M., Irnidayanti, Y., & van de Grift, W. (2016). Autonomous motivation in the Indonesian classroom: Relationship with teacher support through the lens of self- determination theory. The Asia-Pacific Education Researcher, 25(3), 441–451.
Mayer, R. E., & Alexander, P. A. (Eds.). (2016). Handbook of research on learning and instruction.
Taylor & Francis.
Midgley, C., & Urdan, T. (2001). Academic self-handicapping and achievement goals: A further examination. Contemporary Educational Psychology, 26(1), 61–75.
National Academy of Sciences (2010). Expanding underrepresented minority participation:
America’s science and technology talent at the crossroads. Washington, DC: National Academies Press.
Nicholls, J. G. (1984). Achievement motivation: Conceptions of ability, subjective experience, task choice, and performance. Psychological Review, 91(1), 328–346.
Nielsen, T. (2018). The intrinsic and extrinsic motivation subscales of the motivated strategies for learning questionnaire: A rasch-based construct validity study. Cogent Education, 5(1), 1–19.
Niemiec, C. P., & Ryan, R. M. (2009). Autonomy, competence, and relatedness in the classroom:
Applying self-determination theory to educational practice. Theory and Research in Education, 7(1), 133–144.
Olatoye, R. A., & Afuwape, M. O. (2003). Test anxiety as a determinant of examination misdemeanor among some Nigerian secondary school students. Ibadan Journal of Educational Studies, 3(182), 32–39.
Organisation for Economic Cooperation and Development. (2019). PISA 2018 Results (Volume I):
What students know and can do, PISA, OECD Publishing, Paris
Organisation for Economic Cooperation and Development. (2007). Assessing scientific, reading and mathematical literacy: A framework for PISA 2006. http://www.oecd.org/
dataoecd/63/35/37464175.pdf.
Osterlind, S. J. (2006). Modern measurement: Theory, principles, and applications of mental appraisal. Upper Saddle, NJ: Pearson.
Pajares, F. (2002). Gender and perceived self-efficacy in self-regulated learning. Theory Into Practice, 41(2), 116–125.
Pintrich, P. R. (2000a). An achievement goal theory perspective on issues in motivation terminology, theory, and research. Contemporary Educational Psychology, 25(1), 92–104.
Podsakoff, P. M., MacKenzie, S. B., Lee, J. Y. and Podsakoff, N. P. (2003). Common method biases in behavioral research: a critical review of the literature and recommended remedies. Journal of Applied Psychology, 88(5), 879–903.
Safa, N. S., & Von Solms, R. (2016). An information security knowledge sharing model in organizations. Computers in Human Behavior, 57(1), 442–451.
Schumm, M. F., & Bogner, F. X. (2016). Measuring adolescent science motivation. International Journal of Science Education, 38(3), 434–449.
Senko, C., C. S. Hulleman, and J. M. Harackiewicz (2011). Achievement goal theory at the crossroads: old controversies, current challenges, and new directions. Educational Psychologist, 46(1), 26–47.
Senler, B. (2016). Pre-service science teachers’ self-efficacy: The role of attitude, anxiety and locus of control. Australian Journal of Education, 60(1), 26–41.
Sgoutas-Emch, S. A., Nagel, E., & Flynn, S. (2007). Correlates of performance in biological psychology: how can we help?. Journal of instructional Psychology, 34(1), 46–53.
Skaalvik, E. M., & Federici, R. A. (2016). Relations between classroom goal structures and students’
goal orientations in mathematics classes: When is a mastery goal structure adaptive?. Social Psychology of Education, 19(1), 135–150.
Stevens, J. P. (2009). Applied multivariate statistics for the social sciences. New York, NY: Routledge.
Streiner, D. L. (2003). Starting at the beginning: An introduction to coefficient alpha and internal consistency. Journal of Personality Assessment, 80(1), 99–103.
Taskinen, P. H., Schütte, K., & Prenzel, M. (2013). Adolescents’ motivation to select an academic science-related career: the role of school factors, individual interest, and science self- concept. Educational Research and Evaluation, 19(8), 717–733.
Thomas, C. R., & Gadbois, S. A. (2007). Academic self‐handicapping: The role of self‐concept clarity and students’ learning strategies. British Journal of Educational Psychology, 77(1), 101–119.
Wang, C.-L., & Liou, P.-Y. (2017). Students’ motivational beliefs in science learning, school motivational contexts, and science achievement in Taiwan. International Journal of Science Education, 39(7), 898–917.
Worthington, R. L., & Whittaker, T. A. (2006). Scale development research: A content analysis and recommendations for best practices. The Counseling Psychologist, 34(6), 806–838.
Wu, H., & Leung, S. O. (2017). Can Likert scales be treated as interval scales?—A simulation study.
Journal of Social Service Research, 43(4), 527–532. https://doi.org/10.1080/01488376.2017.1329775
Appendix 1
Table 5
Result of the Pattern Matrix from EFA for the CMQS Item
codes CMQS items Factor loading
(α) Cronbach’s alpha 0.968 0.951 0.928 0.959 0.956 0.852 0.955 SMIDM1I join in science class discussion to
obtain new knowledge. .834 −.005 −.036 .026 .015 .002 .076 SMIDM2I learn hard at school because I
know that it will be useful for my future.
.955 −.001 −.025 −.024 −.026 −.024 .011
SMIDM4I finish my science homework because I want to understand the material.
.866 .001 .000 .052 −.006 .012 .036
SMIDM5I try to answer difficult science questions because I want to know my understanding of the lesson.
.934 .007 −.002 .030 −.051 .041 .009
SMIDM6I can understand the advance level of science lessons in science learning.
.923 .007 .023 −.006 .074 .003 −.118
SMIDM7I listen carefully in the science class because I want to understand the material.
.930 −.012 .021 −.012 −.009 −.034 −.008
SE1 I am confident that I will do the
best on science exams. −.027 .854 .023 .046 −.024 .002 .014 SE2 I believe that I can obtain good
grades in science exams. −.028 .856 .022 .019 .020 −.015 −.023 SE3 I believe that I can master science
insights and skills. .035 .936 .016 −.049 −.009 −.009 .007 SE4 I believe that I understand the
whole concept in my science course.
−.015 .904 −.033 −.008 .031 .024 .000
SE5 I believe that I will do everything well in science projects or exper- iments.
.029 .910 −.023 −.002 −.022 −.003 .002
SMEM1 When I work with a task or an exam in science lessons, I do it because I do not want my teacher to get angry.
−.020 .001 .904 .034 .023 −.009 −.049
SMEM2 When I work with a task or an exam in science lessons, I do it because I want to avoid being pun- ished by my teacher.
−.004 −.004 .945 .001 .003 .008 −.014
SMEM3 When I work with a task or an exam in science lessons, I do it because I want my teacher to think that I am smart.
−.093 .001 .843 .024 −.027 .010 .074
SMEM4 When I work with a task or an exam in science lessons, I do it be- cause not finishing them is a shame.
.129 .007 .782 −.053 .021 −.014 .002
SMIM1 When I work with a task or an exam in science lessons, I do it because I want to obtain new knowledge.
.254 −.015 .005 .719 .028 .014 −.058
SMIM2 When I work with a task or an exam in science lessons, I do it because it is fun.
.112 .001 .017 .868 −.041 −.022 .021
SMIM3 When I work with a task or an exam in science lessons, I do it because I like it.
.058 .014 −.029 .849 .043 −.038 .018
SMIM4 When I work with a task or an exam in science lessons, I do it because it will be important to me.
.214 −.011 −.013 .740 −.013 .024 −.001
SMIM5 When I work with a task or an exam in science lessons, I do it because it is interesting.
.111 .011 .041 .773 .008 .020 .043
LGPG1 For me, it is important to be better than other students in science lessons.
.084 .001 −.008 .035 .817 −.012 .039
LGPG2 I will try to obtain better grades on tasks and exams than other students.
.101 −.015 −.045 .026 .883 .011 −.013
LGPG3 My goal in learning science is to be
better than other students. .155 .017 .034 .007 .818 .016 −.062 LGPG4 My goal is to avoid worse results
in science exams compared with other students.
.128 −.004 .053 −.045 .797 −.001 .030
ALATA1 I often worry that taking a science
test will be difficult for me. .029 −.025 .096 −.062 −.079 .735 .037 ALATA2 I worry that I will obtain poor
grades in science at school. .041 .020 −.063 .005 .107 .659 −.013 ALATA3 Even if I am well-prepared for a
science test, I feel considerably anxious.
−.052 .024 −.033 .098 −.030 .794 .001
ALATA4 I get very tense when I study for a
science test. −.080 −.016 .002 −.002 .021 .734 .024
ALATA5 I get nervous when I do not know how to solve a science task at school.
.067 −.002 −.006 −.059 .000 .751 −.042
LGMG4 To understand every concept in sci- ence is my main priority following science lessons.
.335 −.014 −.030 −.026 .207 −.021 .524
LGMG3 My goal is to learn science in every
meeting in the class. .169 −.016 −.004 .104 .058 .002 .632 LGMG2 I want to learn all things in science
even if the materials do not appear in exams.
.337 .025 .009 −.021 .057 .003 .658
LGMG1 Understanding science correctly is
essential to me. .335 .003 .029 −.009 .043 .012 .667
Note.. N = 760. The extraction method was maximum likelihood with an oblique (Promax with Kaiser normalization) rotation. Factor loadings above .50 are in bold. SMIDM, identified mo- tivation i; SE, self-efficacy; SMEM, extrinsic motivation; SMIM, intrinsic motivation; LGPG, performance goal; LGMG, mastery goal; ALATA; test anxiety.
Namo statyba iš „Lego“ kaladėlių: tarpkultūrinis pagrindimas, taikant sukurtą motyvacijos klausimyną (CMQS) gamtos moksluose
Soeharto Soeharto1, Benő Csapó2
1 Segedo universitetas, Edukologijos doktorantūros mokykla, Petőfi Sandor g. 32–34, H-6722, Segedas, Vengrija, soeharto.soeharto@edu.u-szeged.hu
2 Segedo universitetas, Švietimo institutas, Dugoniko skveras 13, H-6722, Segedas, Vengrija, csapo@edpsy.u-szeged.hu
Santrauka
Šiuo tyrimu siekiama atskleisti motyvacijos klausimyno (angl. CMQS) pritaikymą gamtos moksluose. Klausimynas buvo sukurtas remiantis pasiekimų tikslo, apsisprendimo ir socialinių pažinimo teorijų aspektais. Tyrime dalyvavo septyni šimtai šešiasdešimt bakalauro pakopos studentų, studijuojančių gamtos mokslus aukštosiose mokyklose. Dalyviai pildė anketas, sudarytas iš septynių latentinių veiksnių. Analizuojant duomenis buvo atlikta tiriamoji faktorinė analizė (angl. EFA), patvirtinčioji faktorinė analizė (angl. CFA), vidinis skalės nuoseklumas naudojant Cronbacho alfa koeficientą, sudėtinis patikimumas (angl. CR) ir konstrukcijos pagrįstumas. Be to, nepriklausomas t testas ir Coheno d kintamieji buvo naudojami tiriant latentinių veiksnių lyčių skirtumus.
Rezultatai patvirtina, kad motyvacijos klausimynas (angl. CMQS) gamtos moksluose yra tinkama ir patikima priemonė, leidžianti įvertinti studentų motyvaciją pritaikant atitinkamą modelį. Veiklos tikslai, meistriškumo tikslai ir vidinė motyvacija skiriasi priklausomai nuo lyties ir pasižymi nedideliu efekto poveikiu. Tikimasi, kad motyvacijos klausimynas (angl. CMQS) gamtos moksluose padės dėstytojams nustatyti veiksnius, turinčius įtakos gamtos mokslų studentų, ypač iš Indonezijos, motyvacijai.
Esminiai žodžiai: motyvacija mokytis gamtos mokslus, pagrindimas, sukonstruoti klausimy- nai, veiksnių analizė.
Gauta 2020 08 02 / Received 26 08 2020 Priimta 2021 06 14 / Accepted 14 06 2021