A Snapshot of the Ownership Network of the Budapest Stock Exchange*
Márton Gosztonyi
In this study, I use the toolkit of network research to explore the network of ownership relations of entities present on the Budapest Stock Exchange as issuers in 2020, applying static methods and exponential random graph modelling (ERGM) analysis. In the snapshot typology and simulation-based capture of the network, not only the network of relations between issuers present on the stock market is analysed, but also the ownership relations of companies connected to the network but not listed on the stock market; thus, the study addresses the ownership network associated with the stock exchange as a whole. The research results provide us with an accurate answer about the morphological characteristics of the network, the network factors determining centrality, the hierarchy of the network, and the evolution of the network with the help of simulations. The study may allow us to obtain a clearer picture of the interlinkages and clusters of companies listed on the stock market, which can be used as a basis for subsequent longitudinal analyses.
Journal of Economic Literature (JEL) codes: H54, D53, L14
Keywords: Budapest Stock Exchange, complex systems, network analysis, company ownership
1. The stock market as a complex system
The Hungarian stock market (Budapest Stock Exchange — BSE) is a concentrated market, where many products are traded at agreed prices, subject to complex economic transaction systems. In my study, I examine the ownership structure of issuers in the spot market, one of the markets of the stock market, using network research methodology. Many studies on trading in the Hungarian stock market have been conducted, but up to now the system has not been examined much from the point of view of networks affecting ownership relations. This topic is particularly important, as a given company’s share price, performance and trading itself are influenced by the ownership relations of the company, i.e. its ties with other affiliated listed and unlisted companies (Onnela et al. 2004).
* The papers in this issue contain the views of the authors which are not necessarily the same as the official views of the Magyar Nemzeti Bank.
Márton Gosztonyi is a Research Fellow at the Budapest Business School: Budapest LAB Entrepreneurship Centre. Email: gosztonyi.marton@uni-bge.hu
The Hungarian manuscript was received on 11 January 2021.
The stock market generates a large amount of non-linear information1 between numerous actors, which makes it a complex system. Accordingly, its analysis requires a methodology that can minimise and capture this complexity, while preserving the fundamental linkages. One such approach is network analysis. In fact, the correlation structure of the stock market, together with the corresponding stocks, can be considered a complex network system, which, with a finite number of nodes, forms a directed and weighted, complete graph (Lee – Djauhari 2012). This also means that network data can be used to test a multi-type relation between actors (Wasserman – Faust 2010; Taghizadeh et al. 2020). Network-based analysis of capital markets can thus bring us closer to how actors access information on events, how the network can be clustered and what internal hierarchy it is characterised by, and by introducing exponential random graph modelling (ERGM), we can gain the knowledge to explore the formation of the network, using simulations of edge numbers. In fact, at a further stage, in a longitudinal analysis, this can be used to analyse which nodes have what impact on the evolution of cluster groups, or even on the stock market performance of issuing entities, and how the reaction of each actor to events affects the dynamics of the complex system.
The network-based approach to stock markets is not a novelty methodology.
However, most of the academic literature focuses on trading on the stock market;
thus, in general, this method is used to explore the behaviour of shares traded on the market, i.e. the relation between shares. Network researchers usually follow two network methodologies: (1) they perform their analysis based on the correlations between the logarithms of stock returns (Lee – Djauhari 2012), and (2) they analyse the sales network of stocks, using the minimum spanning tree (MST) method (Lee – Djauhari 2012; Mantegna 1999; Boginski et al. 2005). Such analyses have explored trading on the stock markets in a number of countries around the world; to highlight only the most important ones, the works of Boginski et al. (2006) and Roy and Sarkar (2011) have examined the US stock market, following the above methodology. In Korea, Kim et al. (2007) carried out this analysis, Huang et al. (2009) wrote about the Chinese stock exchange, Pan and Sinha (2007) performed an analysis for India, and finally, Tabak et al. (2009) analysed the Brazilian stock market, applying the above methods. Several studies have also addressed the network-based exploration of stock market trading in foreign exchange markets, using daily scales (Forbes – Rigobon 2002) and intraday scales (Münnix et al. 2010), as well as market indices
1 Data organised in a non-linear data structure is considered a key feature of dynamic complex systems. In these data structures, the analysis of data points — due to their holistic interconnectedness and dynamism
— follows a causality completely different from the Baconian and Cartesian cause and effect theories.
Consequently, when we examine the coupling of system data, analysis categories between the theoretically presumed linear cause and effect are blurred; non-linear cause and effect relation systems emerge, in which cause and effect categories are often interchanged, and we can discern a blurring of the boundary between the two conceptual constructs (for more on this, see Atmanspacher et al. 1992).
(Drożdż et al. 2001; McDonald et al. 2005). These studies have revealed that stock markets are structured along the lines of geographical activities.
Based on the results, a number of network topological analyses have been published. Huang et al. (2009) analysed cliques and independent actors emerging in the Chinese stock exchanges to explore the resilience of the network and found that stock markets display a topological robustness against random vertex failures, but are also fragile to intentional attacks. Having analysed the network typology of the Greek stock market, Dimitrios and Vasileios (2015) concluded that in 2007 and 2012 the Greek market was a ‘shallow’ market made up of a large number of heterogeneous components, easily affected by a few centrally positioned, big investors or companies.
Much less academic attention is focused on capturing the role of the interpersonal relation network emerging in stock markets. In this vein, however, it is worth highlighting the works of Taghizadeh et al. (2020) and Kazemilari and Djauhari (2015), who find that more centrally positioned companies have fewer mediator relations and, consequently, easier access to available resources and information, and that these factors have a strong impact on the pricing mechanism of stocks.
Even fewer articles deal with the network-based analysis of the ownership structure of listed issuers, mainly due to the difficulty of accessing the data. In this conceptual framework, the director board networks of listed companies have been the subject of most research (Mahdavi Ardekani et al. 2019; Rezaee et al. 2018; Rotundo – D’Arcangelis 2010). The relation network of directors has been used to examine the structure of the relations and the identity of the economically efficient or key actors in the given networks. Studies provide compelling evidence of a strong correlation between the quality of corporate governance and stock market performance across stock markets (Khorshidvand – Sarlak 2017; Khodami – Bazraie 2013; Babu – Kumar 2011; You et al. 2015). Examination of the network of director boards is also of crucial importance for the analysis of ownership relations, because such analyses interpret the nature of the formation and functioning of the network by drawing on theories of social capital and relational capital. In fact, board interlock relations affect the activities of organisations at many points, such as the rights and benefits of the director board, governance system, organisational structure, and quality control, all of which have an effect on the behaviour of stock markets, reflecting the results of mutual interactions between participants seeking to maximise their interests (Borgatti – Foster 2003). Peng et al. (2015) studied the relation between the interlocking directorates of Chinese companies listed on the Hong Kong Stock Exchange and stock market performance. Their findings show that board interlocks improve the stock market performance of companies. Sankowska and Siudak (2016) studied the network of directorates of large companies and corporate directors in the Polish stock market. The results showed the characteristics of the stock
market network to be identical to those of the small-world networks. Finally, Singh and Delios (2017) analysed the relation between board structure and risk-taking behaviour of emerging companies.
From this brief academic literature review it is clear that the exploration of the ownership network of listed issuers is still in its infancy even at the international level; the basic analytical focus is not on this topic. However, it may also be an explanatory factor for many of the complex, systemic movements seen in the stock market.
Thus, in my study I conduct a new network-based analysis for issuers present on the Hungarian stock exchange, seeking to answer the question of what network typology, clustering and hierarchy can be discovered in the ownership network of listed and unlisted companies and firms in December 2020. The analysis provides a comprehensive picture of the structure of the Hungarian stock exchange and the related network of companies, treating the actors as a specific, complex graph.
Exploring the network structure can help identify stock market risks, and non-linear analysis can also be of practical value, e.g. in portfolio optimisation based on it.
2. Network research and ERGM
Network analysis is based on the graph theory, in which a graph G is composed of two sets (N and E) (Paparrizos 2003). Elements N are called nodes, vertices or simply points (nodes), which are arranged in ordered or unordered pairs of elements, and are interconnected by edges, arcs or links (edges). Graph G = (N, E) is connected if there exists a path from any vertex of set N to any vertex of that set.
When analysing a graph, we determine the size of the entire graph, the size of the connected component, the degree and distribution of vertices, the clusters of the graph, which are formed on the basis of edges, and the hierarchy of the network.
It is easy to visualise a graph, where nodes are usually drawn as points or circles, while edges as directed arrows or simple lines (Dimitrios – Vasileios 2015).
Networks can always be characterised by a kind of structuring, a topological structure, according to the ordering of edges, which is measured by a number of metrics. One such metric is network density, the other is degree distribution.
When calculating the density indicator of networks, we divide the fully connected theoretical edge number by the measured number of edges. The degree distribution of nodes, which forms the clusters and hierarchy, is not uniform for empirical networks measured with real data, and theoretical graphs. In contrast to random network described by Erdős – Rényi (1960), where degree distribution follows a normal curve, for small-world networks and scale-free networks, the majority of vertices have a small degree, while a mere minority of them have an extremely
high degree distribution; their distribution deviates significantly from the normal curve. Nodes in the central positions of scale-free networks are often called hubs, which make it possible to calculate the clustering coefficient of a network, i.e.
the closely interconnected cliques and communities. Empirical investigations of networks measured with real data show that they are characterised by a higher network clustering coefficient than stochastic networks of the same size. Based on the high clustering coefficient measured on scale-free networks, a theoretical network model, known as ‘small-world’ (Watts – Strogatz 1998), and the scale- free theoretical network were developed (Barabási – Albert 1999). With these theoretical networks, it is possible to validate the measured networks, i.e. to determine to what theoretical model the network typology diverges. Clusters, however, not only help to identify the cliques in the network, but also trace out the hierarchy of the network itself. In fact, the hierarchy of a network (measured by K-core metric) can be inferred from the internal connectivity of the cluster parts (Newman et al. 2006).
However, network analysis includes not only static but also dynamic methodologies;
one such methodology — currently used by several network researchers concerned with stock markets — is the method of exponential random graph modelling, i.e.
ERGM. ERGM falls into the scope of statistical exponential network modelling. The class of exponential random graph models includes Markov random graphs of edge and dyadic independence models, and many other graph distributions (Frank and Strauss 1986). Of these, ERGM allows the joint and controlled study of the effects of network parameters. In other words, ERGMs provide an opportunity to understand in dynamic models how and why network connections are formed.
Network connections are organised into patterns, and the presence of some connections (ties) promotes the appearance of others. The ERGM analyses these endogenous effects, often referred to as ‘structural’ effects, i.e. it interprets the internal processes of the network relation system, complementing them with the exogenous effects of the network, such as the effects of attributes associated with nodes (Lusher et al. 2013). Based on the findings of Watts (1999), ERGM works with randomness and probabilistic random graph modelling. By incorporating randomness, statistical models work with expected values, from which we can draw conclusions about whether the observed data are consistent with the theoretical (anticipated) data. Markov random graphs are defined by a particular dependence structure between network ties (Robins et al. 2007); thus, during an ERGM, we estimate the presence of network edges from several predictor variables, and use model parameters to estimate its given effect, direction, and significance in the studied network (Lusher et al. 2013).
36 Study
For this reason, ERGM models network effects of interest in the formation of edges, e.g. the effect of transitive triads, the k-star effect, the effect of assortativity (homophilic, heterophilic relations), the effect of distributions, the effect of degrees and the effect of attribute variables. It also compares the models formed on the basis of the effects of these network variables with the observed network in an effort to reveal the causes of network edge formation.
To capture exponential random graphs, I use the notation and terminology prescribed by Robins et al. (2007). Each pair i and j of actor n in set N is denoted by the expression Yij, which is a network connection variable, whose value is Yij = 1 if there is a network connection from i to j, and Yij = 0 if there is no connection. We specify yij as the observed value of Yij, with Y being the matrix of all variables, while y being the matrix of observed connections, i.e. our observed network itself. Y may be directed or undirected. A configuration is the totality of nodes and the subset of connections between them. For example, a 2-star shape is a set of three nodes in which one node is connected to the other two, whereas a triangle is a set of three nodes connected to each other. The configurations are defined hierarchically in the model; thus, a triangle contains as many as three 2-stars.
The general form of (homogeneous) exponential random graph models is as follows:
Gosztonyi tanulmány:
Pr (𝐘𝐘 = 𝐲𝐲) =1
𝜅𝜅exp Σ/𝜂𝜂/𝑔𝑔/(𝐲𝐲) (1)
𝑝𝑝3(𝐺𝐺) = exp
6 789
𝛽𝛽7𝑇𝑇7(𝐺𝐺) − 𝜓𝜓(𝛽𝛽) (2)
2-es képlet alatti bekezdésben wordben 2.sorban kombinációs számot tartalmazó matematikai kifejezés:
2 >?
(1) where: (i) the summation is applied to configuration type A, whose different sets represent different models (e.g. dyadic independence or Markov random graph);
(ii) ηA is the parameter corresponding to type A configuration; (iii) gA(y) is the network statistic corresponding to configuration A (for a homogeneous Markov, this is the number of type A configurations observed in the network: e.g. the number of triangles); (iv) κ is a normalising factor ensuring that (1) is a probability distribution.
The model represents the probability distribution of a graph on a fixed set of nodes, where the probability of a graph being created depends on the presence of different configurations expressed by the model. ERGM can thus be used to interpret the structure of a typical graph as the result of a cumulation of specific and local configurations, with the parameters providing information on the presence of structural effects observed in the network data.
Based on Chatterjee and Diaconis (2013), the exponential graph formula has been revised in recent years, resulting in the following general form of the class of exponential random graph models:
Gosztonyi tanulmány:
Pr (𝐘𝐘 = 𝐲𝐲) =1
𝜅𝜅exp Σ/𝜂𝜂/𝑔𝑔/(𝐲𝐲) (1)
𝑝𝑝3(𝐺𝐺) = exp
6 789
𝛽𝛽7𝑇𝑇7(𝐺𝐺) − 𝜓𝜓(𝛽𝛽) (2)
2-es képlet alatti bekezdésben wordben 2.sorban kombinációs számot tartalmazó matematikai kifejezés:
(2)
Y = y y
The premise of the equation is that Gn is the space spanned by all simple graphs on n-labelled vertices (‘simple’ means undirected, with no loops). Thus, Gn contains 2 elements. In the equation, β = (β1, ..., βk) is a vector of real parameters, T1, T2, ..., Tk are functions on Gn, and ψ(β) is a normalising constant. Usually, Ti is taken to be the totality of various subgraphs, e.g. T1(G) = edge number in graph G, while T2(G) = the number of triangles in G. Frank and Strauss (1986) showed that when Ti is treated as edges, triangles and stars of different sizes, the resulting random graph edges form a Markov random field. Wasserman and Faust (2010) and Rinaldo et al.
(2009) developed a geometric theory of models. The statistical applications of the ERGM and the development of network analyses of practical relevance have been elaborated by Snijders et al. (2006) and Robins et al. (2007).
In my study, the network descriptive statistical and morphological analyses and the ERGM analyses were performed with the R software package and the MPNet software (Wang et al. 2009).
3. Data used for the stock market network analysis
The data used for the analysis are based on listed issuing companies on the BSE in December 2020.2 At the time of the investigation, a total of 96 different companies3 made up this base population. With the help of the OPTEN database,4 I developed the corresponding ownership network, using a code written in Python, as a result of which a complete network of 96 entities and their associated private owner companies could be analysed.5
However, it is important to point out that the list of issuers on the BSE, i.e. the base population comprises all issuers, including corporate bond issuers, mortgage bond issuers or investment unit issuers, each of which must meet different liquidity parameters or publicity criteria; consequently, it was important to clarify why I was actually managing these companies in a network, as companies issuing different shares are characterised by totally different market conditions, attitudes, commitments and approaches.
2 https://bse.hu/pages/issuers. In my analysis, I analyse all issuers listed on the stock market, irrespective of the instrument they might hold.
3 It is important to touch on the question of how much the presence of the Hungarian State may distort the sample. My study focuses on ownership linkages, so I have investigated to what extent the basic parameters of the network change if the Hungarian State is excluded from the base population. For the network test, I performed a regression based differential network analysis (R-DNA) in line with Schmidt (2019), and the test results showed that the presence of the Hungarian State does not substantially affect the basic network typology for company ownership, so I did not exclude it from the analysis. As regards the network of private individuals, for obvious reasons, no private persons were connected to the Hungarian State; hence, this issue did not arise in that network.
4 https://www.opten.hu/?lang=en
5 Given the robustness of the database and my limited access to OPTEN, a cross-sectional data capture was feasible based on the data; thus, changes in the past are not discussed in my study due to lack of data.
My goal was to conduct a network-based research that considers the stock market as a whole market, based on ownership relations.6 This is not a unique approach in the academic literature; Cont (2001) followed this methodology in his famous article on price variations in various types of financial markets. To do this, he first discussed the issue on the basis of a list of total issuers, and later, he analysed the different statistical properties of asset returns separately. Mehra and Prescott (1985) also worked with this base population in their famous longitudinal study of US regulations on share issuance, covering the 1889–1978 period. Indeed, the same modelling is also often seen when artificial neural network (ANN) modelling is used to analyse stock market exchange rates for aggregate and different share issuers (see Moghaddam et al. 2016).
With all this, of course, I would like to point out that my model — and the modellings referred to above — works with a robust model specification, which, of course, allows and requires a number of subsequent specified modellings for different share issuers. As Raddant and Kenett (2021), who also followed the same robust modelling and pattern, note in their paper, the financial system is a highly complex entity with cross-border interconnections and interdependencies; thus, robust modelling sheds (may shed) light primarily on how closely interconnected the environment is where the different markets operate, and, as a consequence, how shocks and events in the market can be easily amplified and turned into general (in their paper: global) events.
The robust modelling method allowed the analysis of two networks: (1) company ownership network of listed firms with 6,806 nodes (firms) and 8,363 edges (ownership linkages), and (2) private individual network of the same listed firms with 5,902 nodes (owners) and 6,083 edges (ownership linkages). Network data can then be regarded as complete networks or complete graphs. In my analysis, therefore, each company or private individual corresponds to a node, and a linkage from node i, pointing to node j, exists if node i has an ownership share in the case of j. Consequently, in my analysis, I work with directed graphs, following the methodological works of Garlaschelli et al. (2005), Chapelle and Szafarz (2005) and Salvemini et al. (1995).
The OPTEN database also provided a possibility to use the geospatial software ArcGIS to analyse the ownership distribution of the given networks according to the municipalities in Hungary for companies and private individuals.
6 However, here again I consider it important to emphasise the limits of my research results in terms of interpretation. I do not undertake, for example, to make findings on trade and ownership relations themselves; my aim is to explore ownership relations on a network basis, which could, of course, later be a source of a number of further research opportunities.
4. The ownership network of the Budapest Stock Exchange from the companies’ perspective
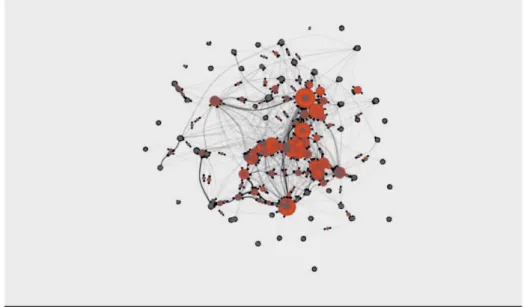
Companies that are issuers in the Hungarian stock market and the overall network of firms owned by them consist of a total of 6,806 nodes and 8,363 edges, the network representation of which is shown in Figure 1.
Figure 1 clearly shows the emergence of a huge network of firms around the issuers present in the BSE, which strongly determines the stock market position of the share issuing companies. A key feature of the network is that it is a fully interconnected network, and not decomposed into subnetworks, which indicates a particularly high level of network interdependence between companies and markets. In the chart, actors with a central position have been magnified by their degree, which shows that centrality positions are rather unevenly distributed in the network, where we find a very small number of actors with a very high company ownership share, and a very large number of actors who, quite the opposite, are characterised by remarkably few ownership linkages. This is illustrated in Figure 2, which shows the degree distributions of the whole graph in log-log curves and histograms.
Figure 1
Ownership network of issuers present in the Budapest Stock Exchange (N = 6,806)
From the log-log curves and histograms it can be seen that the overall degree distribution and the outdegree follow a much more uneven and centralised distribution than the indegree distribution. This is because the stock market network is characterised by a rather low density (0.0002), but a high centrality index. If we look at the centrality index and examine the network by hub and by authority, we arrive at Figure 3.
Figure 2
Degree distributions and log-log curves
Indegree
Indegree
FrequencyFrequency Frequency Frequency
1
1
0 5 10 15
2 5 10
510501005006,0005,0004,0003,0002,0001,0000 6,0005,0007,0004,0003,0002,0001,0000 6,0005,0007,0004,0003,0002,0001,0000
5,000
Outdegree Log-log figure
Histogram
Frequency 1
1 2 5 10
510501005005,000
Degree
Outdegree Degree
Frequency 1
1 2 5 10
510501005005,000
0 400 800 1,200 0 400 800 1,200
At the centres of the networks constructed on the basis of centrality indicators we find companies characterised by significantly different ownership relations, compared to other nodes. For companies in a central position, these overarching ties result in (1) an appropriate communication and business space, and (2) a monopoly over information. In addition, companies in the central tiers communicate with fewer intermediaries, which gives them relatively fast access to data. However, there are differences in the number of central actors in relation to hub and authority networks. Both centrality indicators were created on the basis of the eigenvector centrality, but while in the case of the hub, the index indicates which central actors are connected to many other well-positioned central actors, the authority indicator shows which actors, although not in a central position, are owned by a very large number of central actors. It is clear from this that, while well-positioned firms among listed and unlisted firms have relatively little contact with each other, each well-positioned firm is surrounded by a fairly broadly owned network of firms.
This brings us straight on to the identification of the subgroups of network clusters;
however, due to the large number of elements, from this point on I will not make the whole network the object of analysis, but only the subnetwork of 845 nodes capturing the central core of the network. Once the analysis is narrowed down to this subgraph, the characteristics of the network can be more accurately captured.
Using hierarchical cluster analysis to analyse this subgraph, we arrive at Figure 4.
Figure 3
Centrality — hub and authority (N = 6 806)
Hub network Authority network
The density of the network has increased accordingly (0.031), compared to the overall network density, and the subnetwork is clearly decomposed into 14 clusters. Given the studies on hub and authority, this high clustering coefficient is not surprising. These 14 cliques actually make up a set of companies engaged in different economic activities; one in the banking financial field, another in real estate business, still another cluster in asset management, and the area of communications is also represented. The typology of clusters is shown in Table 1.
Figure 4
Subnetwork on the basis of hierarchical clustering (N = 845)
Table 1
Network cluster typology
Cluster Name of cluster Main actors Node Per cent
1 Banks 1 OTP, MKB, K&H, CIB 165 19.5
2 Lending, Real estate Fund Finance, K 85,
GRABOPLAST 138 16.3
3 Asset management OPUS GLOBAL 107 12.7
4 Banks 2 Erste 90 10.7
5 Banks 3 Gránit, MFB, Budapest Bank,
Export-Import Bank 71 8.4
6 Former socialist system large
enterprises Magyar Posta, MÁV, T-MOBIL,
Airport 48 5.7
7 Communications firms Vodafone, GIRO, Magyar Telekom, M Factory
Kommunikáció, NISZ 47 5.6
8 Stock market, Asset management, Electricity
Budapest Stock Exchange, MAVIR Magyar Villamosenergia, Hungarian Mint Ltd.,
OVERDOSE Vagyonkezelő
38 4.5
9 Informatics, Former socialist system large enterprises 2
IQSYS Informatika, RÁBA,
VOLÁN 33 3.9
10 Banks 4 Raiffeisen, UniCredit 31 3.7
11 Banks 5 Citibank, Takszöv, Exporthitel 22 2.6
12 Former socialist system large
enterprises 3 MOL 21 2.5
13 Asset management i-Vent Vagyonkezelő, PrimoInvest Kft,
CFG PARALEL 18 2.1
14 Agriculture Bonafarm 16 1.9
TOTAL: 845 100
At first glance, we get a really interesting network cluster typology. This is because cluster typology has been constructed by the distance between the edges, i.e.
a network-based inclusion of the ownership aspect has shed new light on those trading.7 The table reveals that banks form various clusters in accordance with ownership aspects. In fact, they can be divided into 5 distinct clusters, with quite different central positions. It is also worth noting the close clustering of companies that were state-owned large enterprises under the socialist system (RÁBA, VOLÁN;
or Magyar Posta, MÁV). The clusters show a strong predominance of clusters engaged in financial activities, real estate business or wealth trade. Furthermore, it can be concluded that the presence of clusters producing a specific product is relatively low. In fact, the table reveals that there are three major clusters in the
7 In this case, of course, not only entities that are issuers are included in the analysis, but also companies whose products are not admitted to the stock market. It is precisely for this reason that cluster typology attempts to typologise the network of firms surrounding the issuers of the stock exchange.
ownership network: the first one mainly consisting of banks (OTP, MKB, K&H, CIB), owning about 20 per cent of the total network; the second one engaged in lending and real estate business (with an ownership of 15 per cent); and the third one engaged in asset management (OPUS GLOBAL), whose ownership share is around 13 per cent. These clusters own about half (48.5 per cent) of the total network, which indicates an extraordinarily high concentration of ownership.
After identifying the clusters, it is worth reviewing the hierarchy of the network, whose circular network diagram, log-log statistics, and histogram are summarised in Figure 5.
Figure 5
Hierarchy of the network (N = 845)
Density 0.00.21.00.80.6
2 4 6 8
0.4
Density*
K-core value
Density 12520050050
2
1 5 10
10
Log-log figure
K-core value Note: * N=845 Bandwidth=0.1745.
K-core value
Not surprisingly, based on the clustering indicators of the network, a highly hierarchical network is formed by the network of company ownership. As shown in Figure 5, on the basis of the K-core value, the network can be hierarchically divided into three levels: the core, the semiperiphery and the periphery, i.e. the part where connections are dense, semidense and scattered. The central core has a closed structure and is made up of 24 companies with the strongest ownership linkages to the remaining elements of the network. These companies are listed by name in Table 4 in the Appendix. The core level has high connectivity and centralised influence across the network as a whole, and it has strong ownership linkages to semiperipheral and peripheral companies as well. In terms of the number of elements, peripheral firms constitute the largest K-core group, but these firms play a negligible role in the evolution of the overall network.
5. Validation — Or: What theoretical network does the Hungarian stock market network resemble?
Before moving on to the ownership network of private individuals, I would like to make a small digression on how similar the ownership network of the Hungarian stock market is to the theoretical networks. The validation method can be used to obtain a reference point on the structure and typology of the network. I compare the company ownership network with three theoretical networks; (1) the Erdős–
Rényi random network, (2) the small-world network, and (3) the Barabási scale-free network. The log-log diagram of the degree distribution of the theoretical networks simulated with identical node numbers is shown in Figure 6, and its main statistics are summarised in Table 2.
Figure 6
Validation and simulated networks
Frequency Frequency Frequency Frequency
1 2 5 10
51020501002005001,0002,000
1 2 5 10
51020501002005001,0002,000
1 2 5 10
1510501005005,000
1 2 5 10 1510501005005,000
Random graph
(log-log) Small-world
(log-log) Scale-free
(log-log) Stock exchange (log-log)
Degree Degree Degree Degree
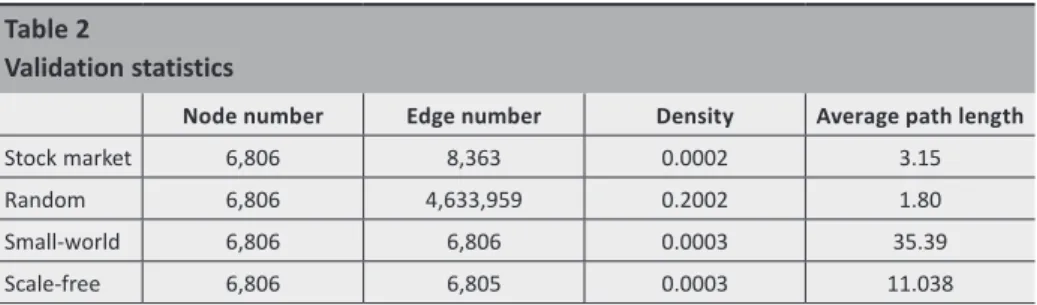
Figure 6 clearly indicates that both the stock market network and its subnetwork converge to the degree distribution of scale-free networks. After an OLS regression analysis, it can be seen that the stock market network is significantly different from the random network and the small-world network. In neither case do we obtain a significant F-value for the ANOVA test, nor is the t-value of regression significant. By contrast, the network is found to be significantly consistent with Barabási's theoretical scale-free network. Indeed, based on the OLS regression, the F-value of the ANOVA is significant (16.593), and the regression t-value (4.073) also shows a significant result. All of this means that the stock market ownership network is a scale-free network. From the statistics in Table 2, it can also be seen that theoretical and real networks are characterised by sharply different edge numbers, average path lengths and densities.
Table 2
Validation statistics
Node number Edge number Density Average path length
Stock market 6,806 8,363 0.0002 3.15
Random 6,806 4,633,959 0.2002 1.80
Small-world 6,806 6,806 0.0003 35.39
Scale-free 6,806 6,805 0.0003 11.038
It is clear that (unsurprisingly) the random network is characterised by the largest number of edges, from which the stock market network differs significantly.
However, roughly similar densities can be identified across the small-world network, the scale-free network and the stock market network. The difference between these networks lies in the average path length, as the value of the average path length is much lower in the stock market network than in either the scale-free network or the small-world network.
In summary then, the stock market network shows neither random network features nor small-world network characteristics; it mostly resembles the scale-free network, but has typically a much smaller average path length than the theoretical reference network. It follows that while the scale-free network is known for its high hierarchy, if we add to this the low average path length measured, the stock market ownership network is found to have an even higher centralisation and an even sharper hierarchy than the theoretical model, i.e. the network displays an extremely large number of nodes with extremely few connections, and very few nodes with a very high number of connections. This also means that for the actors in the central core, a faster information flow and a higher number of connections can be measured in comparison to the theoretical network.
6. The ownership network of the Budapest Stock Exchange from the perspective of private individuals
In the following, I briefly turn to the relation network of companies and private individuals trading in the stock market, which is illustrated in Figure 7.
The network of private individuals shows a much less centralised and interconnected network than what we have seen for companies. The total network consists of 5,902 nodes and 6,083 edges, with a density roughly equal to that of the company network (0.0002), but for all other metrics, it is characterised by much lower values.
This means that far more clusters (32 in number) can be identified in the network, and it is characterised by a much smaller ratio of cores (5 in number) than that shown for the company network. The hierarchy of the network is simpler, as in terms of element number, we can observe far more peripheral nodes and far fewer semiperipheral nodes. This means that the ownership network in the stock market is a much more loosely, much less tightly interconnected network when analysed in relation to private individuals, but at the same time, from a hierarchical perspective, it traces out a network that is even more centralised and that provides an even narrower range of opportunities for core actors.
Figure 7
Network and hierarchy of private owners (N = 5,902)
Network representation K-core hierarchy
7. Spatial distributions of networks
The geostatistical distributions of the networks can be used to reveal how ownerships are distributed in Hungary at the level of municipalities, and which municipalities have outstanding values. Figure 8 shows the networks of company ownership and private individual ownership in a GIS diagram with kernel distribution, projected onto the map of Hungarian municipalities.
Figure 8
Kernel distribution of networks
By company (N = 6,806)
0.000000 – 1.000000 1.000001 – 5.000000 5.000001 – 13.000000 13.000001 – 24.000000 24.000001 – 51.000000 51.000001 – 96.000000 96.000001 – 147.000000 147.000001 – 5,785.000000 Distribution by
settlement
By private individual (N = 5,902)
0.000000 – 1.000000 1.000001 – 6.000000 6.000001 – 13.000000 13.000001 – 21.000000 21.000001 – 21.000000 21.000001 – 50.000000 50.000001 – 148.000000 148.000001 – 2,387.000000 Distribution by
settlement
Figure 8 shows that the capital city plays a prominent role for both the company and the private individual networks. 65.8 per cent of the companies are registered and 38.1 per cent of private individuals live in this municipality, which reflects a particularly high concentration in Budapest. In addition, large cities and their catchment areas are home to firms, but only to a negligible proportion, compared to the capital. At the county level, for companies, the counties of Pest (7.3 per cent), Fejér (2.4 per cent), Borsod-Abaúj-Zemplén (2.4 per cent) and Hajdú-Bihar (2.4 per cent) are the counties where companies are registered; and for private individuals, Pest (17.9 per cent), Hajdú-Bihar (3.9 per cent), Borsod-Abaúj-Zemplén (3.3 per cent) and Fejér (3.3 per cent) are again the counties where the owners most live, apart from the capital. The dominance of the capital is not affected by the fact that for the company network the network includes 586 municipalities in Hungary and for the private individual network 793, as compared to Budapest, the ratio of these municipalities is completely insignificant. The same can be observed in the case of municipalities outside Hungary, where the ratios are again very low. For companies a total of only 9 different companies (0.1 per cent) and for private individuals 53 foreign municipalities (0.8 per cent) can be found in the network.
This indicates that the share of foreign-registered firms in the company-ownership and private-individual-ownership stock market networks is negligible, as both have a share of less than 1 per cent, and for both networks the capital plays a role as a priority municipality.
8. Exponential random graph modelling
At the end of my study, I present the results of the ERGM simulations performed for the whole network. The parameter estimates of the ERGM were compared with 10,000 individual Markov chain Monte Carlo (MCMC) network simulations.
MCMC simulations produced networks with the same node number and density as the observed network. From comparison with these, the MPNet software generated parameter estimates of the model, which indicate the strengths and direction of endogenous network patterns. The parameter estimates of the network are presented in Table 3. Significant parameters are marked with an asterisk (*).
A positive (negative) estimate indicates a larger (less) configuration in the network than expected, with other effects of the model taken into account. The magnitude of parameter estimates cannot be directly compared along the different effects, as the scaling of the statistics varies.
Table 3
Parameter estimates for ERGM simulations
Network effects Figures of network
effects Parameter value
(Estimate — SE)
Arc –0.041
2-star 64.617*
3-star 318.904*
4-star 781.802*
5-star 4,320.958*
Triad –1.542
4-cycle 84.170*
Isolate –1.393*
Hub (degree effect) 22.428*
Multiple 2-paths 71.058*
Transitivity (closure of transitive paths in the case of
multiple 2-paths) –1.501
Alt-edge triangle –1.243
Note: * = the parameter estimate is twice the absolute value of the standard error, which means that the effect is significant.
Based on the ERGM, the network is characterised by a negative arc effect (–0.041), but this effect is not significant. In short, pairwise interconnections do not play a dominant role in the network architecture. What plays an important role in the development of the network, though, is the affiliation to centrally positioned actors and clusters. We can see this in the network-forming power of the 2-, 3-, 4- and even 5-star shapes, which all have positive and significant values. This means that network centres play a crucial role in the development of the network, and they are surrounded by a multitude of poorly interconnected companies. The same result is also supported by the hub effect, i.e. the positive and significant effect of degree distribution (22.428).
The strong centralisation effect of the network is further supported by the negative and non-significant value of the triad effect, as this means that triple-closed connections do not materially shape the network. This is, however, contradicted slightly by the positive and significant role of quadruple-closed connections (84.170), but this can be explained by the fact that quadruple ties are formed quite often between hubs, which also points to a strong centralisation of the network.
The multiple 2-path effect is also positive and significant, indicating that in the measured network, due to the other effects of the model, there are more 2-paths than we might expect, i.e. the network is formed by a greater number of connections with central nodes that are linked to the same companies. On the other hand, the transitivity effect (transitive triad effect) is negative and non-significant, suggesting that these 2-paths do not close but condense around specific nodes.
We observe the same lack of closure between actors in the finding that we do not obtain a significant value for alternative-edge triangles either.
9. Conclusions
In my study I analysed the ownership network of Hungarian stock exchange issuers.
In an attempt to provide a complete yet robust network analysis, I have analysed not only the relation network of listed companies, but also the ownership relations that do not appear in the stock market. I looked at the network from two angles:
(1) from the companies’ perspective and (2) from the perspective of private individuals. I examined the detectable network characteristics of the Hungarian stock market by applying a methodological approach, namely network research and network simulation, which is perhaps less represented in the Hungarian academic literature, but is gaining ground in related literature abroad. However, I do not think by any means that my analysis gives a complete picture of the current situation.
I believe that, at a further stage, it would definitely be worthwhile to complement the data with longitudinal analysis, to compare and analyse network typologies in terms of different markets, and to broaden the interpretative horizon of the analysis by including additional variables and indices.
From the companies’ perspective, we can see that a huge network of firms is emerging around the issuers listed on the BSE, which strongly determines the network position of the issuing companies. Network analyses have shown that there is a high network interdependency between firms. From a clustering point of view, although the network is decomposed into several major clusters, a clique of three clusters owns about 48.5 per cent of the total network of companies. This results in a very highly hierarchised and centralised network typology. The same result is also supported by the ERGM simulation analysis, which shows that network formation is significantly influenced by network clique affiliation and ownership structure.
The network relies on a vast number of tightly interconnected and centralised network morphological shapes; thus, the morphology of two-, three-, four- and even five-star shapes has a particularly strong influence in terms of network formation, meaning that with respect to ownership, a very large proportion of firms are owned by a small number of firms. We see the same in the network-building power of the multiple 2-path-effect graph in contrast to the triad effect, which also suggests that the ownership structure is distributed between few nodes, but firms are simultaneously connected to several centrally located firms. Finally, the significance of square connection indicates that in terms of ownership, we can also measure strong cross-ownership between centrally located firms, which plays an important role in the formation of the network.
By contrast, for private individuals, we find a much more loosely interconnected network, which is, however, even more centralised than the company network. The few core actors in the hierarchy have even higher information flows and relational capital at their disposal than what is seen for firms. Furthermore, both networks are highly dominated by domestically owned firms, and within these, mostly by firms registered in the capital, Budapest.
What all of this seems to imply is that the ownership network of the Hungarian stock exchange is a scale-free network, which shares many similarities with the networks of the ‘shallow’ Greek and the topologically robust Chinese stock markets. In Hungary as well, the structure of ownership relations of the entities present as issuers in the Budapest Stock Exchange is characterised by a large number of heterogeneous components, which can easily be affected by a few centrally positioned actors or companies. It is also clearly evident that these ownership linkages go far beyond a single issuance market, showing a strong interconnectedness across markets. This is evidenced by both static and dynamic analyses. However — as the Chinese and Greek examples have shown — this also implies that the Hungarian stock market network is characterised by a typology that is fragile and not very resilient to environmental changes. In fact, from a network perspective, the academic literature agrees that on the one hand such highly centralised robust graphs can provide a very fast flow of information to network members, but on the other hand they may limit the appearance and success of new entrants in the system, and in the event of shocks, if centrally positioned actors do not react appropriately, the network can easily become vulnerable.
References
Atmanspacher, H. – Kurths, J. – Scheingraber, H. – Wackerbauer, R. – Witt, A. (1992):
Complexity and meaning in nonlinear dynamical systems. Open Systems & Information Dynamics, 1(2): 269–289. https://doi.org/10.1007/BF02228949
Babu, R.R. – Kumar, S.U. (2003): Network Approach to Capture Co-movements of Global Stock Returns. Indian Institute of Management Calcutta, Working Paper, WPS. 676: 12–44.
Barabási, A.L. – Albert, R. (1999): Emergence of Scaling in Random Networks. Science, 286(5439): 509–512. https://doi.org/10.1126/science.286.5439.509 Borgatti, S.P. – Foster, P.C. (2003): The Network Paradigm in Organizational Research:
A Review and Typology. Journal of Management, 29(6): 991–1013. https://doi.
org/10.1016/S0149-2063(03)00087-4
Boginski, V. – Butenko, S. – Pardalos, P.M. (2005): Statistical analysis of financial networks. Computational statistics & data analysis, 48(2): 431–443. https://doi.
org/10.1016/j.csda.2004.02.004
Boginski, V. – Butenko, S. – Pardalos, P.M. (2006): Mining market data: A network approach. Computers & Operations Research, 33(11): 3171–3184. https://doi.
org/10.1016/j.cor.2005.01.027
Cont, R. (2001): Empirical properties of asset returns: stylized facts and statistical issues.
Quantitative Finance, 1(2): 223–236. https://doi.org/10.1080/713665670
Chatterjee, S. – Diaconis, P. (2013): Estimating and understanding exponential random graph models. The Annals of Statistics, 41(5): 2428–2461. https://doi.org/10.1214/13-AOS1155 Chapelle, A. – Szafarz, A. (2005): Control consolidation with a threshold: an algorithm. IMA Journal of Management Mathematics, 18(3): 235–243. https://doi.org/10.1093/imaman/
dpl016
Dimitrios, K. – Vasileios, O. (2015): A Network Analysis of the Greek Stock Market. Procedia Economics and Finance, 33: 340–349. https://doi.org/10.1016/S2212-5671(15)01718-9 Drożdż, S. – Grümmer, F. – Ruf, F. – Speth, J. (2001): Towards identifying the world stock
market cross-correlations: DAX versus Dow Jones. Physica A: Statistical Mechanics and its Applications, 294(1–2): 226–234. https://doi.org/10.1016/S0378-4371(01)00119-4 Erdős, P. – Rényi, A. (1960): On the Evolution of Random Graphs. Publication of Mathematical
Institute of the Hungarian Academy Sciences, 5(1): 17–60.
Frank, O. – Strauss, D. (1986): Markov Graphs. Journal of the American Statistical Association, 81: 832–842. https://doi.org/10.1080/01621459.1986.10478342
Forbes, K.J. – Rigobon, R. (2002): No Contagion, Only Interdependence: Measuring Stock Market Comovements. The Journal of Finance, 57(5): 2223–2261. https://doi.
org/10.1111/0022-1082.00494
Garlaschelli, D. – Den Hollander, F. – Roccaverde, A. (2016): Ensemble nonequivalence in random graphs with modular structure. Journal of Physics A: Mathematical and Theoretical, 50(1), 015001. https://doi.org/10.1088/1751-8113/50/1/015001
Huang, W.Q. – Zhuang, X.T. – Yao, S. (2009): A network analysis of the Chinese stock market. Physica A: Statistical Mechanics and its Applications, 388(14): 2956–2964. https://
doi.org/10.1016/j.physa.2009.03.028
Kazemilari, M. – Djauhari, M.A. (2015): Correlation network analysis for multi-dimensional data in stocks market. Physica A: Statistical Mechanics and its Applications, 429(1): 62–75.
https://doi.org/10.1016/j.physa.2015.02.052
Khodami, P.A. – Bazraie, Y. (2013): Investigation on the Relationship between Product Market Competition with Board Structure and Disclosure Quality. Journal of Accounting Knowledge, 4(14): 51–66.
Khorshidvand, F. – Sarlak, A. (2017): Examining the Relationship between Corporate Governance and the Corporate Performance Valuation. Advances in Mathematical Finance and Applications, 2(3): 29–39. https://doi.org/10.22034/AMFA.2017.533097
Kim, K. – Kim, S.Y. – Ha, D.H. (2007): Characteristics of networks in financial markets. Computer physics communications, 177(1–2): 184–185. https://doi.org/10.1016/j.cpc.2007.02.037 Lee, G.S. – Djauhari, M.A. (2012): Stock Networks Analysis in Kuala Lumpur Stock Exchange. Malaysian Journal of Fundamental and Applied Sciences, 8(2): 45–61. https://
doi.org/10.11113/mjfas.v8n2.124
Lusher, D. – Koskinen, J. – Robins, G. (eds.) (2013): Exponential Random Graph Models for Social Networks: Theory, Methods, and Applications (Vol. 35). Cambridge University Press.
https://doi.org/10.1017/CBO9780511894701
Mahdavi Ardekani, A. – Distinguin, I. – Tarazi, A. (2019): Interbank Network Characteristics, Monetary Policy ‘News’ and Sensitivity of Bank Stock Returns. Monetary Policy ‘News’ and Sensitivity of Bank Stock Return. https://doi.org/10.2139/ssrn.3520689
Mantegna, R.N. (1999): Hierarchical structure in financial markets. The European Physical Journal B – Condensed Matter and Complex Systems, 11(1): 193–197. https://doi.
org/10.1007/s100510050929
McDonald, M. – Suleman, O. – Williams, S. – Howison, S. – Johnson, N.F. (2005): Detecting a currency’s dominance or dependence using foreign exchange network trees. Physical Review, 72(4): 106–121. https://doi.org/10.1103/PhysRevE.72.046106
Mehra, R. – Prescott, E.C. (1985): The equity premium: A puzzle. Journal of Monetary Economics, 15(2): 145–161. https://doi.org/10.1016/0304-3932(85)90061-3
Moghaddam, A.H. – Moghaddam, M.H. – Esfandyari, M. (2016): Stock market index prediction using artificial neural network. Journal of Economics, Finance and Administrative Science, 21(41): 89–93. https://doi.org/10.1016/j.jefas.2016.07.002
Münnix, M.C. – Schäfer, R. – Guhr, T. (2010): Impact of the tick-size on financial returns and correlations. Physica A: Statistical Mechanics and its Applications, 389(21): 4828–4843.
https://doi.org/10.1016/j.physa.2010.06.037
Newman, M. – Barabasi, A.L. – Watts, D.J. (2006): The Structure And Dynamics of Networks.
Princeton Studies in Complexity. Princeton University Press, Princeton.
Onnela, J.P. – Chakraborti, A. – Kaski, K. – Kertész, J. – Kanto, A. (2003): Dynamics of market correlations: Taxonomy and portfolio analysis. Physical Review, 68(5): 56–110. https://doi.
org/10.1103/PhysRevE.68.056110
Pan, R. – Sinha, S. (2007): Collective behavior of stock price movements in an emerging market. Physical Review E, 76(4): 33–55. https://doi.org/10.1103/PhysRevE.76.046116 Paparrizos, K. (2003): Network Programming. Thessaloniki: University of Macedonia.
Peng, M.W. – Mutlu, C.C. – Sauerwald, S. – Au, K.Y. – Wang, D.Y.L. (2015): Board interlocks and corporate performance among firms listed abroad. Journal of Management History, 21(2): 257–282. https://doi.org/10.1108/JMH-08-2014-0132
Raddant, M. – Kenett, D.Y. (2021): Interconnectedness in the global financial market. Journal of International Money and Finance, 110(3): 77–91. https://doi.org/10.1016/j.
jimonfin.2020.102280
Rezaee, M.J. – Jozmaleki, M. – Valipour, M. (2018): Integrating dynamic fuzzy C-means, data envelopment analysis and artificial neural network to online prediction performance of companies in stock exchange. Physica A: Statistical Mechanics and its Applications, 489:
78–93. https://doi.org/10.1016/j.physa.2017.07.017
Rinaldo, A. – Fienberg, S.E. – Zhou, Y. (2009): On the geometry of discrete exponential families with application to exponential random graph models. Electronic Journal of Statistics, 3:
446–484. https://doi.org/10.1214/08-EJS350
Robins, G. – Snijders, T. – Wang, P. – Handcock, M. – Pattison, P. (2007): Recent developments in exponential random graph (p*) models for social networks. Social networks, 29(2):
192–215. https://doi.org/10.1016/j.socnet.2006.08.003
Rotundo, G. – D’Arcangelis, A.M. (2010): Ownership and control in shareholding networks. Journal of Economic Interaction and Coordination, 5(2): 191–219. https://doi.
org/10.1007/s11403-010-0068-4
Roy, B.R. – Sarkar, U.K. (2011): Identifying influential stock indices from global stock markets:
A social network analysis approach. Procedia Computer Science, 5: 442–449. https://doi.
org/10.1016/j.procs.2011.07.057
Salvemini, M.T. – Simeone, B. – Succi, R. (1995): A Graph-theoretic Model of Integrated Ownership in Business Groups. Università di Roma La Sapienza, Dipartimento di scienze economiche.
Sankowska, A. – Siudak, D. (2016): The small world phenomenon and assortative mixing in Polish corporate board and director networks, Physica A: Statistical Mechanics and its Applications, 443: 309–315. https://doi.org/10.1016/j.physa.2015.09.058
Schmidt, T.D. (2020): Statistical Analysis of Social Network Change. Doctoral dissertation, Portland State University. https://pdxscholar.library.pdx.edu/open_access_etds/5415/.
Downloaded: 9 October 2020.
Singh, D. – Delios, A. (2017): Corporate governance, board networks and growth in domestic and international markets: Evidence from India. Journal of World Business, 52(5): 615–627.
https://doi.org/10.1016/j.jwb.2017.02.002
Snijders, T.A.B. – Pattison, P.E. – Robins, G.L. – Handcock, M.S. (2006): New Specifications for Exponential Random Graph Models. Sociological Methodology, 36: 99–153. https://
doi.org/10.1111/j.1467-9531.2006.00176.x
Tabak, B.M. – Takami, M.Y. – Cajueiro, D.O. – Petitinga, A. (2009): Quantifying price fluctuations in the Brazilian stock market. Physica A: Statistical Mechanics and its Applications, 388(1): 59–62. https://doi.org/10.1016/j.physa.2008.09.028
Taghizadeh, R. – Nazemi, A. – Maharluieb, M.S. (2020): Network Analysis of Interpersonal Relationships in Tehran Stock Exchange. Advances in Mathematical Finance and Applications, 34(3): 54–72.
Wang, P. – Robinson, G. – Pattison, P. – Koskinen, J. (2009): MPNet: program for the simulation and estimation of exponential random graph models. Melbourne School of Psychological Sciences, The University of Melbourne.
Wasserman, S. – Faust, K. (2010): Social Network Analysis: Methods and Applications.
Structural Analysis in the Social Sciences, 2nd ed., Cambridge Univ. Press, Cambridge.
Watts, D.J. – Strogatz, S.H. (1998): Collective dynamics of “small-world”
networks. Nature, 393(6684): 440–442. https://doi.org/10.1038/30918
Watts, D.J. (1999): Networks, Dynamics, and the Small-World Phenomenon. American Journal of Sociology, 105(2): 493–527. https://doi.org/10.1086/210318
You, T. – Fiedor, P. – Hołda, A. (2015): Network Analysis of the Shanghai Stock Exchange Based on Partial Mutual Information. Journal of Risk and Financial Management, 8(2):
266–284. https://doi.org/10.3390/jrfm8020266
Appendix
Table 4
List of companies with a place in the core
Name Degree Outdegree Indegree K-core
value Cluster number
OPUS GLOBAL Plc. 86 8 78 8 1
Appeninn Vagyonkezelő Holding Plc. 106 5 101 8 1
4iG Plc. 96 3 93 8 1
OTP Bank Plc. 275 14 261 8 2
MKB Bank Plc. 170 12 158 8 2
Kereskedelmi és Hitelbank Ltd. 11 11 0 8 2
OTP Ingatlanlízing Ltd. 8 8 0 8 2
OTP Jelzálogbank Ltd. 99 6 93 8 2
OTP Alapkezelő Ltd. 76 4 72 8 2
OTP Ingatlan Befektetési Alapkezelő Ltd. 98 3 95 8 2
CIG Pannónia Életbiztosító Plc. 43 3 40 8 3
MKB-Pannónia Alapkezelő Ltd. 66 3 63 8 3
Richter Gedeon Plc. 62 2 60 8 4
Citibank Ltd. 12 12 0 8 5
MTB Magyar Takarékszövetkezeti Bank Ltd. 10 10 0 8 5
Magyar Exporthitel Biztosító Ltd. 9 9 0 8 5
Takarék Jelzálogbank Plc. 44 5 39 8 5
Raiffeisen Bank Ltd. 11 11 0 8 7
GRÁNIT Bank Ltd. 12 12 0 8 9
MFB Magyar Fejlesztési Bank Ltd. 142 11 131 8 9
BUDAPEST Hitel- és Fejlesztési Bank Ltd. 9 9 0 8 9
Magyar Export-Import Bank Ltd. 68 7 61 8 9
Erste Bank Hungary Ltd. 145 9 136 8 10
MOL Magyar Olaj- és Gázipari Plc. 95 7 88 8 12