The application of network theory in official statistics*
ÁRON KINCSES Deputy President
Hungarian Central Statistical Office, Hungary
Email: Aron.Kincses@ksh.hu
JUDIT SZIGETI
Senior Chief Councillor
Hungarian Central Statistical Office, Hungary
Email: Judit.Szigeti@ksh.hu
The challenges faced by official statistics in the 21st century are manifold. We are surrounded by systems that are becoming substantially more complex. The emergence of new phenomena, such as globalisation, digitalisation, has increased the complexity of the reality that needs to be meaning- fully and timeously captured by official statistics; it has resulted in the development of new pat- terns, routes, and types of data, giving us the opportunity to further improve the relevance of statis- tics. In response to these trends, we need to find new tools and methods for the measurement of these dynamic phenomena. Network theory is an innovative approach that can help us handle the complexity of the 21st century. However, so far it has not featured in mainstream official statistics.
KEYWORDS: network theory, official statistics, globalization
I
n the globalized world, various activities (internet, business, migration, etc.) are arranged into networks, and the different phenomena, which could be observed, take place through these skeletons. We should move forward from traditional thinking and traditional distributions. The meaning of ‘average’ has lost its importance gradu- ally, there aren’t average companies, migration countries (just tiny or arbitrarily large ones). We should focus on hubs and networks behind the numbers, if we wish to understand the globalized issues. The complex systems and their collective behaviour cannot be recognized soundly just from the knowledge of the system’s components.The global perspective is crucial to gain understanding of the full picture.
* This paper was supported by the János Bólyai Scholarship of the Hungarian Academy of Science.
1. Introduction
Figure 1 indicates the frequency of use of the words ‘EU’, ‘statistics’, and ‘network’ in books published since 1800; it reveals a rise in public awareness of networks over the decades.
Figure 1. The rise of networks
Source: The figure was generated through Google’s Ngram platform (https://en.wikipedia.org/wiki/
Google_Ngram_Viewer).
Interest in network analysis has spiked for a very simple reason: the 21st century re- quires new, timely, and useable tools and methods that are capable of capturing the essence of new phenomena and complex realities in a simple fashion. Network theory can fulfil this role (Vante [1995]).
In order to gain understanding of a complex system (Lawyer [2015]), we first need to know the ways in which its components interact with one another. A net- work is a catalogue of a system’s components, often called nodes, and the direct interactions, or links, between them. This network representation offers a common language for the study of systems that may differ greatly in nature, appearance, or scope (Barabási [2009]). The way in which we define the links between two indi- viduals will determine the nature of the questions we can explore (Newman [2010]). For instance, social networks reveal the spread of knowledge, news, or behaviours. Communication networks, which describe the interactions between communication devices, are at the centre of the modern communication system. In the networks owned by business enterprises, the aim is to support the informational
and operational requirements of the business, such as issues related to sales or manu- facturing (Lewis [2001]). The variety of relationships within MNEs (multinational enterprises), and that between parent companies and affiliates underpins the importance of dynamic capabilities in the global market. These systems are collectively called complex systems, and they capture the fact that it is difficult to derive collective behav- iour just by knowing about the system’s components (Barabási [2016]).
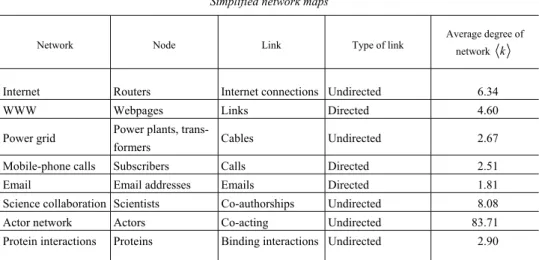
Table 1 Simplified network maps
Network Node Link Type of link Average degree of network k
Internet Routers Internet connections Undirected 6.34
WWW Webpages Links Directed 4.60
Power grid Power plants, trans-
formers Cables Undirected 2.67
Mobile-phone calls Subscribers Calls Directed 2.51
Email Email addresses Emails Directed 1.81
Science collaboration Scientists Co-authorships Undirected 8.08
Actor network Actors Co-acting Undirected 83.71
Protein interactions Proteins Binding interactions Undirected 2.90
Note. Some systems, such as those based on phone calls, have directed links, wherein one person calls the other. Other systems, such as transmission lines in the power grid, have undirected links, wherein the electric current can flow in both directions.
Source: http://networksciencebook.com/
2. The nature of networks
The degree of a node represents the number of links it has to other nodes. The de- gree distribution (pk) has a central role in network theory. The reason is that the pre- cise functional form of pk determines many network phenomena, ranging from net- work robustness to its ability to evolve. The average degree of a network can be ex- pressed as:
1 * k, k k k p
where
p1pk 1 and k Nkp N (Nk is the number of degree-k nodes1).2
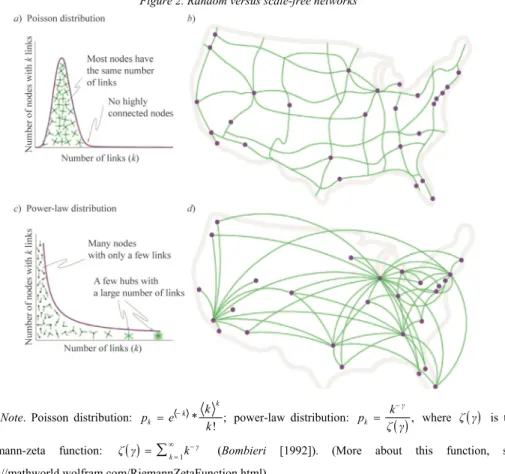
Based on the degree distribution, we can theoretically differentiate between two types of networks: random and scale-free networks (Barabási [2010]).
Figure 2. Random versus scale-free networks
Note. Poisson distribution: * ;
!
k k k
p e k k
power-law distribution:
,
γ k
p k ζ γ
where ζ γ is the
Riemann-zeta function: ζ γ k1kγ (Bombieri [1992]). (More about this function, see http://mathworld.wolfram.com/RiemannZetaFunction.html)
Source: http://networksciencebook.com/
The degrees of a random network follow the Poisson distribution, which is similar to a bell curve. Therefore, most nodes have similar number of degrees and there are no
1 NkN p* k
2 Real networks are supercritical. Once the average degree exceeds k 1,a giant component should emerge that contains a finite fraction of all nodes. Hence, only when k 1 can the nodes organise them- selves into a recognisable network. For k ln ,N all components are absorbed by the giant component, resulting in a single connected network.
nodes with a large number of links. The model suggests that the network should be described as purely random; it looks somewhat like the national highway network, in which the nodes are cities and the links are major highways. There are no cities con- nected to hundreds of highways, and there is no city that is disconnected from the highway system (Barabási [2016]).
In a network with power-law degree distribution, most nodes have only a few links. These numerous small nodes are held together by a few highly connected hubs (Shah–Zaman [2011]). A scale-free network looks like the air-traffic network, where the nodes are airports and the links are the direct flights between them. Most airports are tiny, with only a few flights. In this network, however, we can reach most desti- nations via single hubs, such as Chicago. Airlines deliberately build hubs to decrease the number of transfers between two airports. Hubs have the ‘small-world nature’.
The distances in a scale-free network seem smaller than the distances observed in a similar, but randomly arranged network. These networks are characterised by the small-world phenomenon; thus, the distance between two randomly chosen nodes in a network is short and we are always close to hubs. The presence of hubs fundamen- tally changes the system’s behaviour (Barabási [2016], Battiston–Nicosia–
Latora [2017]).
The key difference between random and scale-free networks is rooted in the dif- ferent shapes of the Poisson and power-law function; random networks have a scale.
In other words, nodes in a random network have comparable degrees, and its average degree 〈k〉 serves as its ‘scale’. Scale-free networks lack a scale; because their aver- age degree does not convey much information, we do not know what to expect when we randomly choose a node. The selected node’s degree could be tiny or arbitrarily large. Hence, instead of having a meaningful internal scale, such networks are ‘scale- free’ (Barabási [2016]). The presence of hubs and the small-world phenomenon are universal characteristics of the scale-free network.
However, not all networks are scale-free; in fact, several important networks do not share these features. The networks that appear in materials science describe the bonds between the atoms in crystalline or amorphous materials. In these networks, each node has exactly the same degree, as determined by the laws of chemistry.
A carbon atom can share only four electrons with other atoms; regardless of how we arrange these atoms relative to each other, a node in the resulting network can never have more than four links. So, the diamond and graphite networks do not constitute a scale-free phenomenon (Barabási [2016]).
Thus, the main question is: what causes the development of scale-free networks?
Network growth and preferential3 attachment are jointly responsible for the scale- free feature (Barabási [2009], Cardillo et al. [2013], Kryven [2016]).
3 The likelihood of connecting to a node depends on k that the node’s degree.
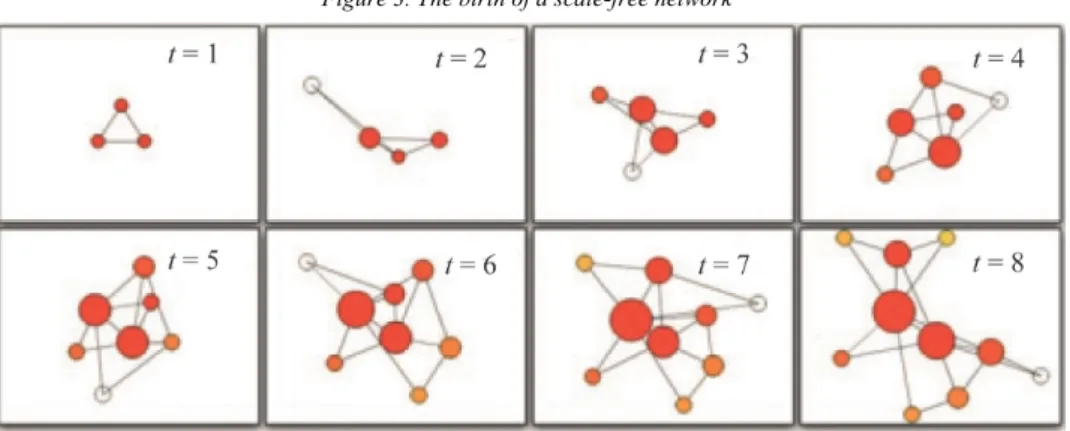
The following is the simplest process that can produce a scale-free topology.
Starting with the three connected nodes (top left), a new node (shown as an empty circle) is added to the network in each subsequent image. When deciding to link, new nodes prefer attaching to the more connected nodes – a process known as preferential attachment. Thanks to network growth and preferential attachment, a rich-gets-richer process is observed, meaning that highly connected nodes acquire more links than those that are less connected; this naturally leads to the emergence of a few highly connected hubs. The node size, which is proportional to the node’s degree, illustrates the natural emergence of hubs as the largest nodes. The degree distribution of the resulting network follows the power law (Barabási [2016]).
Figure 3. The birth of a scale-free network
Source: http://science.sciencemag.org/content/325/5939/412/F1
3. Networks in statistics and their usability
Official statistics offer a new field to which the results of network theory can be applied. Network analysis offers us the opportunity to better understand the process- es of globalisation by going beyond the figures, besides improving the relevance and quality of official statistics. Through examples, we provide some of the most im- portant tangible outcomes of network analysis in official statistics (including usabil- ity, degree distribution, and consequence). The following networks disseminations and calculations were made with UCINET’s NetDraw software (Borgatti–Everett–
Freeman [2002]).
Table 2 Examined networks overview
Network Node Link Data
Companies’ sales Top 1,000 companies in Hungary (according to domestic sales)
Sales Data referring to yearly total sales in 2016 (more than
HUF 1 million/transaction) International migration Countries Migration UN migration database, total
migrant stock at mid-year by origin and country of destination, 2017
Table 3 Characteristics of the examined networks
Description
Network
Companies’ sales International migration4 Average geodesic distances within the network 3.8 4.1
Standard deviation 1.10 0.23
Density (matrix average) 0.0093 0.0450
Standard deviation 0.0962 0.2072
The length of a path in a network is the number of links it contains. The geodesic distance between two nodes is the length of the shortest path. The distances in these networks are relatively small.
The density of a network is the total number of existing ties divided by the total number of possible ties. The density of the examined networks is increasing over
4 The unweighted network takes movements into account above a certain threshold, as small number of in- ternational migrants between two large countries does not necessarily represents a real migration relationship.
Thus,
–
, M A B M B A
q A B
N A N B
is above a fixed threshold µ, where M X Y is the population density born in country X and living in country Y, while N X is the population of country X and
–1; 1 ,
μ μR. If q(A, B) > µ, then a migration connection from country A to country B is created, if not, there is no such relationship between the two countries. Thus, depending on the µ parameter different networks can be developed. Here, µ = 0.006 was used.
time; this shows that the connectivity is improving. In these networks, the nodes have only a few links; these numerous small nodes are held together by a few highly con- nected hubs.
Figure 4. Companies’ sales network in Hungary by NACE level 1
Note. NACE (Nomenclature des industries établies dans les Communautés européennes): Statistical Classi- fication of Economic Activities in the European Community. To ensure greater visibility, only trades above EUR 10 million are shown. A - Agriculture, forestry, and fishing; B - Mining and quarrying; C - Manufactur- ing; D - Electricity, gas, steam and air conditioning supply; E - Water supply; sewerage, waste management, and remediation activities; F - Construction; G - Wholesale and retail trade; repair of motor vehicles and motor- cycles; H - Transportation and storage; I - Accommodation and food service activities; J - Information and communication; K - Financial and insurance activities; L - Real estate activities; M - Professional, scientific and technical activities; N - Administrative and support service activities; O - Public administration and defence;
compulsory social security; P - Education; Q - Human health and social work activities; R - Arts, entertainment, and recreation; S - Other service activities.
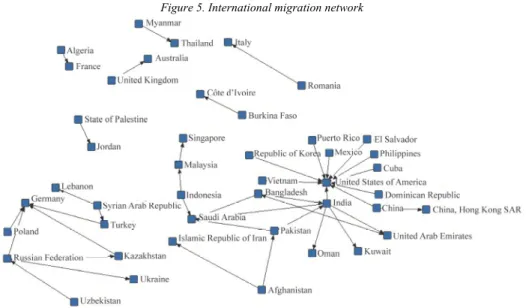
Figure 5. International migration network
Note. For ease of depiction, only migration having more than 1,000,000 migrants are shown.
Figure 6. Degree distribution of company network
Figure 7. Degree distribution of migration network
y= 89.231x–1.916 R² = 0.9417
0 20 40 60 80 100 120 140 160
1–10 11–20 21–30 31–40 41–50 51-60 61–70 71–80 81–90 91–100 101–110 111–120 121–130
Number of nodes with klinks
Number of links (k)
The examined networks mostly follow the power-law distribution. The above facts confirm that the networks of official statistics have a scale-free nature; in these cases, we also may assume that the reason for this is network growth and preferential attachment.
The analysed statistics have hubs and exhibit the small-world phenomenon.
This means that we can use the consequences and advantages of the univer- sal characteristics of scale-free models.
In the globalised world, various activities (business, migration, etc.) arrange into networks with scale-free topology, and, through these skeletons, we can observe with official statistics the different phenomena that occur.
The complex systems and their collective behaviour cannot be recognised sound- ly just from the knowledge of the system’s components. The networks neither stop at the borders of the countries, nor can they be effectively examined at country level;
they require collaboration at the EU and global levels. The global perspective is cru- cial to understand the full picture.
Networks with power-law distribution do not have a meaningful internal scale.
The observed units (the data providers) are not equally relevant. There are a few vital nodes and many trivial ones. The hubs and the small-world phenomenon allow us to better understand the processes of globalisation beyond the figures, besides im- proving the relevance and quality of official statistics. Hence:
– The presence of the LCU (large cases unit) and the European networks of LCU are essential. These units should focus on global
networks, hubs, key enterprises, MNEs, core phenomena, and the global supply chain.
– The exchange of microdata is important in general, but the largest enterprises, as well as their activity and connectivity should be the cen- tre of interest.
– Official statistics need to reorganise their own data collection work (few vital and many trivial units):
– it is necessary to rethink sample selection methods;
– it is important to foster differentiated checking aspects: more connected nodes are more important than others and we need to prioritise them in our control system;
– these actions allow us to reduce the data providers’ burden, even as more effort is directed to hubs.
4. Conclusions
Network theory is an innovative tool that reflects a new type of thinking in our changing world, and can help us handle the challenges of the 21st century.
The scale-free nature of networks has played an important role in the develop- ment of networks as a whole; this is evident in many scientific and practical interest networks. This scale-free property is an unavoidable issue in many disciplines. Once the hubs are present, they fundamentally change a system’s behaviour. The statistics of the 21st century have had scale-free features. This means that in the globalised world, various activities (business, migration, etc.) can be depicted by networks with scale-free topology, and, through these skeletal representations, we can observe the different phenomena that take place by using relevant official statistics.
We should move beyond traditional thinking and distributions. The meaning of average has gradually lost its importance because there are few average-sized com- panies (just tiny or arbitrarily large ones). If we want to increase the quality and rele- vance of statistics, we should focus on the hubs and networks behind the numbers.
Networks neither stop at the borders of the countries, nor can they be effectively examined at the country level; they require collaboration at the EU level. Given the important roles that complex systems play in our daily lives and in our economy, understanding and eventually controlling them is one of the major intellectual and scientific challenges we face in the 21st century. It is a challenge that European statis- tics cannot afford to ignore. We see much potential to develop official statistics in line with network analysis and further research at the EU level may be needed.
References
BARABÁSI,A.-L. [2009]: Scale-free networks: a decade and beyond. Science. Vol. 325. Issue 5939.
pp. 412–413. https://doi.org/10.1126/science.1173299
BARABÁSI,A.-L. [2010]: Bursts: The Hidden Patterns Behind Everything We Do. Dutton Books.
New York.
BARABÁSI,A.-L. [2016]: Network Science. Cambridge University Press. Cambridge.
BATTISTON, F.–NICOSIA,V.–LATORA,V.[2017]: The new challenges of multiplex networks:
measures and models. The European Physical Journal Special Topics. Vol. 226. No. 3.
pp. 401–416. https://doi.org/10.1140/epjst/e2016-60274-8
BOMBIERI,E.[1992]: Problems of the Millennium: The Riemann Hypothesis. Institute for Advanced Study. Princeton. https://www.claymath.org/sites/default/files/official_problem_description.pdf BORGATTI,S.P.–EVERETT,M.G.–FREEMAN,L.C. [2002]: UCINET 6 for Windows: Software for
Social Network Analysis. Analytic Technologies, Inc. Harvard. https://pages.uoregon.edu/
vburris/hc431/Ucinet_Guide.pdf
CARDILLO,A.–GÓMEZ-GARDEÑES, J.–ZANIN,M.–ROMANCE,M.–PAPO, D.– DEL POZO,F.– BOCCALETTI, S. [2013]: Emergence of network features from multiplexity. Scientific Reports.
Vol. 3. Article No. 1344. https://doi.org/10.1038/srep01344
KRYVEN,I. [2016]: Emergence of the giant weak component in directed random graphs with arbi- trary degree distributions. Physical Review E. Vol. 94. No. 1. Article No. 012315.
https://doi.org/10.1103/PhysRevE.94.012315
LAWYER, G. [2015]: Understanding the spreading power of all nodes in a network. Scientific Reports. Vol. 5. Article No. 8665. https://doi.org/10.1038/srep08665
LEWIS, L. [2001]: Managing Business and Service Networks. Kluwer Academic Publishers.
New York, Boston, Dordrecht, London, Moscow.
NEWMAN,M.E.J. [2010]: Networks: An Introduction. Oxford University Press. Oxford.
SHAH, D.–ZAMAN,T. [2011]: Rumours in a network: Who’s the culprit? IEEE Transactions on Information Theory. Vol. 57. Issue 8. pp. 5163–5187 https://doi.org/10.1109/TIT.2011.2158885 VANTE,T.W. [1995]: Network Models of the Diffusion of Innovations. Hampton Press. Cresskill.