sciences
Article
Open-Source Tools for Volume Estimation of 3D Multicellular Aggregates
Ilaria De Santis1,2 , Ervin Tasnadi3, Peter Horvath3,4, Alessandro Bevilacqua1,5 and Filippo Piccinini6,*
1 Advanced Research Center on Electronic Systems (ARCES) for Information and Communication Technologies “E. De Castro”, University of Bologna, I-40125 Bologna, Italy; i.desantis@unibo.it (I.D.S.);
alessandro.bevilacqua@unibo.it (A.B.)
2 Interdepartmental Centre “L. Galvani” for Integrated Studies of Bioinformatics, Biophysics &
Biocomplexity (CIG), University of Bologna, I-40125 Bologna, Italy
3 Synthetic and System Biology Unit, Hungarian Academy of Sciences, Biological Research Centre (BRC), H-6726 Szeged, Hungary; tasnadi.ervin@brc.mta.hu (E.T.); horvath.peter@brc.mta.hu (P.H.)
4 Institute for Molecular Medicine Finland, University of Helsinki, FI-00014 Helsinki, Finland
5 Department of Computer Science and Engineering (DISI), University of Bologna, I-40126 Bologna, Italy
6 Istituto Scientifico Romagnolo per lo Studio e la Cura dei Tumori (IRST) IRCCS, I-47014 Meldola (FC), Italy
* Correspondence: filippo.piccinini@irst.emr.it; Tel.:+39-349-500-0398
Received: 12 March 2019; Accepted: 10 April 2019; Published: 18 April 2019 Featured Application: The main goal of this work is to provide an overview of open-source tools available for researchers interested in estimating the volume of 3D multicellular aggregates (e.g., spheroids, organoids), besides introducing a new version of the Reconstruction and Visualization from Multiple Sections(ReViMS) tool (http://sourceforge.net/p/revims).
Abstract: The volume is one of the most relevant features that define the treatment of an in vivo tumour. When using cancer 3D in vitro models in pre-clinical studies, it becomes important to evaluate the macroscopic effects of drugs and radiotherapy treatments. Depending on the nature of the 3D in vitro model used, different open-source solutions can be used for measuring the volume by starting from microscope-acquired images. In this work, we introduced several open-source tools today available for estimating the volume of 3D multicellular aggregates (e.g., spheroids, organoids), also giving hints for defining the “best software” by analysing characteristics of 3D in vitro models and limits of the tools. Finally, using several cancer organoids imaged by a fluorescent microscope, we compared volume estimations obtained with different tools, besides presenting a new version of the Reconstruction and Visualization from Multiple Sections (ReViMS version 2.0) tool. This work aims to be the reference for researchers interested in estimating the volume of 3D multicellular aggregates through an open-source tool.
Keywords: oncology; microscopy; 3D in vitro models; surface rendering; volume estimation
1. Introduction
Commonly, the treatment planning of cancer patients begins with localisation of primary and secondary tumours and quantification of their volume. Depending on these and many other mass(es) parameters, cancer treatments are based on different chemotherapy, radiotherapy, immunotherapy, and chirurgical surgery procedures. Therefore, volume is one of the most relevant features for the treatment planning of an in vivo tumour. Symmetrically, it becomes important to evaluate the effects of drugs and radiotherapy treatments when using 3D in vitro models, among which multicellular
Appl. Sci.2019,9, 1616; doi:10.3390/app9081616 www.mdpi.com/journal/applsci
three-dimension (3D)-oids(e.g.,spheroids,organoids). In particular, the reduction of the number of cancer cells and thus tumour volume is a common indicator of treatment effectiveness [1].
The accuracy of the volume estimation is strongly dependent on the geometry of the in vitro model used and obtaining reliable measurements can be really challenging when using models not having the shape of a real sphere. Recently, we have classified the most common terms used for 3D multicellular in vitro models according to their geometry [2]:multicellular aggregateis the general term for 3D cell–cell aggregates free from a defined structural obligation;spheroidrefers to a multicellular aggregate having a nearly spherical shape;organoidindicates a self-renewing multicellular aggregate of irregular shape. In case oforganoidsand 3D multicellularaggregateswithout a well-defined geometrical shape in general, volume estimation based on the measurement of a diameter or perpendicular axes become really imprecise [3]. In case of aspheroid(i.e., multicellularaggregateshaving a nearly spherical shape [2]), such procedure is reliable, even if performed using a single projection acquired for instance with a standard brightfield microscope. In this scenario, several open-source tools likeTemporal Analysis of Spheroid Imaging(TASI, [4]) andReconstruction and Visualization from a Single Projection(ReViSP, [5]) are available [3]. In all the other cases, when the model shape is typically anisotropic, a 3D imaging system is needed for acquiring data of the whole 3D surface of the cellaggregate. Micro computerized axial tomography (Micro-CAT) and micro positron emission tomography (Micro-PET) systems provide data about the 3D cell organisation, but they are expensive and not available to all researchers. Furthermore, they are characterised by limited resolution, so they provide reliable measurements just in case of large cell cultures. Label-free, non-invasive optical coherence tomography (OCT) imaging platforms can be also considered to characterise the 3D morphology of multicellularaggregates[6]. However, OCT imaging platforms are not common in the biological laboratories and a very few studies report OCT-based volume assessment of 3D-oids. Accordingly, the estimation of the volume of a 3D in vitro model with a diameter below a millimetre is typically performed by using an optical fluorescence microscope able toz-analyse cellaggregatesand acquire az-stack of images by scanning the object.
Accordingly, confocal, multiphoton, and light-sheet fluorescence microscopy (LSFM) are typically applied to 3D cell cultures imaging [7].
The scientific community recently highlighted the lack of validated software tools that enable robust quantitative analysis of the large number of 3D in vitro models [8]. However, depending on the nature of the considered cellaggregate, there are a few commercial (e.g.,Imaris—Bitplane AG, Zurich, Switzerland,Amira—Visage Imaging Inc., Carlsbad, CA, USA) and open-source solutions available.
These range from aided tools to support users in manually contouring the 2D slices of the object (e.g.,Analysis of Spheroids—AnaSP[9]), to fully-automatic CAD suites embedded with 3D advanced segmentation methods (e.g., Medical Imaging Interaction Toolkit—MITK [10]). In this last category, there are also tools working at the single-cell level (e.g.,OpenSegSPIM[11]). However, the manual contouring procedure is time-consuming and prone to low repeatability (i.e., intra-rater reliability) and reproducibility (i.e., inter-rater reliability). On the other hand, automatic segmentation methods typically fail in case of blurry borders, characteristic of most fluorescent objects. Basically, today there is not a gold standard for estimating the volume of a cancer multicellularaggregate.
In this work, we compared several open-source tools today available for estimating the volume of 3D multicellularaggregates. In addition, we presented a new version of theReconstruction and Visualization from Multiple Sections(ReViMSversion 2.0) tool [12]. Besides providing functions for supporting manual annotation, we implemented: (a) a new active contouring method for automatic object segmentation; and (b) a new module for “averaging” different 2D/3D segmentations, caused for instance by different human annotators or computational algorithms. Finally, using cancer multicellular aggregatesimaged with an LSFM, we compared volume estimations and measurements obtained with ReViSP, ReViMS,MITK, andOpenSegSPIM, providing some guidelines for researchers that have to decide which tool use for estimating the volume of their 3D in vitro models.
The next sections are organised as follows: Section2presents a short overview of the tools considered in the experiments, and then detailed in Section3. Finally, Section4summarises the main findings of the work.
2. Materials and Methods
In this section, a brief description is given for material and each software used in the experiments.
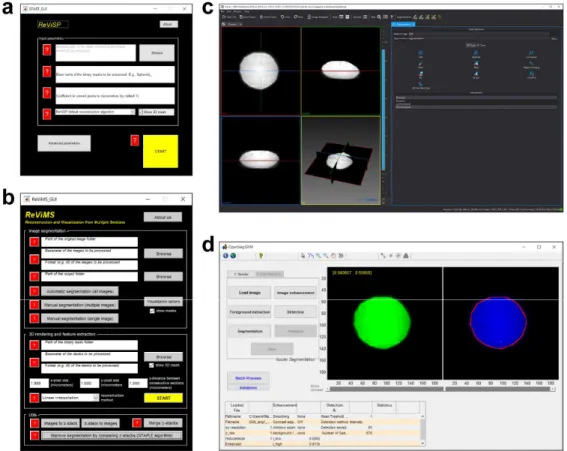
Figure1shows the Graphical User Interface (GUI) of the different considered software.
1
Figure 1. Screenshot of the Graphical User Interface (GUI) of the tools considered in this work.
(a)ReViSPversion 2.1; (b)ReViMSversion 2.0; (c)MITKversion 2018.04; (d)OpenSegSPIMversion 1.1.
2.1. ReViSP Version 2.1
ReViSP is an open-source software for estimating the volume of spheroids starting from the binary mask of a single projection [5]. ReViSPis written inMATLAB(The MathWorks, Inc., Natick, MA). Source code and standalone software (forWindows) are publicly available for download at:
http://sourceforge.net/p/revisp.ReViSPallows reconstruction of the external surface of aspheroidand estimation of its volume by just loading the binary mask of a single projection. No parameters are required. The binary mask can be easily obtained by manually segmenting a single projection with ImageJ[13]. Otherwise,AnaSPcan be used to automatically segment and analyse the originalspheroid’s image [9]. External surface and volume are then automatically computed by supposing a local circular symmetry of thespheroidaround its skeleton. On such base, ReViSPturns out to be an extremely user-friendly software. However, it is worth noting that today several tools similar toReViSPexist for volume and surface estimation ofspheroids[3].
2.2. ReViMS Version 2.0
ReViMSis an open-source, user-friendly software for estimating the volume of cellaggregateswith irregular shape andorganoids(i.e., multicellularaggregatesthat self-organise into ex vivo mini-organs [2])
by automatically segmenting single slices ofz-stacks of fluorescence images [12].ReViMSis written in MATLABand has been designed for biologists: it allows reconstruction of the external surface of a cell aggregateand estimation of its volume without any programming skills. Source code and standalone versions (forWindowsandLinux) are publicly available for download at:http://sourceforge.net/p/revims.
In the first software release (i.e.,ReViMS version 1.0), for each slice, the border of the aggregate was defined with a standard histogram-based segmentation method (e.g., Otsu segmentation[14], Triangle segmentation[15], or a combination of them). In order to improve the software applicability, we implemented two new Active Contour segmentation methods that permit handling even blurry fluorescent objects.
2.2.1. Active Contour Segmentation
Cell objects analysed in fluorescence typically generate images with blurry contours. Consequently, the definition of the cell borders becomes more subjective. Histogram-based segmentation methods provide a rule for defining foreground limits. However, slight variations of the threshold value are liable to generate strongly different segmentations outcomes. Spatial-based segmentation methods are in general more robust in defining the border of blurry objects.
In order to extend the segmentation opportunities provided byReViMSwith methods with better performances in case of blurry objects, we included two Active Contour methods: an edge-based segmentation method, well-known in literature asGeodesic Active Contour[16], and a region-based energy method, typically calledChan–Vese model[17]. Both methods belong to the class of “snakes” methods.
The classical “snakes” approaches work by deforming an initial contour towards the boundary of the object to be detected [18]. The deformation is obtained by iteratively minimising a functional designed so that its local minimum is obtained at the boundary of the object. Basically, to stop the curve evolution the classical “snakes” models rely on an edge-function depending on the image gradient.
TheGeodesic Active Contouris a connection between classical energy-based deformable contours and geometric curve evolution ones. In particular, a new term is introduced to the curve evolution models to attract the deforming curve to the boundary, thus improving the detection of boundaries with large differences in their gradient. The result is an Active Contour approach independent of object geometry and topology. TheChan–Vese modelis a further extension ofGeodesic Active Contour:
whilst classical “snakes” models can detect only objects with edges defined by gradient, in the Chan–Vese model, the stopping process is based on a different metric [19], not related to the gradient of the image. Accordingly, it can detect even contours without gradient, for instance, objects with smooth or discontinuous boundaries.
2.2.2. Averaging Different 2D/3D Segmentations
One of the major problems when assessing quality performances of segmentations tools is the lack of a robust Ground Truth for the considered dataset. Typically, manual segmentation by an expert annotator can be accounted as “Ground Truth”. However, the inter- and intra-rater reliability in the segmentation procedure is a well-known problem in several fields, ranging from radiology to histology [20]. Different experts clearly differ in segmenting the same object, and the variability is empathised in case of blurry images such as those typical of fluorescence microscopy.
In order to obtain a robust Ground Truth, improving and comparing 2D/3D manual segmentations obtained by different experts becomes fundamental, but these are challenging tasks. Practically, today there is not a standard procedure for “averaging” different 2D curves and 3D surfaces, even excluding outliers. Logically, the term “averaging” is not meant in the strict analytical sense because there is not a standard definition of average between curves.
In this scenario, the expectation–maximisation algorithm forSimultaneous Truth and Performance Level Estimation(STAPLE) is an interesting offer for “averaging” 2D curves [21]. The algorithm considers a collection of binary segmentations and computes a probabilistic estimate of the true segmentation and a measure of the performance level represented by each segmentation. In particular, the probabilistic
estimate of the true segmentation is formed by estimating an optimal combination of the segmentations, weighting each segmentation on the estimated performance level. Besides proving the quality of their approach on several datasets, the authors also provide an open-source version of the algorithm for several programming languages, including aMATLABversion working with 2D binary segmentations (https://bit.ly/2Su6jLJ).
In order to “average” different 2D curves and 3D surfaces created by different human annotators to obtain a more robust Ground Truth to assess quality performances of automatic segmentation tools, we have included inReViMSversion 2.0 an extended version ofSTAPLEworking with 3D segmentations. Briefly, the 3D “averaging” segmentation approach now included inReViMScan be summarised as follows:
1. Calculation, for each 3D objectk1segmented by a first expert annotator, the list of the overlapping objectskj(j=2,. . ., n;n=number of annotators) in the segmentations created by the other experts;
2. Selection, among the listed, of the objectskjwith volume spatially overlapping more than 50%
withk1;
3. Selection, among the objects kj with volume spatially overlapping more than 50%, of the 2D z-sections which overlap more than 50% with the correspondingz-section ofk1;
4. “Averaging” of the segmentations exploiting the standardSTAPLEalgorithm, by considering one-by-one each selectedz-section.
Source-code and standalone versions ofReViMS version 2.0, including the above described 3D “averaging” segmentation algorithm derived fromSTAPLE, are available at the website: http:
//sourceforge.net/p/revims.
2.3. MITK Version 2018.04
TheMedical Imaging Interaction Toolkit(MITK) is a free open-source software system for development of interactive medical image processing tools. Standalone versions (forWindows,LinuxandMac),C++
code, documentation, user manuals and video tutorials are distributed at: http://mitk.org/. MITK combines theInsight Toolkit(ITK) and theVisualization Toolkit(VTK) with an application framework [22].
Precisely, MITKis an extension ofVTK andITK: it virtually re-uses anything fromVTK andITK and implements functions that they do not support. For instance, it offers multiple, consistent and synchronised orthogonal 2D- and 3D-views of the same data using labels and colours helping the user to recognise and analyse Region of Interests (ROIs).
MITKwas originally developed as a common framework for Ph.D. students in theDivision of Medical and Biological Informatics(MBI) at theGerman Cancer Research Center, with the aim of supporting the development of leading-edge medical imaging software with a high degree of interaction [23].
MITKand theMITKapplications are not certified medical products. Accordingly, they must not be used in patient care and may be used in a research setting only. However, todayMITKis applied worldwide in Radiology and Nuclear Medicine research projects to segment anatomical and pathological structures from CT, MR, PET and SPECT images, and thanks to its versatility, it can be also used to segment multicellular aggregates, even at even single-cell level, imaged with confocal/multiphoton/LSFM instruments. The currently available version ofMITKis the version 2018.04.
In particular, theSegmentation Pluginenables for manually and (semi-)automatically segmenting ROIs, then post-processable using several available tools, such as2Dand3D Interpolation. The2D Interpolationcreates suggestions for a segmentation whenever there is a slice clear of segmentations (i.e., there will be no suggestion in slices with even only a single segmented pixel) and with neighbouring segmented slices (these do not need to be direct neighbours but could also be a couple of slices distant).
Interpolated suggestions are displayed with a different colour than manual segmentations are, until the user accepts them as part of the segmentation. The3D Interpolationis a pure mathematical interpolation, disregarding of image radiometric information. It is activated by default when using theManual Segmentation tools. From the second segmented contour onwards, the surface of the
segmented area will be interpolated based on the given contour information. By each further contour, the interpolation result will be improved. Accordingly, segmentations of sparse contours in arbitrarily oriented planes is the best approach to achieve an optimal interpolation result. Alternatively,MITK also provides several additional plugins for automatic (e.g., such asOtsu segmentationmethod [14]) and manually-adjustable thresholding, for obtaining initial segmentations.
2.4. OpenSegSPIM Version 1.1
OpenSegSPIMis an open-source and user-friendly 3D automatic quantitative analysis tool for confocal/multiphoton/LSFM data [11]. Standalone versions (forWindowsandMac),MATLABcode, documentation, user manuals and video tutorials are distributed at:http://opensegspim.weebly.com/.
OpenSegSPIMassumes no prior knowledge of image processing or programming and is designed to easily segment nuclei/cells from confocal/multiphoton/LSFM image stacks and extract single-cell quantitative relevant information, such as volume, sphericity, relative distance and intensity of the segmented objects.
The software leads the user through a sequence of simple pre-processing steps to obtain single-cell segmentations. A direct visual feedback is provided for the outcome of each step, and the quality of the segmentation depends on a few input parameters easily set using the GUI: the diameter of the objects of interest (set by manually drawing a few lines on the objects) and the range of intensity values considered as foreground (set using an intuitive interactive intensity adjustment tool).OpenSegSPIM also includes: (a) a sub-cellular segmentation tool, to analyse subcellular compartments such as the cell membrane; (b) a simple post-processing tool for manually editing the segmentations obtained;
and (c) an automatic batch process of time series and numerous datasets.
DespiteOpenSegSPIMbeing originally developed as a tool for single-cell/nucleus segmentation and analysis, it can be used to estimate the volume of an entire cancer multicellularaggregateby just considering theaggregateas a single object, or by summing the volume of the single composing cells.
The currently available version ofOpenSegSPIMis version 1.1.
2.5. Cancer Multicellular Aggregates and LSFM
In order to assess the accuracy of volume instances estimated withReViSP, ReViMS,MITK, andOpenSegSPIM, we used the three cancer multicellularaggregatesalready considered in [12]. These multicellularaggregates were generated using A549 cells (lung adenocarcinoma human cell line, American Type Culture Collection, Rockville, MD, USA). A549 cells were cultured growing in adhesion in Kaighn’s modification of Ham’s F-12 medium (F12K, ATCC), supplemented with 10% fetal bovine serum (FBS, EuroClone, Milan, Italy), 1% penicillin/streptomycin (GE Healthcare, Milan, Italy) and 2%
ampho-tericin B (Euroclone). A549 cells were expanded and maintained as a monolayer in incubator at 5% CO2humidified atmosphere at 37◦C and checked periodically for mycoplasma contamination using the MycoAlertTM Mycoplasma Detection Kit (Lonza, Basel, Switzerland). Today, many systems are available for generating 3Dcell cultures[1]. They can be divided into the scaffold-free and scaffold-based platforms [24]. The A549aggregatesused in this work were generated with a scaffold-free rotatory cell culture system, the RCCS-8DQ bioreactor (Synthecon Inc., Houston, TX, USA) [25]. The rotator bases were put in a humidified 37◦C, 5% CO2incubator, and connected to power supplies installed on the exterior side of the incubator. All activities were performed in sterile conditions. A single cell suspension of 106cells/mL was placed in a 50-mL bioreactor rotating chamber at an initial speed of 12 rpm. The speed was increased over time to avoid aggregate sedimentation within the culture vessels. The culture medium was refreshed every two days. After five days, theaggregatesreached an approximate diameter of 300µm and were thus transferred (oneaggregate/well) to sterile 96-well low-attachment culture plates (Corning Inc., Corning, NY, USA), with each well previously filled with 100µl of fresh culture medium. The plates were incubated at 5% CO2humidified atmosphere at 37◦C.
The A549aggregateswere then fixed using a glutaraldehyde solution, which provides a homogeneous and stable auto-fluorescent signal in the green range of wavelengths, useful to clearly visualise the
3D surface of theaggregates. Finally, theaggregateswere imaged using a Zeiss Lightsheet Z.1 with a filter at 561µm and a 20×/1.0 NA detection optics and two-sided 10×/0.2 NA illumination optics.
Thez-stacks were acquired by considering the sampling Nyquist criterion to compute thezdistance between subsequent frames, and finally obtainingz-stacks of around 500, 1920×1920 pixel resolution, 8-bit grey level images. Precisely, for Multicellular Aggregate 1 (hereafter, MA1) 262 sections were acquired, 492 sections for MA2, and 525 for MA3. Figure2shows the 3D representation of MA1, MA2, and MA3. It is worth noting that MA2 is characterised by a spherical shape, practically, it is aspheroid.
Appl. Sci. 2019, 9, x FOR PEER REVIEW 7 of 13
Precisely, for Multicellular Aggregate 1 (hereafter, MA1) 262 sections were acquired, 492 sections for MA2, and 525 for MA3. Figure 2 shows the 3D representation of MA1, MA2, and MA3. It is worth noting that MA2 is characterised by a spherical shape, practically, it is a spheroid.
Figure 2. 3D representation of the multicellular aggregates considered in this work. (a) Multicellular Aggregate 1 (MA1), characterised by an elliptical shape; (b) MA2, spherical shaped, practically, a spheroid; (c) MA3, irregular shaped. Images obtained with software Zeiss ZEN version 2.3 Blue Edition.
3. Results and Discussion
In order to provide guidelines for researchers that must decide a tool for estimating the volume of 3D in vitro models, we compared volume measurements obtained with ReViSP, ReViMS, MITK, and OpenSegSPIM, using cancer multicellular aggregates imaged with a LSFM. First of all, we analysed the manual segmentations provided by an expert operator segmenting two times the same images, to evaluate the Ground Truth robustness when considering fluorescence datasets. Then, in a second experiment, we showed the limitations of tools designed for spheroids when applied to multicellular aggregates volume estimation. Finally, we compared segmentations automatically obtained with ReViMS, MITK, and OpenSegSPIM, before giving hints for defining the “best software” according to the characteristics of the used 3D in vitro model.
3.1. Ground Truth Robustness When Considering Fluorescence Datasets
Objects bordering Ground Truth is necessary when analysing the accuracy of automatic segmentation methods. However, the unreliability of Ground Truth is a well-known issue when considering fluorescence datasets and approaches for “averaging” different experts’ segmentations, whilst removing outliers are required to improve the Ground Truth robustness.
In these experiments, we asked an expert microscopist to manually segment slice-by-slice the images of the three considered datasets. Precisely, we asked the operator to re-segment the images after a significant amount of time (i.e., one year from the first time), so to avoid remembering the contours drawn in the first place. In this way, the segmentation was essentially done from scratch without any prior information. Figure 3 reports the segmentations created by the operator for a couple of random slides of MA1 (reported in red and yellow in Figure 3c,e). The mismatch between the segmentations is more evident in boundary slices (e.g., green plane in Figure 3a), where the fluorescent signal from out-of-focus regions is more emphasised. Quantitatively, we measured the percentage absolute difference (AD%) between the number of pixels labelled as foreground in the two different segmentation stages. Average AD% maintained around 5%, this showing good repeatability of the operator when segmenting. In particular, for MA1 AD% was 4.1%, 3.5% for MA2, and 5.3% for MA3.
In order to further improve Ground Truth robustness, we used the 3D “averaging” module included in ReViMS to combine the two segmentation datasets obtained by the operator. The new segmentation dataset was then used as reference Ground Truth for the following experiments performed in this work.
Figure 2.3D representation of the multicellular aggregates considered in this work. (a) Multicellular Aggregate 1 (MA1), characterised by an elliptical shape; (b) MA2, spherical shaped, practically, aspheroid;
(c) MA3, irregular shaped. Images obtained with software ZeissZENversion 2.3 Blue Edition.
3. Results and Discussion
In order to provide guidelines for researchers that must decide a tool for estimating the volume of 3D in vitro models, we compared volume measurements obtained withReViSP,ReViMS,MITK, andOpenSegSPIM, using cancer multicellularaggregatesimaged with a LSFM. First of all, we analysed the manual segmentations provided by an expert operator segmenting two times the same images, to evaluate the Ground Truth robustness when considering fluorescence datasets. Then, in a second experiment, we showed the limitations of tools designed forspheroidswhen applied to multicellular aggregatesvolume estimation. Finally, we compared segmentations automatically obtained with ReViMS,MITK, andOpenSegSPIM, before giving hints for defining the “best software” according to the characteristics of the used 3D in vitro model.
3.1. Ground Truth Robustness When Considering Fluorescence Datasets
Objects bordering Ground Truth is necessary when analysing the accuracy of automatic segmentation methods. However, the unreliability of Ground Truth is a well-known issue when considering fluorescence datasets and approaches for “averaging” different experts’ segmentations, whilst removing outliers are required to improve the Ground Truth robustness.
In these experiments, we asked an expert microscopist to manually segment slice-by-slice the images of the three considered datasets. Precisely, we asked the operator to re-segment the images after a significant amount of time (i.e., one year from the first time), so to avoid remembering the contours drawn in the first place. In this way, the segmentation was essentially done from scratch without any prior information. Figure3reports the segmentations created by the operator for a couple of random slides of MA1 (reported in red and yellow in Figure3c,e). The mismatch between the segmentations is more evident in boundary slices (e.g., green plane in Figure3a), where the fluorescent signal from out-of-focus regions is more emphasised. Quantitatively, we measured the percentage absolute difference (AD%) between the number of pixels labelled as foreground in the two different segmentation stages. Average AD% maintained around 5%, this showing good repeatability of the operator when segmenting. In particular, for MA1 AD% was 4.1%, 3.5% for MA2, and 5.3% for MA3.
In order to further improve Ground Truth robustness, we used the 3D “averaging” module included inReViMSto combine the two segmentation datasets obtained by the operator. The new
segmentation dataset was then used as reference Ground Truth for the following experiments performed
in this work.Appl. Sci. 2019, 9, x FOR PEER REVIEW 8 of 13
Figure 3. Segmentations and 3D surfaces. (a) apical (green) and equatorial (blue) planes of Multicellular Aggregate 1 (MA1); (b,d) original images coming from different z-planes of MA1. The blurriness of out-of-focus regions is strongly evident in (b), the image coming from the apical plane represented in green in (a); (c,e) contours of MA1 (reported in yellow and red), created by the same operator in different times. Very slight variations are visible between the yellow and red contours reported in (e), the image coming from the equatorial plane represented in blue in (a); (f–h) 3D surface of MA3, reconstructed by ReViSP, ReViMS, MITK, and OpenSegSPIM, respectively.
3.2. Tools for Estimating the Volume of Spheroids Used for Multicellular Aggregates
The tools for estimating the volume of spheroids assume an approximate spherical symmetry of the multicellular aggregates to be measured. Most of the time, maximum diameter M and its orthogonal diameter P, or the average diameter D are estimated by using ellipsoid’s (Equation (1)) [26] or sphere’s (Equation (2)) [27] formula to approximate the mass volume:
6 .
P
2M V
ELLIPSOID
, (1)
6 . D
3V
SPHERE
.
(2)
Recently, ReViSP was introduced to estimate the volume just assuming a local circular symmetry of the spheroid instead of a global spherical symmetry. However, none of these methods allow for accurate 3D representation and reliable volume data collection in the case of multicellular aggregates, where it is not possible to infer the 3D shape of the object. For instance, Figure 3f reports the 3D surface obtained by ReViSP when analysing MA3, a multicellular aggregate with irregular shape. It results in being quite different from the original surface of MA3, strongly elongated along the z-axis (Figure 2).
In order to quantitatively compare the volume estimations of ReViSP and ReViMS, we first computed a binary version of the maximum intensity projection of MA1, MA2 and MA3 with ImageJ [13] and we reconstructed the volumes by ReViSP. Then, by computing AD%, we compared the volume instances obtained with ReViMS and ReViMS with Ground Truth. In particular, the new implemented Chan–Vese model was used for segmenting the images with ReViMS. Figure 3g shows the 3D surface obtained by ReViMS for MA3. Table 1 reports the volume measurements obtained using ReViSP and ReViMS, together with Ground Truth volume and AD%. The average AD% for ReViSP (i.e., 36,6) resulted 40 times higher than the average AD% for ReViMS (i.e., 0,8). Furthermore,
Figure 3.Segmentations and 3D surfaces. (a) apical (green) and equatorial (blue) planes of Multicellular Aggregate 1 (MA1); (b,d) original images coming from differentz-planes of MA1. The blurriness of out-of-focus regions is strongly evident in (b), the image coming from the apical plane represented in green in (a); (c,e) contours of MA1 (reported in yellow and red), created by the same operator in different times. Very slight variations are visible between the yellow and red contours reported in (e), the image coming from the equatorial plane represented in blue in (a); (f–h) 3D surface of MA3, reconstructed byReViSP,ReViMS,MITK, andOpenSegSPIM, respectively.
3.2. Tools for Estimating the Volume of Spheroids Used for Multicellular Aggregates
The tools for estimating the volume ofspheroidsassume an approximate spherical symmetry of the multicellularaggregatesto be measured. Most of the time, maximum diameterMand its orthogonal diameterP, or the average diameterDare estimated by using ellipsoid’s (Equation (1)) [26] or sphere’s (Equation (2)) [27] formula to approximate the mass volume:
VELLIPSOID= π
6·M·P2·, (1)
VSPHERE= π
6·D3·. (2)
Recently,ReViSPwas introduced to estimate the volume just assuming a local circular symmetry of thespheroidinstead of a global spherical symmetry. However, none of these methods allow for accurate 3D representation and reliable volume data collection in the case of multicellularaggregates, where it is not possible to infer the 3D shape of the object. For instance, Figure3f reports the 3D surface obtained byReViSPwhen analysing MA3, a multicellularaggregatewith irregular shape. It results in being quite different from the original surface of MA3, strongly elongated along thez-axis (Figure2).
In order to quantitatively compare the volume estimations ofReViSP andReViMS, we first computed a binary version of the maximum intensity projection of MA1, MA2 and MA3 with ImageJ[13] and we reconstructed the volumes byReViSP. Then, by computing AD%, we compared the volume instances obtained withReViMSandReViMSwith Ground Truth. In particular, the new implementedChan–Vese modelwas used for segmenting the images withReViMS. Figure3g shows the 3D surface obtained byReViMSfor MA3. Table1reports the volume measurements obtained using ReViSPandReViMS, together with Ground Truth volume and AD%. The average AD% forReViSP (i.e., 36,6) resulted 40 times higher than the average AD% forReViMS(i.e., 0,8). Furthermore, it is worth
noting thatReViSPprovided acceptable performance only for MA2 (i.e., 6,0), which is a multicellular aggregatewith spherical shape, practically, aspheroid[2].
Table 1.Accuracy ofReViSPandReViMSvolume estimations.
Ground Truth Volume (µm3)
ReViSPVolume (µm3)
ReViMSVolume (µm3)
ReViSP AD%
ReViMS AD%
MA1 13.418.918,238 24.726.769,373 13.294.691,377 84,3 0,9
MA2 15.101.283,699 16.009.703,137 15.265.923,983 6,0 1,1
MA3 11.619.907,849 9.337.259,753 11.658.164,658 19,6 0,3
3.3. Tools for Estimating the Volume of Multicellular Aggregates
In order to compare the accuracy of ReViMSwith other tools for segmenting cellaggregates, we segmented MA1, MA2, and MA3 also withMITKandOpenSegSPIM. First of all, we asked the same operator that previously obtained the Ground Truth, to useMITKfor manually re-segmenting five distributed slices for each orthogonal plane (e.g., axial, sagittal, coronal plane), for a total of 15 slices segmented for each considered multicellularaggregate. Then, theMITK 3D Interpolationplugin was used to compute the 3D surface and volume of MA1, MA2 and MA3. On the other hand, no prior data were required to estimate the volumes withOpenSegSPIM, except that the original image datasets of the multicellularaggregates(approximately, 1 GB each dataset) resulted in being too big to be loaded inOpenSegSPIMand a 0.1x-yresize factor was needed. In this case, the final volume for each multicellularaggregatewas obtained by summing the volume of the single cells automatically segmented byOpenSegSPIMand multiplying it for a resize factor of 10.
Figure3h,i show the final MA3 surface obtained byMITKandOpenSegSPIM, respectively. Table2 reports the volume measurements obtained usingReViMS,MITKandOpenSegSPIM, together with AD%. The average AD% forMITKandOpenSegSPIMresulted in being 1,1 and 9,6, respectively. Thus, while MITK resulted in being perfectly comparable withReViMS(average AD%=0,8), theOpenSegSPIM accordance was slight smaller. It is worth noting thatMITKis the only tool working also in case of images containing multiple objects, as images containing more spheroids, but to use MITKis time-consuming because it always requires initial manual segmentations of the object of interest.
Table 2.Accuracy ofMITKandOpenSegSPIMvolume estimations.
Ground Truth Volume
(µm3)
ReViMS Volume (µm3)
MITK Volume
(µm3)
OpenSegSPIM Volume (µm3)
ReViMS AD%
MITK AD%
OpenSegSPIM AD%
MA1 13.418.918,238 13.294.691,377 13.742.255,460 11.484.703,264 0,9 2,4 14,4 MA2 15.101.283,699 15.265.923,983 15.015.987,327 14.034.452,449 1,1 0,6 7,1 MA3 11.619.907,849 11.658.164,658 11.569.970,771 11.000.449,993 0,3 0,4 5,3
3.4. Defining the Volume-Estimation Tool
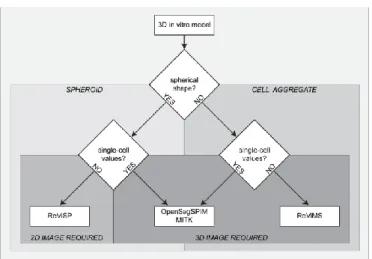
Figure4reports a flow-chart intended to help biologists, and researchers in general, to define an appropriate open-source tool to estimate the volume of multicellularaggregatesaccording to the characteristics of the used 3D in vitro model; Table3summarises the main features of the suggested tools, according to the template table proposed in [28]. If the cellaggregatehas a nearly spherical shape (i.e., it is aspheroid) and there is no interest in considering the single volumes of the cells composing theaggregate,ReViSPis the suggested open-source tool, as it just requires one single projection of thespheroid(i.e., a 2D image), easily attainable with a standard brightfield, phase-contrast, or DIC microscope without need of fluorescence staining. When, in the interest of estimating the total volume of the cellaggregatealso considering statistics about the volumes of the composing single cells, a 3D image is required, which is easily attainable with a confocal/multiphoton/LSFM. In this case, the tool
we suggest isOpenSegSPIMorMITK. In case the used 3D in vitro model is not aspheroid(i.e., it is characterised by an irregular shape) and the researcher is only interested in the total volume of the aggregate,ReViMSis the tool we suggest using.
Appl. Sci. 2019, 9, x FOR PEER REVIEW 10 of 13
used 3D in vitro model is not a spheroid (i.e., it is characterised by an irregular shape) and the researcher is only interested in the total volume of the aggregate, ReViMS is the tool we suggest using.
Figure 4. Flow-chart helping to define an appropriate open-source tool according to the characteristics of the used 3D in vitro model. ReViSP can be used just to estimate the total volume of a spheroid and it requires a single 2D image as input. If there is an interest in the volumes of the single cells composing the cell aggregate, OpenSegSPIM and MITK are available. Otherwise, ReViMS is the suggested tool. It is worth noting that OpenSegSPIM, MITK, and ReViMS require a 3D image as input.
Table 3. Suggested volume-estimation tools comparison.
ReViSP (version 2.1) ReViMS (version 2.0) MITK (version 2018.04)
OpenSegSPIM (version 1.1) DOCUMENTATION
User guide ● ● ● ●
Website ● ● ● ●
Video tutorial ● ● ● ●
Open source code ● ● ● ●
Implementation language MATLAB MATLAB C++ MATLAB
Test dataset/demo ● ● ● ●
Link to code/executable sourceforge.net/p/revisp sourceforge.net/p/revims mitk.org opensegspim.weebly.com Scientific reference Piccinini et al., 2015 [5] Piccinini et al., 2017 [12] Wolf et al., 2005 [22] Gole et al., 2016 [11]
USABILITY No programming experience
required ● ● ● ●
User-friendly GUI ● ● ● ●
Intuitive visualization settings ● ● O O
Does not require commercial
licence ● ● ● ●
Portability on Win/Linux/Mac Win Win/Linux Win/Linux/Mac Win/Mac
FUNCTIONALITY Designed for multicellular
aggregates O ● O ●
Automatic aggregate
segmentation ● ● O O
Automatic single-cell
segmentation O o O ●
Does not require human
interaction O ● O O
OUTPUT
3D rendering ● ● ● O
Volume statistics ● ● ● ●
Other features statistics O ● ● ●
●, available/yes; o, not available/no
Figure 4.Flow-chart helping to define an appropriate open-source tool according to the characteristics of the used 3D in vitro model.ReViSPcan be used just to estimate the total volume of aspheroidand it requires a single 2D image as input. If there is an interest in the volumes of the single cells composing the cellaggregate,OpenSegSPIMandMITKare available. Otherwise,ReViMSis the suggested tool. It is worth noting thatOpenSegSPIM,MITK, andReViMSrequire a 3D image as input.
Table 3.Suggested volume-estimation tools comparison.
ReViSP(Version 2.1) ReViMS(Version 2.0) MITK(Version 2018.04)
OpenSegSPIM(Version 1.1) DOCUMENTATION
User guide
Website
Video tutorial
Open source code
Implementation language MATLAB MATLAB C++ MATLAB
Test dataset/demo
Link to code/executable sourceforge.net/p/revisp sourceforge.net/p/revims mitk.org opensegspim.weebly.com Scientific reference Piccinini et al., 2015 [5] Piccinini et al., 2017 [12] Wolf et al., 2005 [22] Gole et al., 2016 [11]
USABILITY No programming
experience required
User-friendly GUI
Intuitive visualization
settings o o
Does not require
commercial licence
Portability on
Win/Linux/Mac Win Win/Linux Win/Linux/Mac Win/Mac
FUNCTIoNALITY Designed for multicellular
aggregates o o
Automatic aggregate
segmentation o o
Automatic single-cell
segmentation o o o
Does not require human
interaction o o o
oUTPUT
3D rendering o
Volume statistics
other features statistics o
, available/yes; o, not available/no
4. Conclusions
This work provides an extensive overview of open-source tools today available for researchers interested in estimating the volume of multicellular 3D-oids, besides presenting a new version of ReViMS(http://sourceforge.net/p/revims), a user-friendly software tool specifically designed to estimate the volume of organoids and, in general, multicellularaggregateswith irregular shape.
Using multicellular cancer aggregates imaged by a light-sheet fluorescent microscope, we compared different open-source tools for measuring the culture volume by starting from microscope-acquired images.
First of all, we proved that even an expert operator provides slightly different segmentations if asked to segment two times the same blurry fluorescence images. Accordingly, in case of fluorescent datasets, the Ground Truth of the object’s border is characterised by limited robustness and algorithms for combining different segmentations whilst removing outliers are needed. Then, depending on the geometry of the 3D in vitro model considered (i.e., spherical or irregular shape), solutions based on a single projection (e.g.,ReViSP) or suites analysing different sections (e.g.,ReViMSandMITK) can be used to estimate the volume with different accuracy. In particular, we proved that considering a single projection works just in case ofspheroids(i.e., multicellularaggregateswith a spherical shape) and very inaccurate measurements are obtained in case of general cellaggregateswith irregular shape.
Semi-automatic approaches likeMITKgenerally provide good results also in case of cellaggregates, but the accuracy of the measures strongly depend on the number of initial manually segmented images.
However, segmentation errors affect the accuracy of the final measurement. Eventually, software likeOpenSegSPIM, which automatically outlines the single cells of multicellularaggregates, can be used to obtain the volume of the entire culture by summing the single terms. However, the fairness of estimation logically depends on the extent by which cells overlap. ReViMSrepresents today the best trade-offbetween segmentation accuracy and computational time required in case of volume estimation of multicellularaggregatescharacterised by an irregular shape.
All the images and segmentations considered in this work, useful for instance for testing other volume estimation tools, are freely provided at:www.filippopiccinini.it/FP/2019FP-LSFM.zip.
Author Contributions:Conceptualization, I.D.S., E.T. and F.P.; Data curation, F.P.; Formal analysis, E.T. and F.P.;
Investigation, I.D.S., E.T. and F.P.; Project administration, F.P.; Software, F.P.; Supervision, P.H. and A.B.; Validation, F.P.; Writing—original draft, I.D.S. and F.P.; Writing—review and editing, E.T. All authors read and approved the final manuscript.
Funding:F.P., E.T., and P.H. acknowledge HAS-LENDULET-BIOMAG and the European Union and the European Regional Development Funds (GINOP-2.3.2-15-2016-00006, GINOP-2.3.2-15-2016-00026). F.P. acknowledges support from the NEUBIAS, COST Action (European Cooperation in Science and Technology) CA15124, for a granted short term scientific mission (ref: 41037) paving the way for this work.
Acknowledgments:We would like to thank Laurent Gole (Institute of Molecular and Cell Biology, IMCB—A*STAR, Singapore) and the other people ofOpenSegSPIMfor suggestions and help to use their tool; Michaël Barbier (University of Antwerp, Belgium) for helping implement the 3D extension of the STAPLE algorithm; and Tìmea Tóth and Mária Harmati (Biological Research Centre, Szeged, Hungary) for sharing with us important opinions about the tools.
Conflicts of Interest:The authors declare no conflict of interest.
References
1. Zanoni, M.; Piccinini, F.; Arienti, C.; Zamagni, A.; Santi, S.; Polico, R.; Bevilacqua, A.; Tesei, A. 3D tumor spheroid models for in vitro therapeutic screening: A systematic approach to enhance the biological relevance of data obtained.Sci. Rep.2016,6, 19103. [CrossRef] [PubMed]
2. Piccinini, F.; De Santis, I.; Bevilacqua, A. Advances in cancer modeling: fluidic systems for increasing representativeness of large 3D multicellular spheroids.Biotechniques2018,65, 312–314. [CrossRef] [PubMed]
3. Piccinini, F.; Tesei, A.; Bevilacqua, A. Single-image based methods used for non-invasive volume estimation of cancer spheroids: A practical assessing approach based on entry-level equipment. Comput. Methods Programs Biomed.2016,135, 51–60. [CrossRef] [PubMed]
4. Hou, Y.; Konen, J.; Brat, D.J.; Marcus, A.I.; Cooper, L.A. TASI: A software tool for spatial-temporal quantification of tumor spheroid dynamics.Sci. Rep.2018,8, 7248. [CrossRef]
5. Piccinini, F.; Tesei, A.; Arienti, C.; Bevilacqua, A. Cancer multicellular spheroids: Volume assessment from a single 2D projection.Comput. Methods Programs Biomed.2015,118, 95–106. [CrossRef] [PubMed]
6. Huang, Y.; Wang, S.; Guo, Q.; Kessel, S.; Rubinoff, I.; Chan, L.L.Y.; Li, P.; Liu, Y.; Qiu, J.; Zhou, C. Optical coherence tomography detects necrotic regions and volumetrically quantifies multicellular tumor spheroids.
Cancer Res.2017,77, 6011–6020. [CrossRef]
7. Duchi, S.; Piccinini, F.; Pierini, M.; Bevilacqua, A.; Torre, M.L.; Lucarelli, E.; Santi, S. A new holistic 3D non-invasive analysis of cellular distribution and motility on fibroin-alginate microcarriers using light sheet fluorescent microscopy.PLoS ONE2017,12, e0183336. [CrossRef]
8. Carragher, N.; Piccinini, F.; Tesei, A.; Trask, O.J.; Bickle, M.; Horvath, P. Concerns, challenges and promises of high-content analysis of 3D cellular models.Nat. Rev. Drug Discov.2018,17, 606. [CrossRef]
9. Piccinini, F. AnaSP: A software suite for automatic image analysis of multicellular spheroids.Comput. Methods Programs Biomed.2015,119, 43–52. [CrossRef]
10. Maleike, D.; Nolden, M.; Meinzer, H.P.; Wolf, I. Interactive segmentation framework of the medical imaging interaction toolkit.Comput. Methods Programs Biomed.2009,96, 72–83. [CrossRef]
11. Gole, L.; Ong, K.H.; Boudier, T.; Yu, W.; Ahmed, S. OpenSegSPIM: a user-friendly segmentation tool for SPIM data.Bioinformatics2016,32, 2075–2077. [CrossRef]
12. Piccinini, F.; Tesei, A.; Zanoni, M.; Bevilacqua, A. ReViMS: Software tool for estimating the volumes of 3-D multicellular spheroids imaged using a light sheet fluorescence microscope.Biotechniques2017,63, 227–229.
[CrossRef] [PubMed]
13. Collins, T.J. ImageJ for microscopy.Biotechniques2007,43, 525–530. [CrossRef] [PubMed]
14. Otsu, N. A threshold selection method from gray-level histograms.IEEE Trans. Syst. Man Cybern.1979,9, 62–66. [CrossRef]
15. Zack, G.W.; Rogers, W.E.; Latt, S.A. Automatic measurement of sister chromatid 132 exchange frequency.
J. Histochem. Cytochem.1977,25, 741–753. [CrossRef] [PubMed]
16. Caselles, V.; Kimmel, R.; Sapiro, G. Geodesic active contours.Int. J. Comput. Vis.1997,22, 61–79. [CrossRef]
17. Chan, T.F.; Vese, L.A. Active contours without edges.IEEE Trans. Image Process.2001,10, 266–277. [CrossRef]
[PubMed]
18. Kass, M.; Witkin, A.; Terzopoulos, D. Snakes: Active contour models.Int. J. Comput. Vis.1988,1, 321–331.
[CrossRef]
19. Mumford, D.; Shah, J. Optimal approximation by piecewise smooth functions and associated variational problems.Commun. Pure Appl. Math.1989,42, 577–685. [CrossRef]
20. Piccinini, F.; Tesei, A.; Arienti, C.; Bevilacqua, A. Cell counting and viability assessment of 2D and 3D cell cultures: expected reliability of the Trypan Blue assay.Biol. Proced. Online2017,19, 1–12. [CrossRef]
21. Warfield, S.K.; Zou, K.H.; Wells, W.M. Simultaneous truth and performance level estimation (STAPLE):
An algorithm for the validation of image segmentation. IEEE Trans. Med. Imaging 2004, 23, 903–921.
[CrossRef] [PubMed]
22. Wolf, I.; Vetter, M.; Wegner, I.; Böttger, T.; Nolden, M.; Schöbinger, M.; Hastenteufel, M.; Kunert, T.;
Meinzer, H.P. The medical imaging interaction toolkit. Med. Image Anal. 2005, 9, 594–604. [CrossRef]
[PubMed]
23. Nolden, M.; Zelzer, S.; Seitel, A.; Wald, D.; Müller, M.; Franz, A.M.; Maleike, D.; Fangerau, M.; Baumhauer, M.;
Maier-Hein, L.; et al. The medical imaging interaction toolkit: challenges and advances. Int. J. Comput.
Assist. Radiol. Surg.2013,8, 607–620. [CrossRef] [PubMed]
24. Han, H.W.; Asano, S.; Hsu, S.H. Cellular spheroids of mesenchymal stem cells and their perspectives in future healthcare.Appl. Sci.2019,9, 627. [CrossRef]
25. Ingram, M.; Techy, G.B.; Saroufeem, R.; Yazan, O.; Narayan, K.S.; Goodwin, T.J.; Spaulding, G.F.
Three-dimensional growth patterns of various human tumor cell lines in simulated microgravity of a NASA bioreactor.In Vitro Cell. Dev. Biol.-Anim.1997,33, 459–466.
26. Barbier, M.; Jaensch, S.; Cornelissen, F.; Vidic, S.; Gjerde, K.; de Hoogt, R.; Graeser, R.; Gustin, E. IMI PREDECT Consortium. Ellipsoid segmentation model for analyzing light-attenuated 3D confocal image stacks of fluorescent multi-cellular spheroids.PLoS ONE2016,11, e0156942. [CrossRef]
27. Leary, E.; Rhee, C.; Wilks, B.; Morgan, J.R. Accurate quantitative wide-field fluorescence microscopy of 3-D spheroids.Biotechniques2016,61, 237–247. [CrossRef]
28. Smith, K.; Piccinini, F.; Balassa, T.; Koos, K.; Danka, T.; Azizpour, H.; Horvath, P. Phenotypic image analysis software tools for exploring and understanding big image data from cell-based assays. Cell Syst. 2018,6, 636–653. [CrossRef] [PubMed]
©2019 by the authors. Licensee MDPI, Basel, Switzerland. This article is an open access article distributed under the terms and conditions of the Creative Commons Attribution (CC BY) license (http://creativecommons.org/licenses/by/4.0/).