Genome-wide Association Study for Flour Color-related Traits and Polyphenol Oxidase Activity in Common Wheat
X.L. Jiang1, g.F. Chen2, X.J. Li1, g. Li1, Z.g. Ru1* and J.C. Tian3*
1Center of Wheat Breeding of Henan Institute of Science and Technology; Collaborative Innovation Center of Modern Biological Breeding, Henan Province; Key Discipline Open Laboratory on Crop Molecular Breeding
of Henan Institute Xinxiang 453003, China
2College of Ecology and Garden Architecture, Dezhou University, Dezhou 253023, China
3State Key Laboratory of Crop Biology, Group of Quality Wheat Breeding of Shandong Agricultural University, Tai’an 271018, China
(Received 23 October 2017; Accepted 5 February 2018;
Communicated by A. Börner)
This study aimed to clarify the genetic mechanisms behind wheat flour color. Flour color- related traits (L*, a*, and b*) and polyphenol oxidase (PPO) activity are important parameters that influence the end-use quality of wheat. Dissecting the genetic bases and exploring important chromosomal loci of these traits are extremely important for improving wheat quality. The diverse panel of 205 elite wheat varieties (lines) was genotyped using a high- density Illumina iSelect 90K single-nucleotide polymorphisms (SNPs) assay to disclose the genetic mechanism of flour color-related traits and PPO activity. In 2 different environments and their mean values (MV), 28, 30, 24, and 12 marker-trait associations (MTAs) were iden- tified for L*, a*, b* traits, and PPO activity, respectively. A single locus could explain from 5.52% to 20.01% of the phenotypic variation for all analyzed traits. Among them, 5 highly significant SNPs (P ≤ 0.0001), 11 stable SNPs (detected in all environments) and 25 multitrait MTAs were identified. Especially, BS00000020_51 showed pleiotropic effects on L*, a*, and b*, and was detected in all environments with the highest phenotypic contribution rates.
Furthermore, this SNP was also found to be co-associated with wheat grain hardness, ash content, and pasting temperature of starch in previous studies. The identification of these significantly associated SNPs is helpful in revealing the genetic mechanisms of wheat color- related traits, and also provides a reference for follow-up molecular marker-assisted selec- tion in wheat breeding.
Keywords: flour color-related traits, PPO, bread wheat, GWAS, SNP marker
Introduction
Common wheat (Triticum aestivum L.) is one of the most important crops in the world.
Its flour can be used to make a variety of foods, such as bread, steamed bread, and noo- dles, which have important roles in human nutrition. Flour color significantly influences the quality of these end-use products (Zhao et al. 2013). And they are usually expressed
*Corresponding authors; E-mail: rzgh58@163.com; jctian@sdau.edu.cn
as L* (lightness), a* (red–green chromaticity) and b* (yellowness) of the flour sample (Oliver et al. 1992). Theoretically, a pure white flour should have zero values for a* and b*, and one hundred for L* (Sun et al. 2002). Low values of L* with high positive values of a* result in a gray and dull color (Zhang et al. 2009a). For yellow alkaline noodles, a flour with high b* value is desirable in both Japan and China (Kruger et al. 1992). But for steamed bread and dumplings, a white flour with extremely low value for b*and high value for L* is popular in China (Zhang et al. 2009b). Studies have shown that oxidase, yellow pigment, impurities, flour particle size, water content, flour yield, and milling process are the main factors affecting the color of wheat flour and its products (Zhang and Tian 2008). Of these, polyphenol oxidase (PPO) is the main factor leading to the brown- ing during processing and storage and then influencing color, which can explain from 50% to 70% of variations (Morris et al. 2000). Color is the first impression of the flour foods for the consumers, and is also one of the most important parameters for evaluating the quality of wheat flour and its products. Therefore, revealing its genetic basis and iden- tifying the favorable genes is beneficial for breeding new wheat varieties with high qual- ity using molecular marker-assisted selection (MAS).
These flour color-related traits and PPO activity are complex quantitative traits con- trolled by multiple genes (Moses et al. 2001). Currently, the main methods used to per- form genetic analysis for quantitative traits are linkage analysis and association mapping.
Previously, a large number of studies related to quantitative trait locus (QTL) mapping for wheat flour color and PPO activity were performed using linkage analysis, and some major QTLs were identified (Zhang et al. 2009c; Zhai et al. 2016). These studies utilized biparental segregating population, which is subject to low allele numbers and limited re- combination (Flint-Garcia et al. 2003). Consequently, the QTLs revealed so far for these traits might represent only parts of the genetic system. In comparison, a genome-wide association study (GWAS) is a recently developed, high-resolution method for genetic mapping using existing germplasm (such as landraces, elite cultivars, and advanced breeding lines) based on linkage disequilibrium (LD) (Ingvarsson and Nathaniel 2011).
The GWAS permits a survey of a wide range of alleles at each locus, detection of MTAs at the whole-genome level, and identification of elite alleles for significantly associated loci (Zhang et al. 2013). To date, few reports have used association mapping to dissect the genetic mechanism of whole wheat flour color-related traits and PPO activity. Especially, no study has dissected the genetic basis of these traits using GWAS based on tens of thou- sands of SNP markers.
A systematic GWAS was performed using an Illumina iSelect 90K SNP array and a panel of 205 elite wheat cultivars (lines) derived from the winter wheat region of China to clarify the genetic mechanisms behind the whole wheat flour color. The main objects of this work described here were to dissect the genetic basis of all analyzed traits and find significant associations between marker and certain trait. The results can lay a foundation for molecular-assisted breeding, functional gene research, and widening the genetic di- versity of wheat germplasm.
Materials and Methods Test materials and field planting
The test materials used in the present study comprised 205 diverse varieties or lines care- fully chosen to represent genetic stock used in the winter wheat regions of China. Of these, 203 varieties and lines came from 10 provinces that are major winter wheat produc- tion regions in China, and the remaining 2 varieties, used as founder parents, were from other countries (Mexico and France). The 205 varieties and lines included 77 bread varie- ties, 55 founder parents, and 73 breeder’s lines (Table S1*).
All the test materials were planted in the test fields of Shandong Agricultural Univer- sity (Tai’an, 116°36’E, 36°57’N) and Dezhou Academy of Agricultural Sciences (Dezhou, 116°29’E, 37°45’N) during the wheat crop cycles in 2014–2015. A completely rand- omized design was used with three replications in two different environments, and all lines were grown in a three-row plot, 25 cm apart. Field management was the same as the general field, and no serious pests and lodging were observed during the period of growth.
At last, the lines were harvested individually at maturity and cleaned prior to milling.
Measurement of the flour color and PPO activity
The whole wheat meal was prepared by milling the wheat grains in a whirlwind mill (Perten3100, Sweden).
Flour color parameters (L*, a*, and b*) were measured using a Minolta colorimeter (CR-400, Minolta, Japan) with the Commission Internationale de l’éclairage L* a* b* color system. L* represented the lightness (0 for black and 100 for white), a* represented the red–green direction, and b* represented the yellow–blue direction. Each sample was re- peated three times, and the observed value in each environment was the average value of the samples.
A total of 10.0 mg sample of wheat flour was weighed, and 100 μl of phosphate-buff- ered saline (pH 7.2–7.4) was added and mixed well. Then, the mixture was centrifuged for 20 minute at 2000–3000 rpm. The supernatant was collected carefully, which was the PPO extract. The absorbance (optical density) was measured at 450 nm using a micro- plate reader (RT-6100, Shenzhen Rayto Corporation, China) by taking advantage of the plant polyphenol oxidase enzyme-linked immunosorbent assay kit (Shanghai Jianglai Biological Technology Co. Ltd., China). The PPO activity in the sample was calculated using the standard curve, and the unit of enzyme activity was U/mg. Each sample was assayed in duplicate, and the mean values were used for statistical analysis.
Molecular analysis
DNA was extracted using the slightly modified Triticarte Pty. Ltd (http://www. triticarte.
com. au/) method. The DNA quality was determined by electrophoresis on 0.8% agarose
*Further details about the Electronic Supplementary Material (ESM) can be found at the end of the article.
gel, and the DNA concentration was determined using a NanoDropND-1000 UV–Vis spectrophotometer (NanoDrop Technologies, NC, USA).
The Genome Center at the University of California, CA, USA, was entrusted to per- form genotyping of the population DNA using the jointly developed wheat 90K Illumina iSelect array (81,587 SNPs) (Wang et al. 2014) following the manufacturer’s recommen- dations as described by Akhunov et al. (2009). The genotyping assays were carried out on the Illumina iScan Reader. Genotypic clusters for each SNP were determined using the polyploidy version of the Genome Studio software (Illumina, http://www.illumina.com).
The accuracy of SNP clustering was visually checked, and incorrectly clustered SNPs were manually adjusted. Quality control of the obtained genotype data was performed using PLINK v1.07 (Purcell et al. 2007), excluding the SNP markers with the detection rate of less than 0.8 and the minor allele frequency of less than 0.05. Finally, a total of 24,355 SNPs were obtained for the association analysis.
Data analysis
The variance, descriptive statistics, and correlation of the tested traits were performed using the statistical software SPSS 17.0 (SPSS, IL, USA). The TASSEL 3.0 software (http://www.maizegenetics.net/) was used to evaluate the MTA. The P value determined whether a QTL was associated with the marker or not. The R2 was used to evaluate the magnitude of the MTA effects. SNPs with P ≤ 0.001 were considered to be significantly associated with individual traits. Analysis of population structure and kinship were evalu- ated referring to the method of Chen et al. (2016).
Results Phenotypic evaluation
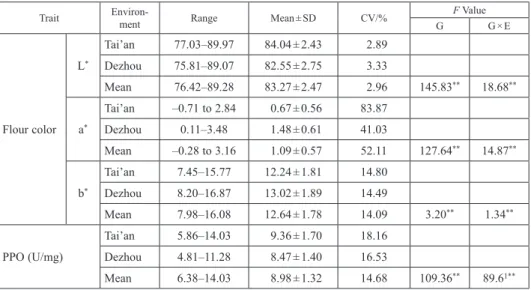
The phenotypic variation of wheat flour color-related traits in different environments is shown in Table 1. The variation coefficient of L*, a*, and b*, as well as PPO activity of the test materials, was ranged from 2.89% to 83.87%. The variation coefficient of a* was the highest, whereas that of L* was the smallest. Analysis of variance (ANOVA) showed ex- tremely significant differences between the varieties and the interaction of cultivars × environment for all traits (Table 1). Thus, the four analyzed traits showed broad pheno- typic variations among different varieties and environments, and their genetic diversity was high. Moreover, the population had the potential of screening excellent germplasms, which were suitable for GWAS analysis.
The relationships among all analyzed traits are shown in Table S2. Highly significant correlations were observed among L*, a*, and b*. Of these, significant negative correla- tions were observed between L* and a* as well as b*, whereas significant positive correla- tions were found between a* and b*. Moreover, the correlations among these three traits had the same tendency under different environments, which meant that the correlation coefficient was the largest between L* and a*, while it was the smallest between a* and b*. Moreover, the correlation coefficient in Tai’an was less than that in Dezhou across each
environment. However, the correlation between three color-related traits and PPO activ- ity was not significant.
GWAS of flour color-related traits and PPO activity
Before embarking on GWAS, three different association models (GLM, GLM_Q, and MLM_Q + K) were used for finding the most valid number of associated loci, based on L* data collected from the 2 different environments (Fig. S1). Results showed that the number of positively associated loci was the lowest by MLM_Q + K, and its actual P value was in good agreement with the expected P value, demonstrating that this model can well reduce potential false positives. Therefore, this study selected MLM_Q + K to perform the GWAS for the four analyzed traits.
A total of 64 SNPs significantly associated with flour color-related traits and PPO ac- tivity were detected at P ≤ 0.001 (–lg P ≥ 3.00) across the 2 different environments and mean values (MV), with the percentage of variance explained by the associated SNPs (R2) from 5.52% to 20.01% (Table S3). Of these associated loci, five SNPs showed high- ly significant associations with flour color-related traits (P ≤ 0.0001).
In total 28 loci were found to be significantly associated with L*, which distributed on the chrs. 1A, 1B, 3B, 4A, 5A, 5D, 6A, and 7B, accounting for 5.54%–16.42% of the phe- notypic variance in each environment (Table S3). Of these, three markers (Excalibur_
c49550_97, wsnp_Ex_c23787_33024604, and IAAV4799) on chr. 5A, one marker (BS00000020_51) on chr. 5D, and one marker (tplb0039c07_537) on chr. 7B were de- tected in all environments, suggesting that these MTAs could be considered stable mark-
Table 1. Descriptive statistics and ANOVA for phenotypic observations of flour color-related traits in 205 wheat cultivars (lines)
Trait Environ-
ment Range Mean ± SD CV/% F Value
G G × E
Flour color L*
Tai’an 77.03–89.97 84.04 ± 2.43 2.89 Dezhou 75.81–89.07 82.55 ± 2.75 3.33
Mean 76.42–89.28 83.27 ± 2.47 2.96 145.83** 18.68**
a*
Tai’an –0.71 to 2.84 0.67 ± 0.56 83.87
Dezhou 0.11–3.48 1.48 ± 0.61 41.03
Mean –0.28 to 3.16 1.09 ± 0.57 52.11 127.64** 14.87**
b*
Tai’an 7.45–15.77 12.24 ± 1.81 14.80
Dezhou 8.20–16.87 13.02 ± 1.89 14.49
Mean 7.98–16.08 12.64 ± 1.78 14.09 3.20** 1.34**
PPO (U/mg)
Tai’an 5.86–14.03 9.36 ± 1.70 18.16 Dezhou 4.81–11.28 8.47 ± 1.40 16.53
Mean 6.38–14.03 8.98 ± 1.32 14.68 109.36** 89.61**
**Significant at the 0.01 probability level.
ers for the trait. Especially, the locus (BS00000020_51) on chr. 5D showed a highly sig- nificant (P < 0.00001) association with L* and had the highest R2 (14.32%). Moreover, a locus harboring six MTAs for L* was detected on chr. 5A (93cM), which could be re- garded as a strongly associated region for L*.
For a*, 30 MTAs were mapped onto chrs. 1A, 1B, 3A, 3B, 3D, 4A, 5A, 5B, 5D, 6A, 6B, 7A, and 7B, which accounted for 5.73%–14.32% of the phenotypic variance in each environment (Table S3 and Fig. 1). Of these, three MTAs (Jagger_c1888_277, BS00000020_51, and tplb0039c07_537) on chrs. 1B, 5D, and 7B were detected in all environments, and one locus (BS00000020_51) on chr. 5D showed a highly significant (P < 0.0001) association with a* and had the highest R2 (14.32%). Besides, a strongly as- sociated region for a* was also found on chr. 6B (66 cM), which harbors four MTAs.
A total of 24 MTAs for b* were identified on the chrs. 1A, 1B, 2A, 3B, 5A, 5D, 6A, 7A, and 7B, which accounted for 5.52%–20.01% of the phenotypic variance in each environ- ment (Table S3). Of these, four loci were detected in all environments, including one marker (Kukri_c34242_404) on chr. 1A, one marker (BS00000020_51) on chr. 5D, and two markers (Excalibur_c1791_331 and Excalibur_c39817_332) on chr. 7A. The locus BS00000020_51 on chr. 5D showed a highly significant (P < 0.000001) association with b* and had the highest R2 (20.01%). In addition, a locus located on chr. 5A (93 cM), har- boring six MTAs, which was regarded as a strongly associated region for b*.
The detected loci significantly associated with PPO activity were only 12 distributed on the chrs. 1D, 3D, 4A, 5A, 6A, 7A, and 7D, accounting for 5.63%–9.08% of the phe- notypic variance in each environment (Table S3). Of these, the MTA (BS00022237_51) on chr. 7A had the highest R2 but was detected only in one environment. No significantly associated locus was detected in all environments at the same time, and only one marker (BobWhite_c11000_782) on the chr. 3D was detected in one environment and MV.
A total of 25 multitrait MTAs for wheat flour color-related traits were detected in this study. Among the MTAs for L*, 23 loci controlled two or more traits at the same time, of which Jagger_c1888_277 and Excalibur_c49550_97 were pleiotropic loci for L* and a* across all environments. The BS00000020_51 and tplb0039c07_537 loci also showed plei- otropic effects on L*, a*, and b*, and were detected in all environments. Among the MTAs for a*, 17 loci simultaneously controlled two or more traits. The MTA tplb0039c07_537 had a pleiotropic effect on a* and b* across all environments. A total of 15 associated loci for b* had pleiotropic effects, each of which controlled 2 or more traits. It was worth mentioning that BS00000020_51 locus on chr. 5D was detected to control L*, a*, and b* in all environ- ments. Moreover, the R2 value in single environment was more than 10.0%.
Figure 1. Genome-wide association scan for a* among the 205 wheat germplasms
Table 2. SNPs with significant association signals (–lg P ≥ 3.00, P ≤ 0.001) for analyzed traits detected in all environments TraitsMarkersChrs.
Position (cM)
Significance (–lg)R2 (%) DezhouTai’anMVDezhouTai’anMV L*Jagger_c1888_2771B103.123.193.435.896.166.82 Excalibur_c49550_975A943.233.253.576.056.267.08 wsnp_Ex_c23787_330246045A953.433.303.786.506.387.58 IAAV47995A953.433.303.786.506.387.58 BS00000020_515D1035.316.997.0711.0816.3716.42 tplb0039c07_5377B813.813.304.497.366.389.32 a*Jagger_c1888_2771B103.513.533.756.776.977.57 BS00000020_515D1034.826.326.319.8814.4414.32 tplb0039c07_5377B813.503.094.396.675.929.08 b*Kukri_c34242_4041A1543.143.903.915.767.737.79 BS00000020_515D1036.828.218.4114.7119.6120.01 Excalibur_c1791_3317A1783.133.253.635.746.207.13 Excalibur_c39817_3327A1783.133.253.635.746.207.13
Discussion GWAS for flour color and PPO activity
In total 28, 30, 24, and 12 SNP loci were found to be significantly associated with L*, a*, b*, and PPO activity, respectively, across 2 different environments and MV. Of these, 5, 3, and 4 MTAs were stably associated with L*, a*, and b* in all environments, respec- tively. However, among the MTAs for PPO activity, only one locus was stably detected in two different environments, which might be because it was prone to be affected by the environment (Hu et al. 2004). Fulton et al. (1997) believed that QTLs that could be de- tected in different environments might be more valuable in breeding compared with QTLs with high contribution rate of phenotypic variation found only in a specific envi- ronment. Therefore, MTAs stably detected across multiple environments in the present study can be applied in wheat breeding.
Moreover, among the detected MTAs for flour color-related traits in this study, 25 multitrait MTAs were identified, each of which controlled 2 or more traits. For example, the loci BS00000020_51 and tplb0039c07_537 were located on chrs. 5D and 7B, respec- tively, showed pleiotropic effects on the three traits L*, a*, and b*. Thumma et al. (2001) pointed out that if QTL for two traits were on the same chromosomal region, a causal relationship might exist between the two traits. The identification of these multitrait MTAs suggested that the three traits L*, a*, and b* were closely associated, which was consistent with the correlation analysis of the three traits (Table S2). Humphries et al.
(2004), Zhang et al. (2009a), and Zhai et al. (2016) also obtained the same results, indicat- ing pleiotropic effect or a close link between the controlling genes of three traits. How- ever, the MTAs for PPO activity were independent of flour color-related traits, which was consistent with the findings of Zhai et al. (2016), indicating that PPO influenced the qual- ity of wheat end-use products by browning reaction during processing but not by influ- encing flour color.
Comparison with previous studies
Compared with previous studies for flour color-related traits in wheat, the 44 detected SNP loci in this study were consistent with or closely adjacent to the QTL position identi- fied in previous studies (Table S3). For example, among the MTAs for L* detected in this study, Kukri_c22349_754, Kukri_rep_c102231_265, and GENE-1118_58 (chr. 1A) were found to be in the same genomic region as the QTL (QFL*.mna-1A.1) for L* detected by Tsilo et al. (2011). The MTA for a*, BS00025964_51 (chr. 1B) , was only about 3 cM away from the QTL (qa1B) detected by Zhang et al. (2009a). The MTAs (Kukri_c22349_754, Kukri_rep_c102231_265, and GENE-1118_58) for b* located on chr. 1A were closely adjacent to the MTA (wPt-731090) for b* detected by Yu et al. (2014). Above all, five MTAs for flour color-related traits not only were detected across all environments in this study but also were closely adjacent to the loci reported by previous studies (Yu et al.
2014; Zhai et al. 2016; McCartney et al. 2006). All these findings validated that MTAs detected in this study were reliable in our material and among the environments. These
consensus SNP/QTL loci may serve as candidate regions for further study of the genetic mechanism of flour color. Further exploring and studying the candidate genes of these key loci may provide important molecular information for the future improvement of wheat flour color.
The natural population used in this study has been utilized to dissect the genetic basis of other quality and agronomic traits in wheat by our research teem (Chen 2016; Liu et al.
2017). Compared with these studies, SNP BS00000020_51 (chr. 5D) detected in the pre- sent study, was significantly associated with L*, a*, and b*, also had a pleiotropic effect on wheat kernel hardness and ash content. This locus might contain genes that controlled the flour color, kernel hardness, and ash content at the same time, which was consistent with the results that flour color was closely correlated with the kernel hardness and ash content in wheat (Zhang et al. 2009b). In addition, this MTA was detected in all environments with the highest phenotypic contribution rates in the present study, which might be a newly identified locus for wheat flour color-related traits. Therefore, future studies should be focused on this genomic region to explore the candidate gene for wheat flour color.
Most previous studies have shown that the major genes controlling the PPO activity in wheat are located on homoeologous group 2 chrs. of wheat (Demeke et al. 2001; Raman et al. 2005). However, other chrs. such as the homoeologous groups 3 and 5 as well as chrs. 6B and 7D also had some minor genes (Demeke et al. 2001). This study did not find SNPs that were significantly associated with wheat PPO activity on the homoeologous group 2. Nevertheless, several MTAs were found on homoeologous groups 3 and 5 as well as chrs. 7D, which might be minor gene loci controlling PPO activity. Furthermore, the detected MTAs RAC875_c13_1458 and Excalibur_c53930_53 (chr. 5A), together with tplb0024a09_742 and tplb0024a09_2106 (chr. 7D), were mapped into the adjacent regions on the same chr. of QTLs for PPO activity detected by Zhao et al. (2013) and Zhai et al. (2016), respectively. The differences between the results of this study and other previous studies might be related to the differences in the mapping population, analyzing methods, as well as marker type and positions on different genetic maps. Moreover, the newly identified SNPs significantly associated with PPO activity needed to be further validated by using different populations and locations.
Acknowledgments
This research was supported by the Shandong Provincial Agriculture Liangzhong Project Foundation of China (2014 No. 96), Major Science and Technology Project of Henan Province (No. 121100111400) and National Natural Science Foundation of China (No.
31171554).
References
Akhunov, E., Nicolet, C., Dvorak, J. 2009. Single nucleotide polymorphism genotyping in polyploid wheat with the Illumina GoldenGate assay. Theor Appl. Genet. 119:507–517.
Bordes, J., Ravel, C., Gouis, J.L., Lapierre, A., Charmet, G., Balfourier, F. 2011. Use of a global wheat core collection for association analysis of flour and dough quality traits. J Cereal Sci. 54:137–147.
Chen, G.F. 2016. Construction of wheat (Triticum aestivum L.) genetic map and GWAS for agronomic and quality traits using SNP marker. Dissertation, Shandong Agricultural university, China
Chen, G.F., Zhang, H., Deng, Z.Y., Wu, R.G., Li, D.M., Wang, M.Y. 2016. Genome-wide association study for kernel weight-related traits using SNPs in a Chinese winter wheat population. Euphytica 212:1–13.
Demeke, T., Morris, C.F., Campbell, K.G. 2001. Wheat polyphenol oxidase: distribution and genetic mapping in three inbred line populations. Crop Sci. 41:1750–1757.
Flint-Garcia, S.A., Thornsberry, J.M., Buckler, E.S. 2003. Structure of linkage disequilibrium in plants. Annu.
Rev. Plant Biol. 54:357–374.
Fulton, T.M., Beck-Bunn, T., Emmatty, D., Eshed, Y., Lopez, J., Petiard, V. 1997. QTL analysis of an advanced backcross of Lycopersicon peruvianum to the cultivated tomato and comparisons with QTLs found in other wild species. Theor. Appl. Genet. 95:881–894.
Hu, R.B., Tian, J.C., Lu, J.H. 2004. Effect of genotype and environment on polyphenol oxidase (PPO) activity in wheat (Triticum aestivum L.). J. Chinese Cereals Oils Assoc. 19:16–18, 22.
Humphries, J.M., Graham, R.D., Mares, D.J. 2004. Application of reflectance color measurement to the estima- tion of carotene and lutein content in wheat and triticale. J. Cereal Sci. 40:151–159.
Ingvarsson, P.K., Nathaniel, R.S. 2011. Association genetics of complex traits in plants. New Phytol. 189:909–
Kruger, J.E., Matsuo, R.R., Preston, K. 1992. A comparison of methods for the prediction of Cantonese noodle 922.
colour. Can. J. Plant Sci. 72:1021–1029.
Liu, K., Deng, Z.Y., Zhang, Y., Wang, F.F., Liu, T.T., Li, Q.F. 2017. Linkage analysis and genome-wide asso- ciation study of QTLs controlling stem-breaking-strength-related traits in wheat. Acta. Agron. Sin. 43:483–
McCartney, C.A., Somers, D.J., Lukow, O., Ames, N., Noll, J., Cloutier, S. 2006. QTL analysis of quality traits 495.
in the spring wheat cross RL4452 × ‘AC Domain’. Plant Breeding 125:565–575.
Morris, C.F., Jeffers, H.C., Engle, D.E. 2000. Effect of processing, formula and measurement variables on alkaline noodle color-Toward an optimized laboratory system. Cereal Chem. 77:77–85.
Moses, O.K., Liavoga, A., Yong, K.J., Bagorogoza, K. 2001. Activity and inhibition of polyphenol oxidase in extracts of bran and other milling fractions from a variety of wheat cultivars. Cereal Chem. 78:514–520.
Oliver, J.R., Blakeney, A.B., Allen, H.M. 1992. Measurement of flour color in color space parameters. Cereal Chem. 69:546–551.
Purcell, S., Neale, B., Todd-Brown, K., Thomas, L., Ferreira, M., Bender, D. 2007. PLINK: a tool set for whole- genome association and population-based linkage analyses. Am. Human Genet. 81:559–575.
Raman, R., Raman, H., Johnstone, K., Lisle, C., Smith, A., Matin, P. 2005. Genetic and in silico comparative mapping of the polyphenol oxidase gene in bread wheat (Triticum aestivum L.). Funct. Integr. Genomics 5:185–200.
Roncallo, P.F., Cervigni, G.L., Jensen, C., Miranda, R., Carrera, A.D., Helguera, M. 2012. QTL analysis of main and epistatic effects for flour color traits in durum wheat. Euphytica 185:77–92.
Sun, X.D., Wang, L.K., Ren, H.B., Lan, J. 2002. The application of tristimulus colorimeter in the determination of flour color. Technol. Oil Food 10:31–33.
Thumma, B.R., Naidu, B.P., Chandra, A., Cameron, D.F., Bahnisch, L.M., Liu, C. 2001. Identification of causal relationships among traits related to drought resistance in Stylosanthes scabra using QTL analysis.
J. Exp. Bot. 52:203–214.
Tsilo, T.J., Hareland, G.A., Chao, S., Anderson, J.A. 2011. Genetic mapping and QTL Analysis of flour color and milling yield related traits using recombinant inbred lines in hard red spring wheat. Crop Sci. 51:237–
Wang, S.C., Wong, D., Forrest, K., Allen, A., Chao, S., Huang, B. E. 2014. Characterization of polyploid wheat 246.
genomic diversity using a high-density 90000 single nucleotide polymorphism array. Plant Biotechnol. J.
12:787–796.
Yu, H.X., Xiao, J., Tian, J.C. 2014. Genome-wide association analysis of flour color (whiteness) using DArT markers in common Wheat. Acta Agron. Sin. 40:2198–2202.
Zhai, S.N., He, Z.H., Wen, W.E., Jin, H., Liu, J.D., Zhang, Y. 2016. Genome-wide linkage mapping of flour color-related traits and polyphenol oxidase activity in common wheat. Theor. Appl. Genet. 129:377–394.
Zhang, K.P., Chen, G.F., Zhao, L., Liu, B., Xu, X.B., Tian, J.C. 2009a. Molecular genetic analysis of flour color using a doubled haploid population in bread wheat (Triticum aestivum L.). Euphytica 165:471–484.
Zhang, K.P., Wang, J.J., Zhang, L.Y., Rong, C.W., Zhao, F.W., Peng, T. 2013. Association analysis of genomic loci important for grain weight control in elite common wheat varieties cultivated with variable water and fertiliser supply. PLoS One 8: 1–17.
Zhang, X., Tian, J.C. 2008. The color advantage of Chinese wheat with high whiteness and analysis of factors affecting color formation. Sci. Agr. Sin. 41:347–353.
Zhang, X., Tian, J.C., Zhu, D.M. 2009b. Correlation between quality traits and color of flour and dough sheet in RIL populations. J. Chinese Cereals Oils Assoc. 24:1–6.
Zhang, Y.L., Wu, Y.P., Xiao, Y.G., He, Z.H., Zhang, Y., Yan, J. 2009c. QTL mapping for flour and noodle colour components and yellow pigment content in common wheat. Euphytica 165:435–444.
Zhao, Y., Sun, H.Y., Wang, Y.Y., Pu, Y.Y., Kong, F.M., Li, S. S. 2013. QTL mapping for the color, carotenoids and polyphenol oxidase activity of flour in recombinant inbred lines of wheat. Aust. J. Crop Sci. 7:328–337.
Electronic Supplementary Material (ESM)
Electronic Supplementary Material (ESM) associated with this article can be found at the website of CRC at https://akademiai.com/loi/0806
Electronic Supplementary Table S1. Names and sources of wheat varieties used in this study Electronic Supplementary Table S2. Correlation coefficients between flour color-related traits in 205 wheat
cultivars (lines)
Electronic Supplementary Table S3. SNPs with significant association signals (–lg P ≥ 3.00, P ≤ 0.001) for flour color-related traits detected in wheat natural population
Electronic Supplementary Figure S1. Manhattan and Q–Q plots of L* for the three models. A, B, and C are Manhattan plots of L* under the GLM, GLM_Q, and MLM_Q + K models in Dezhou, respectively. a, b, and c are Q–Q plots of L* under the GLM, GLM_Q, and MLM_Q + K models in Dezhou, respectively. D, E, and F are the Manhattan plots of L* under the GLM, GLM_Q, and MLM_Q + K models in Tai’an, respectively. d, e,
and f are Q–Q plots of L* under the GLM, GLM_Q, and MLM_Q + K models in Tai’an, respectively