Volume 63 Number 6239 DOI: 10.22444/IBVS.6239
Konkoly Observatory Budapest
16 March 2018 HU ISSN 0374 – 0676
PRECESSION OF THE DISK IN PLEIONE STUDY OF THE Hα LINE PROFILE
ERNST POLLMANN
Emil-Nolde Straße 12, 51375 Leverkusen, Germany
Observatory of the Vereinigung der Sternfreunde K¨oln, Germany
Abstract
Medium-resolution spectroscopy of the binary system Pleione (28 Tau), obtained over the time period October 2004 (JD 2453300) to March 2018 (JD 2458185) by the ARAS Spectroscopy Group, has been used to determine the central absorption depth (CA), V/R ratio, radial velocity (RV) and equivalent width of the Hαemission, in order to study the disk precession as a consequence of the periastron passages of the companion. We found an exact coincidence of the CA maxima with the minima of V/R and RV as a result of the disk precession. This has never before been observed during the maximum shell phase in the years around 1980, or during the initial shell phase around August/October 1974.
1 Introduction
Pleione (28 Tau, HD 23862) is a B8Vpe star (Hoffleit & Jaschek 1982) and a member of the Pleiades cluster. Hαemission was first detected in 28 Tau by E. C. Pickering in 1890.
It is known to exhibit prominent long-term spectroscopic variations and cyclic changes in its spectrum from a Be phase to a Be-shell phase since the 19th century. Since 1938, an alternation of Be-shell and Be phases has been reported with a 35-36 years cycle. A comprehensive summary of observations of this star is given by Hirata (1995) and Hirata et al. (2000). The variations of the spectrum of 28 Tau from 1938 to 1975 have been described in detail by Gulliver (1977) who give a well documented bibliography of the star. Because of the periodic changes of the spectral characteristics of a Be phase to a Be-shell phase (and back), and because the disk is not in the equatorial plane “for some reason” (probably caused by the companion star in the periastron) but slanted to the equator and precesses around the central star, corresponding variations of the Hα line profile are observable (Hummel, 1998).
The observation and study of the Hαemission line and its profile of this binary system reveals at least five types of variability:
1. the equivalent width (EW) 2. the red and blue line wings
3. the intensity ratio of the V to R component of the Hα line profile (V/R) 4. the radial velocity (RV)
2 IBVS6239
5. the central absorption depth (CA).
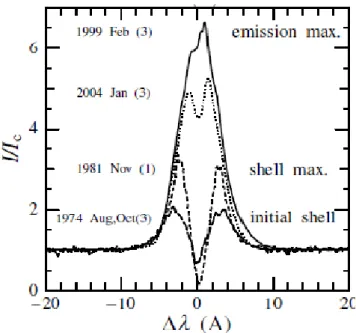
Figure 1 shows the variation of the Hα line profile at some typical epochs:
1974: the early shell phase 1981: the shell maximum phase
1999: the Be phase with maximum emission 2004: the Be phase.
One can readily see that the profiles changed from the edge-on type (shell-line profile) to the surface-on type (wine-bottle type), implying that the disk inclination angle changed significantly.
Katahira et al. (1996) analysed shell RV’s from the two consecutive shell phases separated by some 34 years, and concluded that 28 Tau is a spectroscopic binary with an orbital period of 218 days. The forming of a new disk and its observation of the Hα EW and the line wings between November 2005 and May 2007 have been impressively documented by Katahira et al. (2006), Tanaka et al. (2007) and Iliev (2000). The ARAS spectroscopy community (http://www.astrosurf.com/aras/) has been investigating the change of the V/R ratio and the radial velocity of the Hα double peak profile since 2012 (Pollmann 2015). The RV results in that investigation were very well in agreement with that of Katahira et al. (1996) and Nemravova et al. (2010).
Figure 1. Variation of the Hαline profile at some typical epochs (with friendly permission of R.
Hirata, 2007)
But the question regarding point 5 is, how can we understand the causes of the vari- ability of the Hα CA?
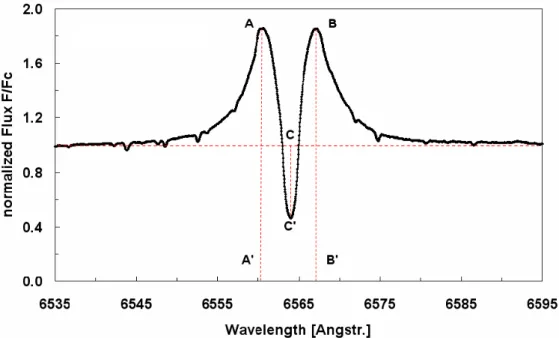
The depth of the Hα CA is defined as the difference between the local continuum level (equal to unity) and the minimum value at the line minimum intensity (Fig. 2). While the Hα emission line samples the disk as a whole, the region probed by the shell lines, represented by the depth of the central absorption CC’, is restricted to the line of sight.
Figure 2. Measured quantities illustrated on an Hαline profile: (AA’) and (BB’) emission peaks, depth of the central absorption (CC’). The horizontal line marks the normalized continuum.
The diagnostics they provide should not be ignored, as their properties (absorption depth) reflect the structure and dynamics of the disk in the observer’s direction.
In the literature it is assumed (Schaefer et al. 2010) that the changes in CA is caused by a different angle or density distribution of the disk plane with respect to the observer’s line of sight, as a consequence of the disk precession around the primary star. Since 28 Tau is a binary, any tilt or change in the projected position angle of the disk may be modulated by the tidal force of the companion.
2 Observation and results
For the investigation presented here, 272 representative spectra of the time span October 2004 (JD 2453300) to March 2018 (JD 2458185; end of this investigation period) were taken from the BeSS database. The Hα spectra were obtained with 0.2 m to 0.4 m tele- scopes with a long-slit (in most cases) and echelle spectrographs with resolutions of R
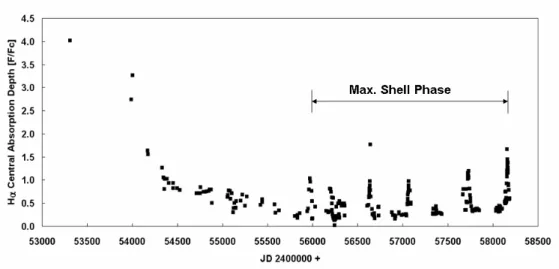
= 10000-20000. All spectra included the 6400-6700 region, with a S/N of 100 for the continuum near 6600 ˚A. The spectra have been reduced with standard professional proce- dures (instrumental response, normalisation, wavelength calibration) using the program VSpec and the spectral classification software package MK32. Figure 3 shows the CA time behaviour from October 2004 to March 2018.
The time span from October 2004 (approx. JD 2453300) until August 2011 (JD 2455800) was dominated by the behavior after the formation of a new disk and the cor- responding decrease of the EW and the CA. Noteworthy in Fig. 3 is that the periodic CA variability seen from JD 2455900 until today (March 2018) was not observed in the period prior to at least October 2004.
Activity phases of the star, in which the disk precession as a consequence of the perias- tron passages of the companion, causes pronounced changes in the RV and the V/R ratio
4 IBVS6239
(Pollmann, 2015), as well as the central absorption depth CA. These are called “maximum shell phase” (Hirata, 2007).
Figure 3. Central absorption depth of the Hαemission in 28 Tau. Amateur spectra of the BeSS Database since October 2004 (JD 2453300) after the HαEW maximum to March 2018 (JD 2458185)
(CA measurement accuracy±5%).
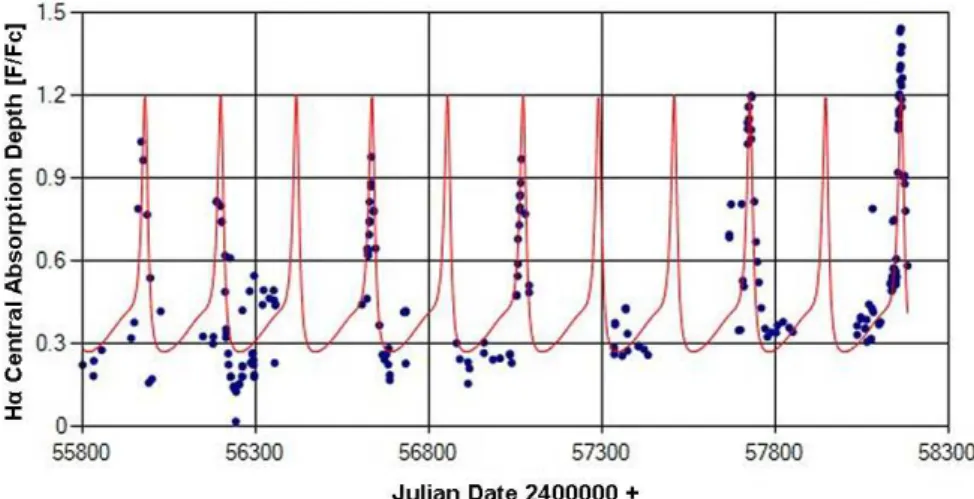
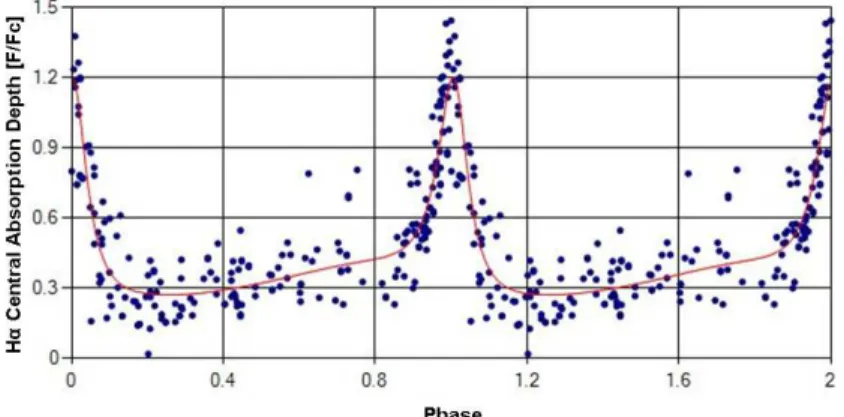
Figure 4 shows the CA variability during the maximum shell phase since approx. JD 2455900 to JD 2458185 (March 2018). Next we complete a period analysis and these results are shown in Figures 5 and 6.
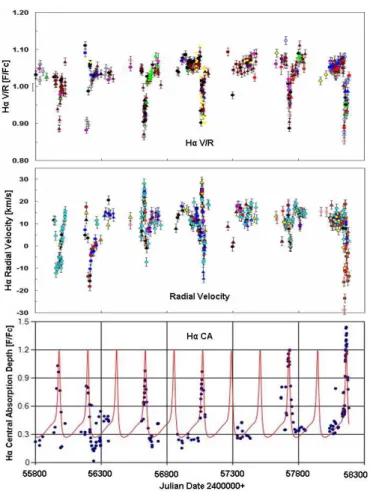
The period analysis of the CA time series data in Fig. 4 was performed with the use of the program AVE (Barbera 1998), and produced the Scargle periodogram with the discriminant factor plotted in Fig. 5 and the phase diagram in Fig. 6. This period of 218.6 days is exactly in agreement with the period of the V/R ratio and the radial velocity found by Pollmann (2015). The exact coincidence of the CA maxima with the minima of V/R and RV (shown in Fig. 7) as a result of disk precession has never before been observed during the maximum shell phase in the years around 1980, or during the initial shell phase around August/October 1974. It is known that the precession of the disk depends on its size (radius) and its mass due to gravitational effects (Katz et al. 1982, Larwood et al. 1996, Lubow & Ogilvie 2001).
It is interesting to locate the time section of the periodic CA variability in Fig. 4 in the long-term monitoring of the Hα EW in Fig. 8. Here we adopt the convention that positive Hα EW is the flux above the continuum. It is noticeable that this time section coincides approximately with an EW range, in which the disk has largely minimal mass
Figure 4. Central absorption depth of the Hαemission in 28 Tau. Max. shell phase since approx. JD 2455900 to JD 2458164 (February 2018)
Figure 5. Periodogram of the CA time series data in Fig. 4
6 IBVS6239
Figure 6. Phase diagram for the 218.6 day period shown in Fig. 5
and/or minimum density, volume or size. The relatively strong and rapid EW variation during this time may be due to the frequency of observations which were able to capture these changes.
Because of the well-known relationship between mass and precession in a spinning top, it might be interesting to see if the disk’s expected increase in size and volume over the next few years will change the precession period of 218.6 days.
We plan to continue this interesting project as collaboration with professional experts.
The more ARAS observers that are willing to take part in this project the larger the database we will have to find out a possible link between the CA period to the typically disk parameters (size, volume, mass, density). Also the monitoring of the periodic V/R variability, which reflects the libration of the disk rotational axis — as it has been found at the Be binary zeta Tau (Pollmann, 2017), will be part of further studies.
Acknowledgements: I am grateful for the ARAS spectroscopy group collaboration. I am also grateful to the referee Prof. Carol Evelyn Jones for her helpful suggestions as well Sara and Carl Sawicki (Alpine, Texas) for their improvements in language. The following observers of the ARAS group contributed with their spectra in the BeSS database:
Th. Garrel, C. Sawicki, J. Montier, J. S. Devaux, M. Pujol, M. Leonardi, V. Desnaux,P.
Berardi, Ch. Buil, K. Graham, St. Ubaud, B. Mauclaire, H. Kalbermatten, F. Houpert,E.
Pollmann, N. Montigiani, M. Mannucci, J. N. Terry, J. Guarro, J. Martin, Th. Lemoult, O. Garde, St. Charbonnel, T. Lester, A. Favaro, Dong Li, P. Fosanelli, A. de Bruin, B.
Hanisch, A. Heidemann, E. Bertrand, E. Barbotin, J. Foster, J. Ribeiro, O. Thizy, E.
Bryssinck, A. Halsey.
References:
Barbera, R., 1998, AVE code, version 2.51, http://www.gea.cesca.es Gulliver, A. F., 1977, ApJS, 35, 441 DOI
Figure 7. Illustration of the exact temporal coincidence of the HαV/R ratio (top), the radial velocity, (middle) and the central absorption depth, (bottom) in the time period JD 2455900 to 2458185
Figure 8. Long-term monitoring of the HαEW in 28 Tau since October 1953 by the following observers (the measurements accuracy of the EW determination of the amateur observations since JD
2450840, January 1998 is±5%)
8 IBVS6239
Hirata, R., 1995,PASJ, 47, 195
Hirata, R., Shimada, M. R., Masuda, S., 2000, ASP Conference Series, 214, 558 Hirata, R., 2007,ASP Conference Series, 361, 267
Hoffleit, D., Jaschek, C., 1982, The Bright Star Catalogue, 4th ed. (New Haven: Yale University Observatory )
Hummel, W., 1998, A&A,330, 243
Iliev, L., 2000,ASP Conference Series, 214, 566
Katahira, J., I., Hirata, R., Katoh, M., Ballereau, D., Chauville, J., 1996, PASJ, 48, 317 DOI
Katahira, J., Narusawa, S., Okazaki, S., Inoue, K., Kawabata, Y., Sadakane, K., Hirata, R., 2006, Be Star Newsletter,38
Katz, J. I., Anderson, S. F., Grandi, S. A., Margon, B., 1982, ApJ, 260, 780, DOI Larwood, J. D., Nelson, R. P. , Papaloizou, J. C. B., Terquem, C. , 1996, MNRAS, 282,
597 DOI
Lubow, S. H., Ogilvie, G. I., 2001, ApJ, 560, 997 DOI Pollmann, E., 2015, IBVS, 6199 DOI
Pollmann, E., 2017, IBVS, 6208 DOI
Nemravova, J., Harmanec, P., Kubat, J., Koubsky, P., Iliev, L., Yang, S., Ribeiro, J., Slechta, M., Kotovka, L., Wolf, M., Skoda, P., 2010, A&A, 516, A80 DOI
Schaefer, G. et al., 2010,AJ, 140, 1838, DOI
Tanaka, K., Sadakane, K., Narusawa, S., Y., 2007, PASJ, 59, L35 DOI