Photodecomposition of formic acid on N-doped and metal-promoted TiO
2Production of CO-free H2
Gyula Halasi, Gábor Schubert, Frigyes Solymosi*
Reaction Kinetics Research Group,
Department of Physical Chemistry and Materials Science, University of Szeged
P.O. Box 168, H-6701 Szeged, Hungary
*Corresponding author: fax: +36-62-544-106; e-mail: fsolym@chem.u-szeged.hu
ABSTRACT: The photo-induced vapor-phase decomposition of formic acid was investigated on pure, N-doped and metal-promoted TiO2. The catalysts were characterized by bandgap determination, and by Fourier Transformed Infrared spectroscopy, the bandgap of N-doped TiO2 was narrowed by 0.5-1.02 eV. IR studies revealed that illumination of the HCOOH–
TiO2 system initiated the decomposition of adsorbed formate species. On the IR spectra of metal-promoted TiO2 adsorbed CO attached to the metals was also detected. The photodecomposition of formic acid on pure TiO2 occurs to only a limited extent to yield H2
and CO2 as the major products with a small amount of CO. Depending on the origin of TiO2
and on the preparation, N-doped TiO2 exhibited higher activity. Its efficiency is increased with the narrowing of the bandgap, a feature attributed to the prevention of electron-hole recombination. The deposition of noble metals on pure and N-modified TiO2 dramatically enhanced the extent of photodecomposition of formic acid. Pd/TiO2 was found to be the most active catalyst. Addition of water to formic acid completely eliminated the small amount of CO formed. Both the N-doped TiO2 and metal-promoted TiO2+N samples exhibited photocatalytic effect even in visible light. The promoting effect of metals was explained by a better separation of charge carriers induced by illumination and by improved electronic communication between metal particles and TiO2.
Keywords:
Photodecomposition of formic acid TiO2 photocatalyst
N-doped TiO2
metal promoted TiO2
1. INTRODUCTION
The production of CO-free hydrogen for fuel cells is a great challenge for catalysis.
Unfortunately the decomposition of alcohols and ethers produces a large amount of CO.1-3 The level of CO can be lowered by the subsequent water-gas shift reaction, but the complete elimination of CO can not be achieved. A more promising compound is formic acid, which as a source of H2 has received attention only recently.4-8 This decomposition proceeds in two directions:
HCOOH = H2 + CO2 : ΔG = -48.4 kJ mol-1 (1) and
HCOOH = H2O + CO : ΔG = -28.5 kJ mol-1 (2) If the temperature is low enough, the occurrence of secondary reactions can be excluded, such as the hydrogenation of CO2 and CO to CH4, which is well catalyzed by supported Pt metals.
CO-free H2 was obtained, however, only on few catalysts at 423-473 K. Ojeda and Iglesia4 have shown that isolated Au species on Al2O3 and TiO2 can be used as an in situ source of H2 from formic acid at high chemical potential. Mo2C prepared by the reaction of MoO3 with a multiwall carbon nanotube and carbon Norit proved also an excellent and stable catalyst for the production of H2 free of CO.5 Ross et al.6 discovered that Pd/C is a more active catalyst than Au/TiO2 for the decomposition and reforming of formic acid, with selectivities of 95-99% at >400 K. In the study of the effects of different supports (SiO2, Al2O3, ZSM-5, CeO2 and carbon), pure, CO-free H2 was obtained over Au/SiO2 and Au/CeO2 at and below 473 K.7 In a recent comparative study we found that Pt metals supported by carbon Norit are also effective catalysts in the vapor-phase decomposition of formic acid to generate H2 with 95-99% selectivity.8 H2 completely free of CO was obtained in the reforming reaction of formic acid on Ir/Norit catalyst at 383-473 K.
In the present work we examine the photolysis of HCOOH on N-, F-doped and Pt metal- promoted TiO2 with the aim to select the most active photocatalyst and establish experimental conditions under which H2 can be produced in high yield and virtually free of CO. In our recent study we found that the photodecomposition of ethanol on pure TiO2 occurs to a very limited extent.9 N-doped TiO2 exhibited higher activity, and the deposition of Rh on pure and doped TiO2 dramatically enhanced the extent of the photodecomposition of ethanol, yielding H2, CH3CHO, CO and CH4 even in visible light. Photodecomposition of HCOOH on different solids has been the subject of only relatively few studies.10-16 The works of Falconer et. al10,16 deserve special attention, who studied the effect of water on the adsorption and photocatalytic
reaction of formic acid using transient reaction experiments and FTIR spectroscopy. It was found that water dramatically affected the form of adsorbed formate on TiO2.
2. EXPERIMENTAL SECTION
2.1. Methods. Photocatalytic reaction was followed in a thermostatically controllable photoreactor equipped with a 15 W germicide lamp (type GCL 307T5L/CELL, Lighttech Ltd., Hungary) as light source. This lamp emits predominantly in the wavelength range of 250-440 nm. Its maximum intensity is at 254 nm. For the visible photocatalytic experiments another type of lamp was used (Lighttech GCL 307T5L/GOLD) with 400-640 nm wavelength range and two maximum intensities at 453 and 545 nm. We note that this lamp also emits below 400 nm. The approximate light intensity at the catalyst films are 3.9 mW/cm2 for the germicide lamp and 2.1 mW/cm2 for the other lamp. The reactor (volume: 670 ml) consists of two concentric quartz glass tubes fitted one into the other and a centrally positioned lamp. It is connected to a gas-mixing unit serving for the adjustment of the composition of the gas or vapor mixtures to be photolyzed in situ. The length of the concentric tubes was 250 mm. The diameter of outer tube was 70 mm, and that of the inside tube 28 mm long. The width of annulus between them was 42 mm, and that of the photocatalyst film was 89 mm. Formic acid (~1.3%, 580 μmol) was introduced in the reactor through an externally heated tube avoiding condensation. The carrier gas was Ar, which was bubbled through formic acid at room temperature. The gas-mixture was circulated by a pump. The reaction products were analyzed with a HP 5890 gas chromatograph equipped with PORAPAK Q and PORAPAK S packed columns. The sampling loop of the GC was 500 μl. The amount of all products were related to this loop.
In the determination of the band gaps of the samples we applied the same procedures as described in our previous paper.9 Diffuse reflectance spectra of TiO2 samples were obtained relative to the reflectance of a standard (BaSO4) using an UV/Vis spectrophotometer (OCEAN OPTICS, Typ.USB 2000) equipped with a diffuse reflectance accessory. The surface area of the catalysts were determined by BET method with N2 adsorption at ~100 K.
The dispersion of metals was calculated from the amount of strongly adsorbed hydrogen at 300 K. For FTIR studies a mobile IR cell housed in a metal chamber was used. The sample can be heated and cooled to 150-200 K in situ. The IR cell can be evacuated to 10-5 Torr using a turbo molecular pumping system. The samples were illuminated by the full arc of a Hg lamp
a quartz tube (10 cm length) filled with triply distilled water applied at the exit of the lamp.
The filtered light passed through a high-purity CaF2 window into the cell. The light of the lamp was focused onto the sample. After illumination, the IR cell was moved to its regular position in the IR beam. Infrared spectra were recorded with a Biorad (Digilab. Div. FTS 155) instrument with a wavenumber accuracy of ±4 cm-1. All the spectra presented in this study are difference spectra.
2.2. Materials. For the preparation of N-doped TiO2 we applied several methods.
Following the description of Beranek and Kisch,17 titania powder (Hombikat, UV 100, 300m2/g) was placed into 230 ml Schlenk tube connected via an adapter with 100 ml round bottom flask containing 1 g of urea and heated in a muffle oven for 30 min at different temperatures. This sample is noted with “SK”. In other cases TiO2 was treated with NH3. Following the method of Yates et al.18 Hombikat TiO2 powder was heated in a flow reactor system in argon gas atmosphere up to 870 K. The heating rates were 7 K/min. For doping, the argon flow was replaced by NH3 for 30 min, after the target temperature had been reached.
Subsequently, the powder was kept in flowing argon for 1 h at 870 K and then cooled in flowing argon over a time period of 2-3 h to room temperature. This sample was marked
“SY”. N-modified TiO2 sample (named “SX”) was also produced following the description of Xu et al.19 Titanium tetracloride was used as a precursor. After several steps the NH3-treated TiO2 slurry was vacuum dried at 353 K for 12 hr, followed by calcination at 773 K in flowing air for 3 hr. In the preparation of F-doped TiO2, we followed the method of Todorova et al.20 The starting material was Ti(C2H5O)4 which was treated with NH4F at different temperatures.
This sample is noted with “SF”. The incorporation of fluorine ion into titania also influenced the defect structure of TiO2.20,21 Metal-promoted TiO2 samples were prepared by impregnation of pure and various N-doped titania in the solution of metal salts: H2PtCl6:6H2O, Pd(NO3)2, RhCl3.3H2O, H2IrCl6 and RuCl3.3H2O. The suspension was dried at 373 K and annealed at 573 K for 1 hour. For photocatalytic measurements the sample (70-80 mg) was sprayed onto the outer side of the inner tube from aqueous suspension. The surface of the catalyst film was 168 cm2. For IR studies the dried samples were pressed in self-supporting wafers (30 x 10 mm
~10 mg/cm2). The catalysts were oxidized at 573 K and reduced at 573 K in the IR cell or in the catalytic reactor for 1 hr. HCOOH was the product of BDH with purity of 99.5%.
3. RESULTS
3.1. Characterization of the samples. In the determination of bandgap energies, Eg, we followed the method and calculation procedure described by Beranek and Kisch.17 The
Kubelka-Munk function F(R∞) vs. wavelength curves were obtained from diffuse reflectance data, and the equation α = A(hν – Eg)n/hν was used in the calculation, where α is the absorption coefficient, A is a constant, hν is the energy of light and n is a constant depending on the nature of the electron transition.22 Assuming an indirect bandgap (n = 2) for TiO2,23 with α proportional to F(R∞), the bandgap energy was obtained from the plots of [F(R∞)hν]1/2 vs. hν, as the intercept at [F(R∞)hν]1/2 = 0 of the extrapolated linear part of the plot (Figure 1).
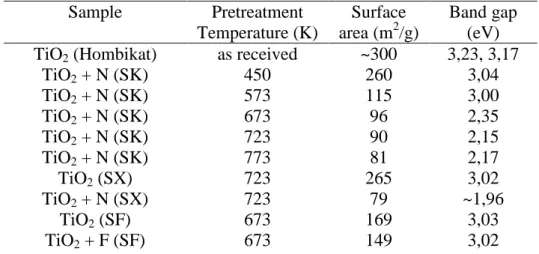
As we used the same samples as in our previous work,9 we determined the band gaps only when new samples were prepared. As one can see from the data presented in Table 1, the incorporation of N into TiO2 decreased the band gap of pure TiO2, and its extent increased with the rise of the modification temperature. The lowest value, 2.17 eV, was obtained for TiO2 + N sample annealed at 723-773 K. We found smaller red shifts for N-doped TiO2
prepared by the reaction of TiO2 with NH3 and also very little changes in the case of F- modified TiO2.
N-doped TiO2 (sample SK) was also examined by FTIR measurements. The spectrum revealed that several adsorbed species remained on the solid surface after preparation, yielding intense absorption bands in the ranges 1900-2300 and 1300-1700 cm-1 (Figure 2A).
The positions of the bands and their intensities slightly changed with the pre-treatment temperature of the samples, and could not be eliminated by treating the oxide with oxygen at different temperatures. No such bands were observed for TiO2 + N samples prepared by the reaction of TiO2 with NH3 (SX and SY).
Previous XPS measurements of the N-doped TiO2 (SK) showed only slight shifts in the binding energies (BE) of Ti2p and N1s for samples prepared at different temperatures.9 Treatment of the N-doped TiO2 in vacuum at various temperatures also resulted in very minor changes in the XPS spectrum. Spectra obtained after oxidation of the samples at different temperatures showed that the binding energy (BE) for Ti2p2/3 at 459.0 eV shifted slightly to lower energy with elevation of the temperature. The BE for N1s also moved lower with the temperature. In the C1s region: a very intense peak was observed at 285.1 eV and a shoulder at 288.0 eV, supporting the presence of carbon in the surface layer. A considerable decay in the BE of C1s 288.0 eV occurred only at 673 K. The results of elemental analysis of Beranek and Kisch17 (carried out by Carlo Erba, CHNSO, E.A.1108 equipped with a pyrolysis unit for oxygen analysis) revealed that beside N, its maximum amount was 11.8% in the sample modified 773 K, 5.8% carbon has been also incorporated in the surface layer of TiO2. Accordingly this C also contributes to the lowering of the band gap of TiO2.
3.2. FTIR measurements. Exposing pure TiO2 to formic acid produced intense absorption bands at 2959, 2889, 2739, 1557, 1381, 1367and 1292 cm-1 due to molecularly and dissociatively adsorbed formic acid. The position of these absorption features were only slightly influenced by the origin of TiO2. Illumination in the presence of HCOOH vapor resulted no observable change in the IR spectrum. When adsorbed layer was photolyzed a slight attenuation of all the bands occurred without any significant change in their position. A weak spectral feature developed at 1412 cm-1 already at the beginning of irradiation, its intensity remained unaltered with the prolonged illumination. This band is very likely due to dioxymethylene24,25 formed in the photodecomposition of formate species. The situation was more complex with N-doped TiO2. As was founded in our previous work9 dealing with the photolysis of ethanol the N-doped sample (SK) exhibited several intense absorptions features in the ranges 1900-2300 and 1300-1700 cm-1 indicating the presence of CN-containing compounds.26 As a result the adsorption of formic acid on these samples gave only relatively weak absorption bands in the range of 1200-1600 cm-1. No such a feature was experienced with samples noted SY and SX. Illumination of adsorbed HCOOH on these samples under continuous degassing resulted in a rapid initial attenuation of all bands without appreciable alteration in their location. In Figure 2A we demonstrate this by showing the spectra obtained for pure TiO2.
Similar spectroscopic measurements were performed with metal-promoted TiO2 samples.
When the illumination was carried out in the presence of HCOOH vapor as in the photocatalytic experiments, absorption features also appeared in the CO stretching region, between 2030-2100 cm-1 besides the strong formate bands at 1594-1534 and 1376-1363 cm-1 determined for metal-free TiO2. We obtained similar picture when the adsorbed HCOOH was illuminated. The position of the CO absorption bands depended on the metals. It was located at 2064 cm-1 for Pt/TiO2, 2086 cm-1 for Pd/TiO2 and 2086 and 2020 cm-1 for Ru/TiO2, 2070, 2040 and 2015 cm-1 for Ir/TiO2 and 2054 cm-1 for Rh/TiO2 with two strong shoulders at 2091 and 2039 cm-1. Selected IR spectra are presented in Figure 2B and C. With the increase of the illumination time, the intensities of all these bands grew to different extent. This is illustrated in Figure 2D, where the intensities of linearly bonded CO are plotted. In contrast, the bands due to formate only slowly attenuated. Repeating these measurements at ~200 K, a new absorption band was also identified at 1728 cm-1 due to moleculary adsorbed HCOOH. As a result of irradiation no or only very weak absorption bands appeared in the CO stretching region at 2030-2100 cm-1.
3.3. Catalytic studies. Pure and N-doped TiO2. Whereas formic acid does not decompose at 300-350 K on pure TiO2 (Hombikat), illumination induced the occurrence of the reaction. The main reaction pathway is the dehydrogenation reaction to give H2 and CO2, but the dehydration of formic acid also occurred. The extent of decomposition was about
~17% in 100 min. Similar features were experienced on N-doped TiO2 (SK). As observed in the photodecomposition of ethanol,9 the amount of H2 was always less than that of CO2. In Figure 3, we plotted the conversion of formic acid, the formation of CO2 and CO. As the surface area of TiO2 markedly lowered by doping with N (Table 1), the data presented in Figure 3D are related to unit surface area. Accordingly the incorporation of N into TiO2
(sample SK), appreciably enhanced the extent of photodecomposition of formic acid, and its positive influence increased with the rise of the modification temperature of N-doped TiO2. We also examined the photocatalytic effect of TiO2+N samples using other preparation methods noted SY and SX.18,19 The sample (SX) exhibited the highest photoactivity, which increased with N-doping. An important behavior of these TiO2 samples is the absence of CO in the decomposition products. We performed detailed measurements on F-doped TiO2 (SF).
We found only minor increase in the conversion of formic acid and in the formation of products compared to those determined on pure TiO2 using the same preparation.20
Effects of metals. In further experiments, we examined the effects of various Pt metals on TiO2 (Hombikat) on the photodecomposition of formic acid. The deposition of Pt metals on TiO2 dramatically enhanced its photoactivity. In Figure 4 we displayed the conversion of formic acid and the amount of products formed on various catalysts as a function of illumination time. Whereas the conversion of formic acid on pure TiO2 in 100 min was about 17.0% (Figure 3A), in the presence of 2% metals it approached 35-100%. The dehydrogenation reaction remained the main reaction pathway. In this case, the amount of CO2 agreed very well with that of H2. Interestingly, the evolution of CO occurred only when most of the formic acid had been reacted.
The influence of water on the photolysis of HCOOH was also investigated. Water exerted no or only very slight alteration on the conversion of photo-decomposition of HCOOH.
However, while in the absence of water, CO was released mainly near the completion of decomposition, the evolution of this CO was completely eliminated by the presence of H2O.
An exception was the Pd/TiO2 when water only decreased the amount of CO formed. This is shown in Figure 5.
Based on the conversion data, Pd was found to be the most active metal followed by Pt, Ir, Rh and Ru. When the rate of H2 production is related to the dispersity of the metals, we obtained somewhat different order: Pt-Pd-Ru-Rh-Ir (Table 2).
In order to judge the contribution of thermal effect for the photoreaction we also examined the thermal reaction on the Rh/TiO2 used for photolysis. We detected merely very slight decomposition (~1-2%) at 300 K. A measurable reaction (5-10% in 60 min) was observed only at 373 K. Attaching a thin thermocouple in the catalyst layer indicated only a temperature rise of only a few degrees during illumination. The results of these control experiments lead us to exclude the contribution of thermal effects to the decomposition of formic acid induced by illumination.
As in the case of the TiO2, the photolysis of formic acid on metal-promoted oxide was also enhanced, when metals were deposited on N-doped TiO2. Best results were obtained for TiO2 (SX) samples. The photoactivity of metals was appreciably higher than that measured on N-free samples. This is illustrated by the results determined for Rh-containing samples in Figure 6.
Photolysis in visible light. As the incorporation of N into TiO2 narrows the bandgap of TiO2, which allows TiO2 to absorb light at higher wavelengths, measurements were performed with the use of a lamp emitting in the visible range. These experiments were carried out with TiO2 (SX), which possesses better performance. The results presented in Figure 7 show that, whereas pure TiO2 exhibits very moderate activity in the visible light, the photoactivity of N-doped sample (SX) is significantly higher. Similar features were experienced in visible light for metal-promoted N-doped TiO2. Figure 8 depicts the photocatalytic effects of three metals deposited on pure TiO2 and N-doped TiO2 (sample SX).
A comparison immediately reveals that the photoactivity of the metals on N-doped sample is markedly higher than that of M/TiO2 free of nitrogen. This is reflected in the conversion of formic acid and in the amounts of the products formed in the photo-induced decomposition.
4. DISCUSSION
4.1. Pure and doped TiO2. The decomposition of formic acid was widely used as a model reaction in the 1950s and 1960s to test the roles of the electronic properties of various oxides and metals.27-32 A huge number of data suggested the importance of the electronic factor in the decomposition of formic acid on different oxides and metals.27-32 Later, more emphasis was given to the formation and stability of formate on catalyst surface. Those solids
were found to be the best catalyst on which the surface complex was formed easily, but was not very stable.8,32-41
Following the adsorption of HCOOH on pure TiO2 we detected several absorption bands.
The most important spectral features are the vibrations at 1594-1534 and 1376-1363 cm-1 due to formate species. This suggest the occurrence of the dissociation of formic acid
HCOOH(g) = HCOOH(a) ) (3)
HCOOH(a)) = HCOO(a)) + H(a) (4)
which does not need illumination. When the sample was degassed after HCOOH adsorption the formate bands remained stable even at 573 K. As a result of illumination, however, initially a rapid then a slow attenuation of these bands occurred suggesting the decomposition of adsorbed formate (Figure 2). Interestingly we obtained only very weak absorption bands due to formate after adsorption of HCOOH on N-doped TiO2 (SK) independently of the calcination temperature. This is very likely due the strongly bonded species remained on the surface after preparation of N-doped TiO2 using urea. Their presence is indicated by the intense absorption bands at 2186-2199 cm-1,2090-2150 cm-1 and 1300-1700 cm-1. Taking into account our previous IR studies on TiO2 catalyst26 the band at 2186-2199 cm-1 can be attributed to the vibration of NCO, while the band at 2090-2150 cm-1 to that of CN. Both surface species were found to be quite stable on TiO2. The weak absorption feature at ~1618 cm-1 is ascribed to the bonding mode of NH vibration. It is very likely that these strongly adsorbed species occupying the active centers on TiO2 decreased the extent of the dissociation of HCOOH and the generation of formate group. Nevertheless the photodecomposition of formic acid proceeded even on these N-doped TiO2. This feature was not observed on other TiO2+N catalysts prepared by different methods. In this case, however, the band gap of TiO2 was lowered only to smaller extent.
The effect of illumination on the decomposition of formic acid is well demonstrated by the catalytic measurements (Figure 3). Illumination of the HCOOH -TiO2 system initiated the decomposition of formic acid even at room temperature. Accepting the view that the decomposition of formic acid proceeds through the formation and decomposition of formate species, the effect of the illumination is attributed to the donation of a photoelectron formed in the photo-excitation process:
TiO2 + hv = h+ + e- (5)
to the formate species
HCOO(a) + e- = HCOO(a))δ-
(6)
HCOO(a))δ- = CO2(a)δ- + H(a) (7) CO2(a) δ- + h+ = CO2(g) (8) The small amount of CO in the products suggests that the dehydration of formic acid also occurs to a limited extent
2HCOO(a) δ-
= CO(a) + 2OH δ-(a) (9)
As indicated by the amount of CO2 related to surface area of N-doped TiO2 (Figure 3D), the rate of photolysis of formic acid is markedly increased with the pre-treatment temperature of N-doped sample, e.g with the narrowing of the band gap of TiO2. This can be explained by the prevention of electron-hole recombination. It was a general observation that the amount of H2 was much less than that of CO2. We experienced the same behavior in the photo- decomposition of ethanol on TiO2.9 We assume that besides the reduction process a fraction of H2 reacts with the surface species produced by the preparation of TiO2+N samples. The adsorbed hydrogen may reduce the TiO2 surface or react with surface oxygen to yield OH groups.
The positive influence of the narrowing the bandgap of TiO2 appeared in the results obtained in visible light. Whereas pure titania exhibited only a very slight photoactivity in this range of wavelength, it was appreciably enhanced on N-doped TiO2 (Figure 6). In harmony with this doping TiO2 with fluorine, which did not change the bandgap of TiO2 (Table 1), exerted no positive influence of the photocatalytic behavior of TiO2.
4.2. Metal promoted TiO2. In our recent study on the thermal decomposition of formic acid on carbon supported Pt metals showed that the reaction started above 350 K and was complete at 473-523 K.8 The main process was the dehydrogenation reaction, CO was formed only in 2-7% at lower temperatures. The high activity of supported metals is in harmony with those obtained on metal single crystal surfaces in UHV system.42-44 As was expected the deposition of Pt metals onto TiO2 markedly enhanced the photoactivity of TiO2. Following the adsorption of formic acid on TiO2-supported metals by IR spectroscopy we obtained the same absorption features due to formate species as in the case of pure TiO2, which may suggest that formate is formed on TiO2 of large surface area.
An open question is whether we can also count with formate species bonded to the metals.
An answer to this question was obtained recently by using SiO2 as a support, on which no dissociation of formic acid proceeds.8,34-36,40,41
Detailed IR study indicated that formate species does exist on the metals, and depending on their nature, it completely decomposes at 290-373 K.9 These spectroscopic measurements have been presently repeated with the most
effective Pd and less effective Ru in the photodecomposition of formic acid. In the first case the formate band was eliminated at 320 K, and in the second case at 330 K.
All these measurements suggest that we can also count with the presence of formate bonded to the metals at 300 K, in addition to the species attached to TiO2 support. The low stability of formate species attached to the metals is indicated by the appearance of CO absorption bands following the admission of formic acid into the cell even before the photolysis (Figure 2). Illumination enhanced their intensities to different extents (Figure 2D).
In the case of Pt and Pd, the CO band can be attributed to the linearly bonded CO, whereas in other cases the more complex spectra suggest formation of dicarbonyl species, M+(CO)2 as a result of the oxidative disruption of metal nano particles.45-48
Accordingly, we may assume that in the photolysis of formic acid on metal-promoted TiO2 the reaction, consisting of formation and decomposition of formate, primarily proceeds on metal surfaces. The contribution of the photodecomposition occurring on TiO2 is very slight even in the case of less active catalysts, Ru/TiO2. As in the thermal reaction at higher temperatures, the dehydrogenation of formic acid remained the major process in the photo- induced decomposition at 300 K. With the exception of Pd/TiO2 CO only evolved when the total decomposition of formic acid was achieved. We assume that the release of a fraction of the adsorbed CO detected by IR spectroscopy is responsible for the appearance of gaseous CO. Au important observation is that adding water to formic acid this CO was completely eliminated very likely due to the occurrence of the water-gas shift reaction. This is illustrated by the results shown in Fig. 5.
As concerns the explanation of the large effect of metals on the photoreaction of formic acid, it should be borne in mind that Pt metals are very active catalysts for the thermal decomposition of formic acid at higher temperature. This is mostly attributed to facilitation of the rupture of the C-H bond in the formate species attached to the metals. The promoting effect of metals deposition on TiO2 has been observed in a number of photoreactions.49-51 It was explained by a better separation of charge carriers induced by illumination and by improved electronic communication between metal particles and TiO2.49-51 We believe that the electronic interaction between the metal and n-type TiO2 of different work functions also plays a role in the enhanced photoactivity of M/TiO2 catalysts. The effect of such electronic interaction in the activity of a supported metal catalyst was first established in the case of the decomposition of formic acid on Ni/TiO2, when TiO2 was first used as a support.30,31 Later it was demonstrated in the hydrogenation of CO and CO252,53
and in the photocatalytic reaction
doping with altervalent cations influenced the activation energy of the decomposition of formic acid. It also exerted a well appreciable influence on the specific activities of the metals in the case of hydrogenation of CO2 and CO. We assume that the illumination enhances the extent of electron transfer from TiO2 to metals at the interface of the two solids, leading to increased decomposition of formic acid. The work function of TiO2 is 4.6 eV, which is lower than that of Pt metals. The fact that the most active metals posses the largest work function (Table 2) may support this conclusion.
The dramatic influence of metal deposition was also established on N-doped TiO2 in visible light (Figure 8). The photodecomposition of formic acid clearly occurred at faster rate on Pt, Pd and Ir deposited on N-doped TiO2 compared to that measured on undoped samples.
This is reflected in the conversion of formic acid and in the amounts of the products.
CONCLUSIONS
(i) On the modification of TiO2 through incorporation of N species containing carbon markedly narrowed its bandgap.
(ii) Doping TiO2 with N greatly increased its photoactivity in its reaction with formic acid.
(iii) The deposition of Pt metals on pure or N-doped TiO2 markedly enhanced the photodecomposition of formic acid to produce H2 and CO2. CO evolved mostly when the complete decomposition of formic acid was achieved.
(iv) With the exception of Pd/TiO2 adding water to formic acid completely eliminated the release of CO on all metal-promoted TiO2 catalysts.
(v) Lowering the bandgap of TiO2 through N incorporation facilitated the photolysis of formic acid on both TiO2 and metal-containing TiO2 in visible light.
ACKNOWLEDGEMENT
This work was supported by the grant OTKA under contract number K 81517.
The publication/presentation is supported by the European Union and co-funded by the European Social Fund. Project title: “Broadening the knowledge base and supporting the long term professional sustainability of the Research University Centre of Excellence at the University of Szeged by ensuring the rising generation of excellent scientists.”
Project number: TÁMOP-4.2.2/B-10/1-2010-0012
The authors express their thanks to Dr. T. Bánsági for preparation of some samples and to Dr. D. Sebők for some spectroscopic experiments. A loan of TiO2 (Hombikat) from Sachtleben, Germany is gratefully acknowledged.
Table 1. Some characteristic data for pure and N-modified TiO2
Sample Pretreatment
Temperature (K)
Surface area (m2/g)
Band gap (eV) TiO2 (Hombikat) as received ~300 3,23, 3,17
TiO2 + N (SK) 450 260 3,04
TiO2 + N (SK) 573 115 3,00
TiO2 + N (SK) 673 96 2,35
TiO2 + N (SK) 723 90 2,15
TiO2 + N (SK) 773 81 2,17
TiO2 (SX) 723 265 3,02
TiO2 + N (SX) 723 79 ~1,96
TiO2 (SF) 673 169 3,03
TiO2 + F (SF) 673 149 3,02
Table 2. Some characteristic data for the photolysis of formic acid on metal-promoted TiO2
Samples Dispersion (%)
Work function of the metals (eV)
Conversion (%)
TOFH2 and TOFCO2, (s-1)
NH2 NCO2
2% Ru/TiO2 6 4.71 16 0,43 0,37
2% Rh/TiO2 16 4.68 26 0,26 0,29
2% Pt/TiO2 13 5.70 28 0,92 0,86
2% Ir/TiO2 54 5.76 30 0,20 0,19
2% Pd/TiO2 26 5.12 52 0,46 0,47
NH2, NCO2 = the amount of H2 and CO2 formed in 40 min related to the number of metal atoms.
Legend of figures
Figure 1. Bandgap determination using [F(R∞)hv]1/2vs. hv plots (assuming indirect optical transition) for unmodified TiO2 and doped TiO2-N. (A) TiO2 (SX); (B) TiO2+N (SX); (C) TiO2 (SY); (D) TiO2+N (SY); (E) TiO2 (SF); (F) TiO2+F (SF).
Figure 2. Effects of illumination time on the FTIR spectra of adsorbed HCOOH on pure TiO2
(Hombikat) (A), a. 0 min, b. 15 min, c. 30 min, d. 45 min, e. 60 min; Pd/ TiO2 (B), Pt/
TiO2 (C), (B,C): a. 0 min, b. 1 min, c. 3 min, d. 6 min, e. 9 min, f. 12 min, g. 15 min; and on the intensity of the terminal CO bands obtained on different catalysts (D).
Figure 3. Effects of annealing temperature of N-doped TiO2 (SK) on the conversion of HCOOH (A), on the formation of CO2 (B), CO (C) and on the rate of formation of CO2, measured in 200 min of illumination, related to the surface area of the TiO2 + N samples (D).
Figure 4. Photocatalytic effects of Pt metals deposited on TiO2 (Hombikat). Conversion of HCOOH (A), formation of CO2 (B) and H2 (C).
Figure 5. Formation of CO in the photocatalytic decomposition of formic acid in the absence and in the presence of water (HCOOH/H2O ~1). □ without H2O; ■ with H2O.
Figure 6. Effects of N-doping of TiO2 (SX) on the conversion of HCOOH (A), on the formation of H2 (B) and (CO2) (C) over Rh/TiO2. ○ TiO2; * TiO2+N.
Figure 7. Effects of N-doping of TiO2 (SX) on the photocatalytic decomposition of HCOOH in the visible light. (A) and (B) sample (SX); (C) and (D) sample (SY); ○ Pure TiO2; * N- doped TiO2.
Figure 8. Effects of N-doping of TiO2 (SX) on the photocatalytic decomposition of HCOOH in the visible light on 2% Pd/TiO2 (A) and 2% Ir/TiO2 (B) and 2% Pt/TiO2 (C) catalysts. * Conversion; ● H2.
References
(1) Sandstede, G.; Veziroglu, T. N.; Derive, C.; Pottier, J., Eds. Proceedings of the Ninth World Hydrogen Energy Conference; Paris, France, 1972, 1745.
(2) Haryanto, A.; Fernando, S.; Murali, N.; Adhikari, S. Energy & Fuels 2005, 19, 2098- 2106.
(3) Brown, L. F. Int. J. Hydrogen Energy 2001, 26, 381-397.
(4) Ojeda, M.; Iglesia, E. Angew. Chem. Int. Ed. 2009, 48, 4800-4803.
(5) Koós, Á.; Solymosi, F. Catal. Lett. 2010, 138, 23-27.
(6) Bulushev, D. A.; Beloshapkin, S.; Ross, J. R. H. Catal. Today 2010, 154, 7-12.
(7) Gazsi, A.; Bánsági, T.; Solymosi, F. J. Phys. Chem. C 2011, 115, 15459-15466.
(8) Solymosi, F.; Koós, Á.; Liliom, N.; Ugrai, I. J. Catal. 2011, 279, 213-219.
(9) Halasi, Gy.; Ugrai, I.; Solymosi, F. J. Catal. 2011, 281, 309-317.
(10) Muggli, D. S.; Falconer, J. L. J. Catal. 1999, 187, 230-237.
(11) Chen, T.; Wu, G. P.; Feng, Z. C.; Hu, G. S.; Su, W. G.; Ying, P. L.; Li, C. Chinese J.
Catal. 2008, 29, 105-107.
(12) Zhang, Y. J.; Zhang, L. Desalination 2009, 249, 1017-1021.
(13) Arana, J.; González Díaz, O.; Miranda Saracho, M.; Dona Rodríguez, J. M.; Herrera Melián, J. A.; Pérez Pena, J. Appl. Catal. B Env. 2001, 32, 49-61.
(14) Miller, K. L.; Falconer, J. L.; Medlin, J. W. J. Catal. 2011, 278, 321-328.
(15) Liao, L. F.; Wu, W. C.; Chen, C. Y.; Lin, J. L. J. Phys. Chem. B 2001, 105, 7678-7685.
(16) Miller, K. L.; Lee, C. W.; Falconer, J. L.; Medlin, J. W. J. Catal. 2010, 275, 294-299.
(17) Beranek, R.; Kisch, H. Photochem. Photobiol. Sci. 2008, 7, 40-48.
(18) Diwald, O; Thompson, T. L.; Zubkov, T.; Goralski, G.; Walck, S. D.; Yates, J. T. J.
Phys. Chem. B 2004, 108, 6004-6008.
(19) Xu, J.-H., Dai, W.-L.; Li, J.; Cao, Y.; Li, H.; He, H.; Fan, K. Catal. Commun. 2008, 9, 146-152.
(20) Todorova, N.; Giannakopoulou, T.; Vaimakis, T.; Trapalis, C. Mater. Sci. Eng. B 2008, 152, 50-54.
(21) Parc, H.; Choi, W. J. Phys. Chem. B 2004, 108, 4086-4093.
(22) Pankove, J. I., Optical Processes in Semiconductors; Prentience-Hall Inc., New Jersey, 1971.
(23) Tang, H; Prasad, K.; Sanjines, R.; Schmid, P. E.; Levy, F. J. Appl. Phys. 1994, 75, 2042- 2047.
(25) Busca, G.; Lamotte, J.; Lavalley, J. C.; Lorenzelli, V. J. Am. Chem. Soc. 1987, 109, 5197-5202.
(26) Solymosi, F.; Bánsági, T. J. Phys. Chem. 1979, 83, 552-553.
(27) Schwab, G.-M. Discuss. Faraday Soc. 1950, 8, 166-171; Reinäcker, G.; Techel, G. Z.
Anorg. Chem. 1960, 304, 58-72.
(28) Eley, D. D.; Luetic, P. Trans. Faraday Soc. 1957, 53, 1483-1487.
(29) Szabó, Z. G.; Solymosi, F. Acta Chim. Hung. 1960, 25, 145-160.; 161-176.
(30) Szabó, Z. G.; Solymosi, F. Actes Congr. Intern. Catalyse 2e Paris 1961, 1627-1651.
(31) Solymosi, F. Catal. Rev. 1968, 1, 233-255.
(32) Bond, G. C., Catalysis by Metals, Academic London, 1962.
(33) Mars, P.; Scholten, J. J. F.; Zweitering, P. Adv. Catal. 1963, 14, 35-113.
(34) Trillo, J. M.; Munuera, G.; Criado, J. M. Catal. Rev. 1972, 7, 51-86, and references therein.
(35) Iglesia, E.; Boudart, M. J. Catal. 1983, 81, 214-223.
(36) Solymosi, F.; Erdőhelyi, A. J. Catal. 1985, 91, 327-337.
(37) Fein, D. E.; Wachs, I. E. J. Catal. 2002, 210, 241-254.
(38) Chun, W.-J.; Tomishige, K.; Hamakado, M.; Iwasawa, Y. J. Chem. Soc. Faraday Trans.
1995, 91, 4161-4170, and references therein.
(39) Sachtler, W. M. H.; Fahrenfort, J., Actes du Deuxieme Congres Internationale de Catalyse; 1961, p. 831.
(40) Eischens, R. E.; Pliskin, W. A., Actes Congr. Intern. Catalyse 2e Paris; 1961, p. 789.
(41) Mavrikakis, M.; Barteau, M. A. J. Mol. Catal. A Chem. 1998, 131, 135-147.
(42) Madix, R. J. Adv. Catal. 1980, 29, 1-53.
(43) Solymosi, F.; Kiss, J.; Kovács, I. Surf. Sci. 1987, 192, 47-65.
(44) Barteau, M. A. Catal. Letter 1991, 8, 175-184.
(45) Solymosi, F.; Pásztor, M. J. Phys. Chem. 1985, 89, 4789-4793.
(46) Solymosi, F.; Rasko, J. J. Catal. 1989, 115, 107-119.
(47) Solymosi, F.; Novák, É.; Molnár, A. J. Phys. Chem. 1990, 94, 7250-7255.
(48) Berkó, A.; Ménesi, G.; Solymosi, F. J. Phys. Chem. 1996, 100, 17732-17734, and references therein.
(49) Sakthivel, S.; Shankar, M. V.; Palanichamy, M.; Arabindoo, B.; Bahnemann, D. W.;
Murugesan, V. Water Res. 2004, 38, 3001-3008.
(50) Hidalgo, M. C.; Maicu, M.; Navío, J. A.; Colón, G. Appl. Catal. B Env. 2008, 81, 49-55.
(51) Hidalgo, M. C.; Maicu, M.; Navío, J. A.; Colón, G. J. Phys. Chem. C 2009, 113, 12840- 12847.
(52) Solymosi, F.; Erdőhelyi, A; Bánsági, T. J. Catal. 1981, 68, 371-382.
(53) Solymosi, F.; Tombácz, I.; Kocsis, M. J. Catal. 1982, 75, 78-93.
(54) Tombácz, I.; Solymosi, F. Catal. Letts. 1994, 27, 61-65.
Table of Contents Graphic
Photocatalytic effects of Pt metals deposited on TiO2 (Hombikat). Conversion of HCOOH (A), formation of CO2 (B) and H2 (C).