COMPUTER CONTROL OF MAMMALIAN CELL SUSPENSION CULTURES
LASZLO K. NYIRI
Fermentation Design, Inc.
Division of New Brunswick Scientific Co., Inc.
Bethlehem, Pennsylvania
I. INTRODUCTION
Attempts to produce eucaryotic cells of animal origin in vitro resulted in the development of various methods and types of equipment (Telling and Radlett, 1970; Litwin, 1971; VanHemert, 1972; Knazek et al., 1972; Kruse and Patterson, 1973) with different performance characteristics.
The known sensitivity of animal cells to environmental con- ditions requires strict control of the environmental variables
(T, P, p 02, p C 02, pH, nutrient feed, etc.) (Nyiri, 1974). This fact limits the applicability of many of the cell culture ap- paratus and techniques for large scale cell mass production. The most adaptable technique is the cell suspension culture (CSC).
This offers the following advantages:
161
162 L A S Z L O K. NYIRI
(1) Cell growth takes place in three dimensions, therefore, the effect of contact inhibition is reduced.
(2) The basic culture technique is similar to cultivation of microbial cells about which much applicable technical literature exists.
(3) Animal cells with "anchorage dependency" can also be cultured in suspension using microcarriers, and
(4) Scale-up can be easily achieved with respect to space requirements, and unit operation.
Information available on cell suspension cultures to date in- dicate that this technique will be given wider applicability in the future.
The direction of this development raises the question: "What sort of control equipment and techniques are needed to satisfy the handling of such complex processes like animal cell
suspension cultures?"
This paper is an attempt to review the problems of control of such complex biological processes. The most recent achievements in cell suspension culture apparatus design and construction
(Nyiri, 1974; Acton, 1975) make this review timely.
This paper addresses four major areas of interest, namely:
(1) The interactive nature of the biological processes, (2) Sensors with the capability to measure the status of the biological process,
(3) Interactive control strategy,
(4) Overall control of a mammalian cell mass-metabolite production line.
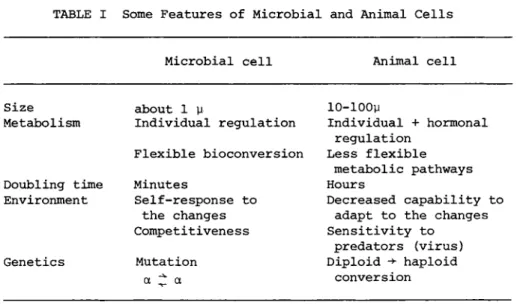
Although the present discussion stems from observations made while working with microbial cells, certain fundamental laws can be applied to animal cells too, carefully pondering, however, the major differences between the two cellular systems (Table I ) .
C O M P U T E R C O N T R O L 163
Microbial cell Animal cell
Size about 1 μ 10-100μ
Metabolism Individual regulation Individual + hormonal regulation
Flexible bioconversion Less flexible metabolic pathways
Doubling time Minutes Hours
Environment Self-response to Decreased capability to the changes adapt to the changes Competitiveness Sensitivity to
predators (virus) Genetics Mutation Diploid -> haploid
α ^ α conversion
II. INTERACTIONS IN CELL CULTURE SYSTEMS
A. The Term Interaction
Since this word is extensively used in the biological- engineering-computer control literature for a variety of func- tions, it is necessary to define our understanding with regard to the interactions with specific respect to multicomponent systems.
In our understanding, interaction is a process in which a minimum of two constituents of a system mutually influence each other resulting in reversible or irreversible changes in each constituents1 quantity and/or quality. The interaction may take place between any constituents of the whole system.
B. Process of Interaction
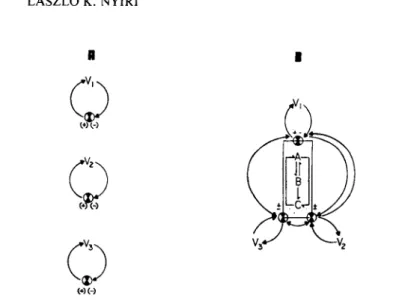
Take three constituents of a multicomponent system (Figure 1 ) , with the ability to selectively exercise an effect on the other constituents. Constituents A^ and Ci perform reciprocal actions on each other causing changes in the quantity and/or quality of the affected constituent. This is called direct interaction between constituents. At the same time constituent B-: also in-
TABLE I Some Features of Microbial and Animal Cells
164 L A S Z L O K. N Y I R I
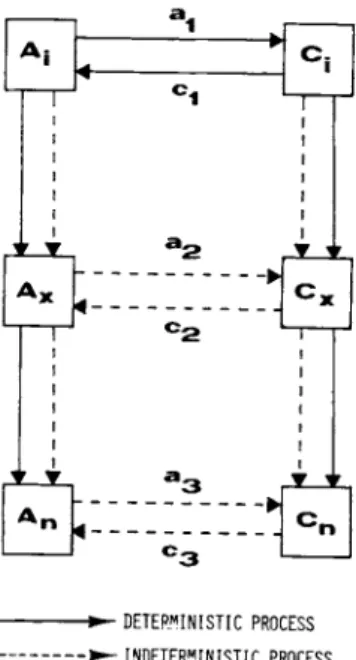
FIGURE 1 Principle of interaction between system constituents.
• DETERMINISTIC PROCESS - INDETEMINISTIC PROCESS
FIGURE 2 Basic mechanism of interaction between system constituents.
fluences Cj_, however, does not interact with B-^. The effect of B^ on can amplify or diminish the effect of A^ on C^. This
C O M P U T E R C O N T R O L 165
is called indirect interaction between constituents A^ and B^, which can be synergistic or antagonistic, respectively. As a result of the effect of the "third party" B^ on C^, the latter's direct interactive response toward A^ can be greater or less than that if B^ is not present in the system.
During the interaction, constituent C (being in state C^) re- ceives input (a^) from constituent A (while it is in state A^)
(Figure 2 ) , This input, after a unit delay, offsets the original state of C^ and brings it into a transition ( Cx) , then into an- other more stable state ( Cn) . Conversely, C^ while in its orig- inal state influences A^ bringing it through transition Αχ to a final AR state. It is also assumed that the intermediate and final states also interact with each other. Based on experiments in enzyme catalized reactions, in biological systems the inter- action between two system constituents lasts throughout several step changes in the states (Cleland, 1970). If the sequence of process is known, the interaction can be called deterministic.
However, because of the existence of indirect interaction (third party's effect) (Nyiri and Toth, 1975) the biological system can be considered indeterministic, at least probabilistic. In other words, the biological system is considered an indeterministic one with a probability distribution over the initial and the possible next states during the interactions.
C. Interactions in Biological Systems
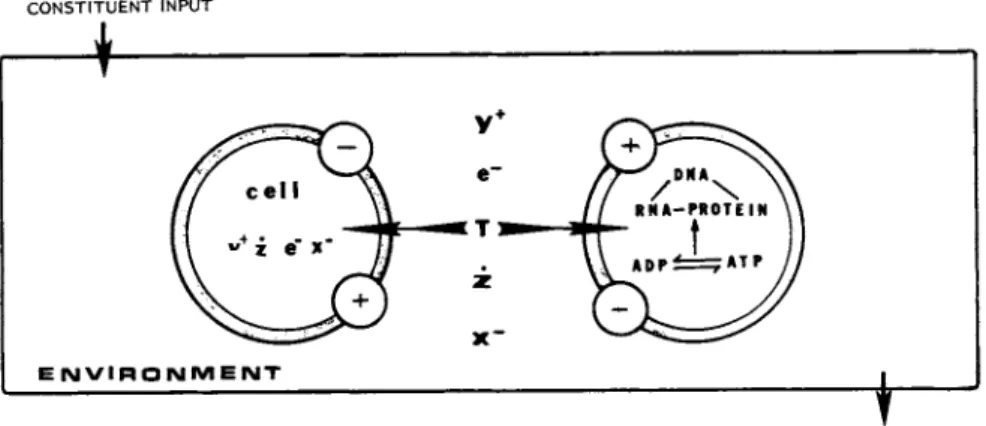
In a biological system (in our case: in vitro culture of eucaryotic cells) the main interacting system constituents are
(Figure 3 ) : (1) Cell(s) and (2) environmental factors (including compounds with positively (Y+) or negatively (X~) charged func- tional groups, electrons (e~), free radicals (Ζ), and energy bearing physical constituent(s), e.g. temperature (T)). A mini- mum of two major types of interactions are taking place, one at the cell-environment and an other at the cell-cell level. (We
166 L A S Z L O K. N Y I R I
C O N S T I T U E NT I N P UT
—•
I E N V I R O N M E N T ^ J C O N S T I T U E NT O U T P U T
FIGURE 3 Interactions between system constituents in a biological system.
the ce11-environment and another at the cell-cell level. (We omit, knowingly, the intracellular interactions between the cell constituents).
Cell-environment interaction occurs via the cell membrane primarily by means of altering the charge conditions of the reac- tants. Only the heat energy is considered to penetrate the cell membrane without directly interacting with cell membrane con-
stituents.
Cell-cell interaction takes place either by direct contact between the cells or through mediators released into or taken up via the medium's main constituent ( H20 ) . This process also in- volves charge condition changes in the constituents. Some evi- dences has been reported indicating that the cell-cell interac- tions are influencial to the cells nuclear replication, too
(Mueller, 1971; Mastro et al., 1974).
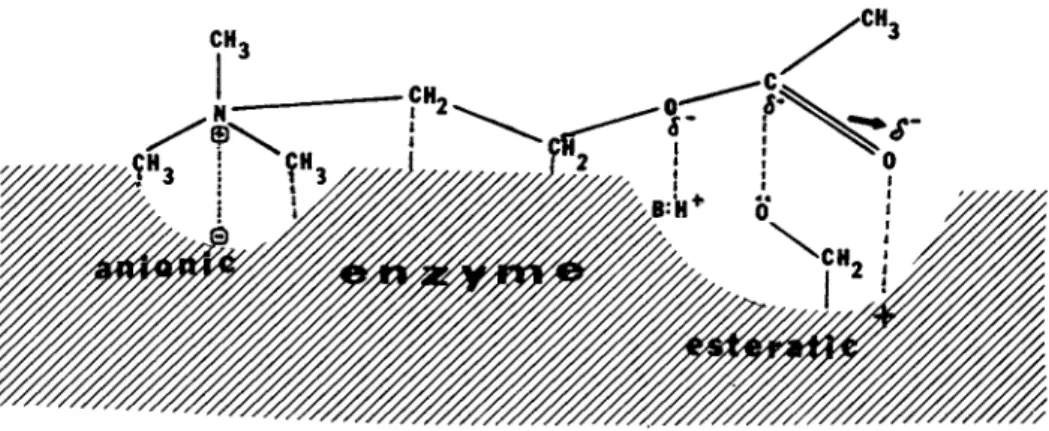
Whatever the level of interaction, ultimately the interactive effect of one constituent on another takes place at the electron distribution level in the affected compounds as it is exemplified in case of acetylcholine-acetylcholinesterase reaction (Figure 4 ) . The change in the electron distribution primarily depends on the
C O M P U T E R C O N T R O L 167
cell membrane
I I
FIGURE 4 Ultimate level of interaction: electron proton exchange. I. Interaction between acetylcholinesterase and acetylcholine. II. Sialic acid as potential electron donor and acceptor system.
available free energy for the process which, thusly, is considered as one of the most important factors in interactions. Compounds with the capability to dislocate electrons and transfer protons
168 L A S Z L O K. N Y I R I
are considered to be essential during these processes. In animal cell membranes, the sialic acid (II in Figure 4) and the receptor molecules (Marchesi, 1975) are regarded to be intimately involved in cell-environment and cell-cell interactions.
Because of the importance of charge condition changes in the molecules of cell membrane and in the intercellular medium, sen-
sors monitoring changes in the proton or electron intensity and capacity of the culture are extremely useful from process control point of view (Toth, 1977).
D. Interactions between the Biological and Physical System Constituents in an In Vitro Culture System
The in vitro cultured cells are grown in a properly designed culture vessel with its auxiliary equipment (pipes, valves, pumps, motors, instruments) the ultimate purpose of which is the maintenance of optimum environmental conditions.
Because of the interactions between the cells and their en- vironment and the changing characteristics of the cells in the culture the environment can not be considered neutral.
Taking the simplest substrate (S) related growth (X) which is the function of temperature, and pH a complex interactive condi- tion is obtained (Figure 5) (Young, 1970). Any change in S will involve changes in X and pH which ultimately influence the uptake of S hence, again, X. The interaction becomes more complex with the introduction of new system constituents and with the require- ment to control the process variables. This constant modification of the environment involves the process status identification sensing the process variables and performing control action by actuation of valves, motors, pumps of the physical system.
C O M P U T E R C O N T R O L 169
τ
m ufΤ dX=uX-DX
^ = D S o - D S - ^ U =f(S,T,pH,t) Y -f(uJ,pH,t)
FIGURE 5 Interaction between the system's biological constituents (S,X) and mechanical-electronic elements.
III. IDENTIFICATION OF STATUS OF BIOLOGICAL PROCESSES
A. Analysis and Determination of Interactions
Means for on-line, real-time detection and quantitative mea- surement of the state of constituents of the system is inevitable.
In the practice of culturing cells in vitro the means are sensors which generally detect and measure the status of constituents. It is noted that, generally, the measurable status (e.g. pH) is the end result of several interactions and not the interaction itself.
Practices in biochemical engineering, however, indicate that this type of sensing seems to be adequate for process control if the proper correlation between the sensed status of the constituent (state variable) and the process is defined (Nyiri, 1972; Aiba et al.r 1973; Nyiri et al., 1976).
170 L A S Z L O Κ. N Y I R I
Β. Sensors in Eucaryotic Cell Cultures
Instruments and sensors for cell cultures may be divided into two broad categories (1) DIRECT MEASUREMENT types and (2) NET EFFECT SENSOR types.
Most instruments currently in use in the cell culture systems belong to the first category and are used for the purpose of moni- toring as well as control of process variables (Table 2 ) . Devices of this type can provide information only on the physical and physico-chemical conditions of the culture (e.g. T, pH, D O ) , whereas the physiological conditions are usually of greater interest. There are, of course, a small number of instruments that do offer some information on the cellular metabolism (e.g.
exit 02 and C 02 analyzers, most recently automatically reporting gas chromatographs) but they have not found wide application in control of the cell cultures' environment.
From a process analysis point of view, therefore, a more prom- ising approach is the application of so-called Net Effect Sensors
(Nyiri and Jefferis, 1973). The net effect sensor is a composite of various individual sensor elements and measures a process vari- able related to a (preferably main) metabolic pathway. The out- puts of individual sensors are coupled electronically in order to produce a new signal relative to a otherwise non-measurable pro- cess variable (e.g. 02 uptake, C 02 release rates, or respiratory quotient). An implementation of the net effect sensor concept is the on-line, real-time application of computers with a Data Analysis oriented program to obtain information on the process status. Here with multivariation of the directly available sig- nals otherwise inaccessible state variables (process indicators) can be obtained. These process indicators reflect the physico- chemical, physiological and biochemical conditions of the culture
(Humphrey, 1971; Nyiri, 1972; Nyiri and Krishnaswami, 1974; Nyiri and Toth, 1975; Nyiri et al., 1975).
>1
+J •Μ
rd •Η
Φ <ϋ -Μ ω
ο fd 0
β φ ϋ fd
fd υ rß οι Φ Φ
•Η •Η , β u ι Η en 0 c > ιΗ w S3
-Ρ - Η Φ 0 1
οι fd Χ -Ρ ϋ) φ
•Η -Ρ •Η 0 0 1 Q s φ g PQ U > Φ
ft
ιΗ ι Η Φ Φ Η Λ
ο fd U -Η
• Ρ J H ß fd Ο >
U
-μ Φ - Η fd
Φ
•μ Φ β
Τ Ι φ φ
φ •Η U
u S3
S3 rd •μ
οι •Η fd
fd rH
Φ fd Φ
> & β
Φ
U
ο
οι Φ
t n
•Η - Η c ο
•μ Φ fd οι
Λ fd 5
οι -μ Φ
ft
ft ö 3 Φ Φ n
-μ _ S3 fd Tf
•Η •μ οι ß g φ 0 1
β rH φ , β Φ Φ ft 4->
£η 4-> g Ο
. . >1 Φ Φ Μ
ft Χ Ό Λ Ο
3 3
g Φ fd οι •μ
>1
0 1 fd · Η +J υ φ
Φ 0 1 ,β
S Ο -μ
Φ U -μ S3 fd U ft Φ
rß +J fd
•μ Ο φ φ 0 1
Φ S3 5-1 0 1
Φ ft Λ S3 fd
ft β Γ Η 0 1 ι g
0 1 • Η Ο -μ Φ 0 1 wΦ ο œ rH
ft
0 1 β 0 1 u \ CM rH• Η Ü fd - Η φ ft + Ο as Φ
> te ft Φ υ
Î H Φ 4-1 £
u 0 1 ο
Φ Φ β Η
4 Η 4 Η fd 4 Η
Ol Φ 0 1 φ ÎH
ß rß β -μ -μ
fd -μ Τ Ι fd •μ Τ Ι β
u •Η H -Η (Ν Φ
-μ 0 S3 . μ 0 S3 Ο -Η -μ Ο1 •μ &
0 1 β - Η 0 1 β •Η 1 4->
fd - Η ιΗ fd - Η rH CM S3
ϋ Ο
Ol φ
Φ > 0 1 Φ g
ϋ rH 0 1 fd ιΗ ß fd
•Η fd Φ 0 1 fd Cn •Η •Η Φ
> Φ > > φ en Cn -μ
Φ ίο > rH > •μ fd 0 1 -μ
Ω Φ Φ Φ τ ι Η 0 1 Ο fd rH •μ •H rH Φ 0 1
-μ φ •μ > φ fd fd rH φ > M rd •H X 0 -μ
en ß rH fd rH \ 0 1 ιΗ ß φ fd Ο > β Cr» β 4 - 1 φ Φ 0 > φ > •Η Ol
ft 0 ο ft U •μ φ ι Η fd
•Η S3 fd + j > •Η 0 1 •Η •μ - Η -μ 0 0 1 0 S3 fd £ 0 1 0 Cn
0 1 β •Η ft •Η β •μ 0 •μ ω •μ β Γ Η rH 0 1 rH 0 0 1 β (d β g S3 u fd •Η u ιΗ •Η S3 - Η φ 4 - 1 u 4 - 1 0 1 S3 rH φ •H Φ Φ 0 fd •μ
φ ß fd ιΗ 0 0 1 0 4 - 1 0 1 fd 0 1 Cn 0 1 0 0 1 φ Cn 4 H > •Η -μ •Η
m fd > 0 rH ο •μ 0 1 0 , β Ο fd fd •μ fd u φ 0 1 •H o\<> +J CM -Ρ U Φ
0 4 - 1 ft Ο fd ft χ ft <ϋ Cn 0 Cn ft M fd fd CM 0 1 Ο 0 1 fd g Φ
-μ υ ft ϋ w S ft > O υ >
ο ß
Φ •Η
Ό -μ Ό •μ
Φ fd rd rd
Φ ÎH Φ φ rH
ft
rß u -μ rH0 1 £ Ο ι Η 0 1 S3 β Φ φ
>
U rH Φ 0 1 ϋ φ
0
4 - 1 0 1 φ β rH-μ Ο fd 0 1 0 1 φ u
ft
+ 0 ϋ ΟS ϋ >
ft
te Ω>1
•Η •μ Ό •Η
S* g
Ο Εη
> Η -μ Φ Φ
8
Φ
U Φ rH -μ Φ Φ g
-μ Φ φ φ
Φ U
g Ο S3 0 0
Ο rH 0 1 u
rß ϋ 4 - 1 0 1 0 1 φ
ft ft
rd rd u te Ο
Ε Η Ο eu
ft
Ω5H rß
rH Φ ft
φ N fd
Ν >1 rH
>1 rH en
rH fd o
rd ß -μ
rH ß fd fd
ιΗ fd g
φ φ CM O
rQ ϋ CM o u
0 o u rß
u -μ U
ft rß 4 - » -μ en •H •H 0 1 te -H X X fd
Φ r-3 w W o
171
172 L A S Z L O Κ. N Y I R I
C. Process Status Identification by Computer
Differences between the eucaryotic microbial cells (e.g., yeast) and cells of metazoan origin (Table 1) made it necessary to define some specific pivotal process status indicators for animal cell cultures. Figure 6 is a tentative flowchart of a computer program constructed specifically for analysis of conditions in animal cell cultures. The ultimate goal of such an operation is the proper status identification on the basis of which complex
(interactive) control of the environment can be performed. Among the process indicators we list the Reynolds number (NRE) which is the indicator of shear effects and may be correlated with popula- tion-density regulation of growth (Holley, 1974). The on-line, real-time computed respiratory quotient (RQ) was found in case of eucaryotic microbial cells as a pivotal indicator of the cells1 physiological conditions (Fiechter and VonMeyenburg, 1968; Nyiri et al., 1975) and it is expected to serve the same purpose in the case of animal cell cultures. The oxidation-reduction potential
(ORP) is considered probably the most important indicator of changes in charge conditions in animal cell cultures. On the basis of literature evidence ORP seems to be a key factor in the proliferation of normal and malignant cells as well as an indica- tor (forecaster) in changes of specific growth rate and indicator of cell-environment interactions (including virus induced trans- formations) (Wiles and Smith, 1969; Daniels et al., 1970; Taylor et al., 1971; Klein et al., 1971; Pardee et al., 1974; Toth, 1977). Correlation between p 02 and ORP (Taylor et al., 1971), on the other hand, makes it necessary to compute kLa , dp02/dt, dpH/dt, dC02/dt, deH/dt on the basis of which interactive control of p 02, p C 02, pH and eH can be achieved.
As an example of process status identification real-time com- puted, process indicators are shown in Figure 7. In this case a PDP-11/20 computer was interfaced with a highly instrumented cul-
- P eu
• H
T3 CJ fO
• H 0 4J
fO
• H
< H
• H 4J c;
• H 05 3
• U 4J fO
0) 0) 01
<D 0 0
Q ) 01 fO
is •
Q ) Q ) -M 3 3
0 3 υ Ü
,0 0 R M M • H 01
« U Q ) eu
•C! 01 0 3 0) pH M 0
* Η Ή t f υ Q )
Q )
• H f« s
• U • H Q ) HJ
p q 0 vu 0
+J
RE on
D Ü
O H Q )
* H 4J 0
173
174 L A S Z L O Κ. NYIRI
FIGURE 7 Identification of process status by on-line, real-time operating computer (C. utilis culture).
ture vessel (Harmes, 1972) in which C. utilis cells were grown under specified conditions. (Nyiri and Krishnaswami, 1974; Nyiri et al., 1976).
The ability to define transitions from lag (resting) to logarithmic (proliferative) phases of growth is of particular in- terest. Ross attempted to provide such capability by means of numberical analysis of available fermentation data (1974).
C O M P U T E R C O N T R O L 175
However, such an approach requires constant wet chemical analysis and off-line calculations. The presented picture shows the com- puter analysis on the gas exchange conditions in the early phase of growth.
DO level exhibited a gradual decrease to a minimum of 25% of saturation over a period of 6 hours. Similar "smooth" transitions were also found by both the computed oxygen uptake (OXUP) and C 02 production (C02) rates. The smooth transitions exhibited by these process indicators made them particularly inappropriate for the purpose of defining the transition between lag and logarith- mic phases. On the other hand, the RQ went through drastic changes during this early period of cell growth. Cells trans- ferred from inoculum responded to the altered environmental con- ditions with a rapid increase in RQ (->-7) which after the first hour dropped to 2.0 and then increased again to a steady value of 3.8 (EFT = 7.0 hrs.). RQ values higher than 1.0 at the start of fermentations and during ethylalcohol production of S. cerevisiae cultures have been reported by other investigators (Gorts, 1967;
Fiechter and VonMeyenburg, 1968).
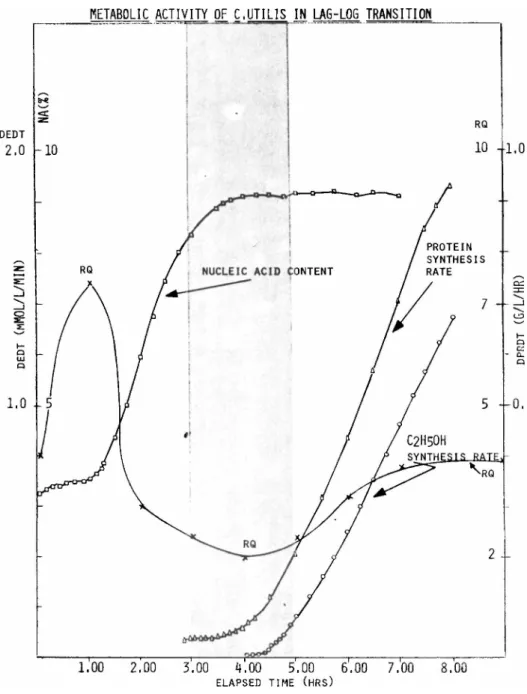
Chemical analysis of the culture revealed significant cor- relations between RQ and some biochemical events including: (1) nucleic acid, (2) protein, and (3) ethylalchol synthesis (Figure 8 ) .
The drop in RQ value during the elapsed time period of 1-3.0 hours coincided with the increase in specific nucleic acid con- tent of the culture, while the minimum RQ (EFT = 3-4 hrs.) coin- cided with the start of increased specific protein concentration.
The increase in RQ value in the fourth hour coincided with the start of ethylalcohol formation (shaded area). Correlation ob- tained between the culture's metabolic activity detected by wet chemical methods and the respiratory quotient obtained via com- puter operation demonstrate that the latter, after the definition of correlations, can be used to determine certain transition conditions in eucaryotic cell cultures.
176 L A S Z L O Κ. N Y I R I
FIGURE 8 Correlation between the changes in RQ specific nucleic acid content (NA%) protein synthesis rate (DPRDT) and ethylalcohol synthesis rate (DEDT) in C. utilis culture.
C O M P U T E R C O N T R O L 177 IV. INTERACTIVE PROCESS CONTROL
There are two major objectives to be achieved by means of interactive control of environmental conditions during cell culture. These are
1. Control the environment to make it suitable to the genetically altered conditions, and
2. Control the environment in order to shift the metabolism toward a desired direction.
Accordingly, the need for corrective actions to the environmental conditions assumes extensive knowledge of the process status.
This, as it was demonstrated previously, can be substantially improved using computer for process status identification.
In addition to the cell-environment interactions, there are interactions between the effect of individual control elements.
The effect of agitation (tip) speed and airflow rate, as well as temperature and gas pressure on the culture's gas exchange con- ditions is among the most convincing arguments.
The question is how a control strategy works which takes the above mentioned interactions into consideration.
Figure 9 presents two different control concepts. In the first case, environmental variables V^, V2 and V 3 are maintained at their target values according to the PID control law or one of its variants. In this case, the control actions are taking place independently from each other. This technique was characteris- tically followed for more than a quarter century in the anti- biotic fermentation industry.
In the second case (Β) , the target values of the V.^, V2, environmental variables are maintained by separate control means
(as in the first case), however, the setpoints are changed ac- cording to the (formerly detected) interactions between V^, V2
178 L A S Z L O Κ. N Y I R I
n β
W(->
FIGURE 9 Control concepts in cell culture technology: Ά, Independent control loop approach, B. Interactive control.
and V 3 as well as the interactions between Α. Β and C biological variables as influenced by environmental variables V^, V2, V 3 .
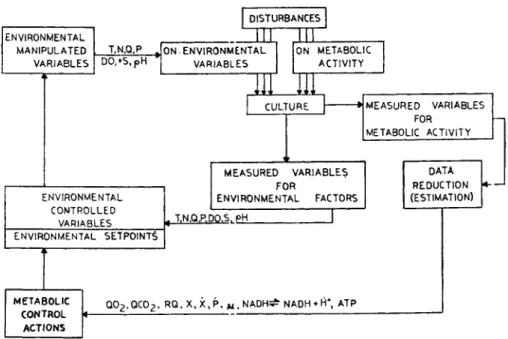
This control operation may take place on several levels (in several loops) (Figure 1 0 ) . In this case, for instance, the target values of environmental variables (Τ, N, Q, P, DO, S, pH, etc.) are maintained by otherwise known techniques (e.g., with control elements using supervisory control procedure, or DDC) and the setpoint for each environmental variable is altered according to the biological status of the culture and taking into considera- tion the formerly defined interactive effects of the constituents.
As an example, (Figure 11) shows the performance of a com- puter during interactive control of environmental conditions. In this case, the previously defined optimum carbon to nitrogen ratio (condition for RQ = 1) was maintained by a computer during the logarithmic phase of growth of C. utilis cells. Maintaining other environmental variables (Τ, P, pH) constant at their pre- defined optima and altering others (e.g., DO on the basis of kLa ) the computer used the RQ value to control the feed rate of carbo- hydrate and nitrogen sources in order to maintain the RQ around
C O M P U T E R C O N T R O L 179
ENVIRONMENTAL MANIPULATED VARIABLES
T.N.Q.P D0,+5,pH
ENVIRONMENTAL CONTROLLED
VARIABLES
DISTURBANCES
J 1 L ML
ON-ENVIRONMENTAL
VARIABLES ON METABOLIC ACTIVITY
CULTURE
ENVIRONMENTAL SETPOINT^
MEASURED VARIABLES FOR
METABOLIC ACTIVITY
MEASURED VARIABLES FOR
ENVIRONMENTAL FACTORS
DATA REDUCTION (ESTIMATION) T.N.Q.P.DO>S.pH
M E T A B O L I C C O N T R O L
A C T I O N S
Q02.OC02. RQ.X,X,P, w.NADH^ NADH «- rî* ATP
FIGURE 10 Implementation of interactive control (cascaded control of environment).
1.0. In this case, according to the scheme, the control-loop was closed via a computed process indicator (RQ) which reflected the pivotal physiological condition of C. utilis. At 0 . 0 0 EFT (which is the starting time of the experiment in a fed-batch culture where molasses was added at a rate of 24 G . L ^ . H R "1) the growth rate was 5.0 G.L"1.HR"1 and RQ was below the SP (RQSP = 0.5 min- 1.2 m a x ) . As a consequence, feed of (NH4)2HP04 started in order to reach a proportion of 2:1, being previously defined as opti- mum for RQ=1 by pulse-response experiments. As a result, the RQ started to increase and reached the region of RQ=0.8-0.9. At 4:20 EFT RQ started to decrease and reached the region of
RQ=0.8-0.9. Pump started to feed C N H4)2H P 04 again. A subsequent increase in RQ coincided with increases in oxygen uptake and C 02
release rates indicating the enhanced metabolic activity and
180
C O M P U T E R C O N T R O L 181
growth. Here RQSP was narrowed to 0.9 m i n - 1. 2 max. Reaching R Q = 1.2 the pump was turned OFF resulting in decrease in the RQ below 1.0 but not below 0.9. Here the SP was adjusted to
RQSP=1.0+0.05. The Ν feed pump was turned ON and OFF keeping the RQ in this domain. During this operation samples were taken and the OD was determined. There was a gradual increase in growth rate from the 5:00 EFT peaking at 7. SG.L-^-.HR"1 value at 1 0 : 2 0 EFT. This growth rate is corroborated by the oxygen uptake rate of the culture which peaked at 3.9 Π1ΜΟ2·Ι*~1.Μίη~1 ( = 2 3 4
m M 02. L "1. H R -1) .
Oscillations in process variables were observed mostly in the first five hours of the experiment and are mainly due to "third party" effects, where new pulses reached the process before the effect of the previous pulse was not completed (Nyiri and Toth, 1975).
Although this experiment is considered to be extremely crude, to our best knowledge, this is the first one where automatic control of environmental condition was implemented on the basis of a pivotal physiological variable (RQ).
V. OVERALL CONTROL OF MAMMALIAN CELL CULTURES
A. Animal Cell Culture Plant
Recent developments and prospects in molecular biology, cancer and virus research indicate an increased need for animal cell production in mass quantities. This can be implemented in culture systems of various size and complexity. Such a system is depicted in (Figure 1 2 ) .
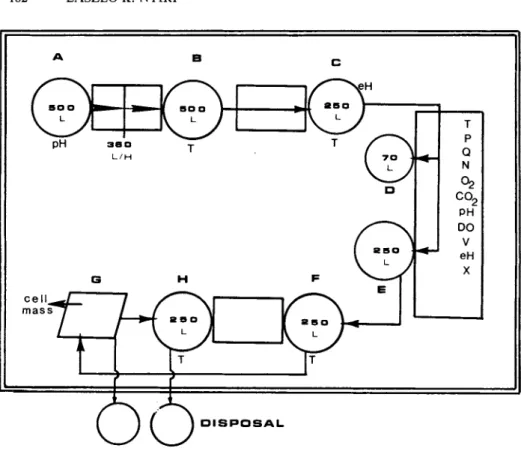
The flow of operation incorporates medium preparation includ- ing sterilization and medium transfer (A*B), storage of medium
(Β), medium poising (C), development of seed culture (D), in- oculation of main culture vessel (Ε), semi-continuous operation withdrawing the cell containing culture liquid into a harvest
182 L A S Z L O Κ. N Y I R I
FIGURE 12 Flow diagram of mammalian cell suspension culture system.
tank (F) with a subsequent replenishment of the culture with fresh medium from the poising vessel (C); removal of cells from the culture liquid by centrifugation (G) followed by a storage of the spent medium in a supernatant vessel (H). The system also contains auxiliary, support equipment (air compressor, air in- cinerator, spent medium and effluent disposal system).
B. Computer Control of Plant Operation
This type plant is considered an ideal system for computer control. Three major computer functions can be implemented, viz.,
(1) sequential control of flow of operations, (2) interactive con- trol of the culture, and (3) process management (Figure 1 3 ) .
C O M P U T E R C O N T R O L 183
PROCESS M A N A G E M E N T
S E Q U E N T I A L O P E R A T I O N
PROCESS C O N T R O L
FIGURE 13 Computer control hierarchy in large scale mammalian cell mass production system.
The core of the computer operation is identification of the process status (Figure 1 4 ) . This is performed using the suit- able data analysis technique which incorporates frequency spec- trum analysis of the acquired signal (Nyiri et al., 1975), noise filtering or rejection and data analysis on the basis of multi- variation of the individual signals (c.f. Figure 6 ) .
After the identification of the process status which includes the conditions and position of valves, motors, etc. and the con- dition of the culture a predictor technique is used. The pre- dictor uses the current values of the process output and deter- mines the necessary step in the operation sequence. A typical example is the determination of the optimum transfer time of seed culture into the main vessel. (Figure 15(a)) shows the changes in DO concentration during a dynamic assessment of Q 02X and KLa values in a murine lymphoblastoid (L251A) cell culture (cell count at the time of temporary stop of airflow was 8.5x10^ cells/ml.).
The slope (dC/dt) gives information not only on the Q 02X but from the correlation between the specific 02 uptake (Q02) and specific growth rate (Qx) the proper seed transfer time can be determined.
184 L A S Z L O Κ. N Y I R I
/ S I G N A L S
D A T A A C Q U I S I T I O N
D A T A A N A L Y S I S
S E Q U E N T I A L O P E R A T I O N
YES
Q
E N D ^FIGURE 14 Basic flowchart of overall computer control of large scale mammalian cell mass production system.
On this basis a sequential operation is implemented to sterilize and fill the main culture vessel in time so it will be ready to accept the seed at the proper time.
Difficulties arising from stopping and restarting airflow can be avoided having an exit 02 gas analyzer by which Q 02X can be
simply computed (Figure 15(b)). In this picture (observed with
C O M P U T E R C O N T R O L 185
b
FIGURE 15 Predictors in computer based overall control of biological process. Definition of physiological status on the basis of (a) rate of decrease in DO concentration, (b) changes in oscillation of exit 02 gas analysis signal.
C. utilis culture) the maximum respiratory activity concurred with maximum oscillation in the signal. In the case of a high scanning rate, the computer can define the (in)stability of the signal thus avoiding the time consuming computations in search of maximum
(or minimum) of the signal.
186 L A S Z L O Κ. N Y I R I
Such an operation can be used in defining the time of with- drawal of part of the culture during semi-continuous operation or the time of fresh nutrient feed in case of fed-batch cultures.
The flow rates in between the vessels are, in this case, defined according to the culture conditions which therefore governs the entire operation.
The control of individual process variables (DO, S feed rate, pH) is implemented by other interactive control technique some examples of which were already mentioned.
An equally important part of the computer operation is the management of the process. This includes tasks of logging the acquired and analyzed data as well as the control operations, alarm signal production and inventory of the supplies.
VI. CONCLUDING REMARKS
The significance of pondering the installation of a computer controlled mammalian cell plant can be summerized in the
following:
(1) Development of such a system requires extensive analysis of correlations between the available sensor signals and the events of cell metabolism. This work enhances our knowledge about the cell-environment and cell-cell interactions.
(2) The work recognizes the need for development of new sensors particularly in the area of cell-cycle analysis and direct determination of various metabolic functions related to alteration in cell membrane and cell differentiation.
(3) If implemented, interactive control will result in en- vironmental conditions which will more approximate those condi- tions from which the cells are originated.
(4) In the case of hazardous operations (cancerogenic virus research, plasmids, etc.) computer control of the plant is an in- evitable part of a Class III containment system.
C O M P U T E R C O N T R O L 187
Developments and achievements in computer applications to mi- crobial fermentation processes demonstrates not only their econom- ic advantages but even in its short period of existence enormously enhanced our understanding of the living processes. On the basis of these findings, it is anticipated that works now facing in- triguing puzzles in mammalian cell culture will be faster and more satisfactorily performed.
NOTATION
C 02 Carbon dioxide analyzer; output signal of C 02 analyzer (%).
D^ Diameter of impeller (cm).
DO Dissolved oxygen analyzer and controller; output signal from DO analyzer (%).
eH Redox potential analyzer; output signal of ORP analyzer (mV) .
KLa Volumetric oxygen gas transfer coefficient (1/hr).
Ν Agitation speed (RPM).
02 Oxygen analyzer; output signal from 02 analyzer (%).
ORP Oxidation-Reduction Potential.
OXUP Volumetric oxygen uptake rate (mM02/min/L).
Q, Qn Air-gas flow rate (SLPM).
Q C 02 Specific carbon dioxide release rate (mMC02/G cell/time).
Q 02 Specific oxygen uptake rate (mM02/G cell/time).
Ρ Vessel headpressure (atm.).
Τ Temperature of medium or culture liquid (°C).
V Liquid volume (Liter).
W Power requirement for fluid mixing (watt.hr).
X Cell number (cell-mass) (G/L; cell count/ml).
ρ Liquid density (g/cm^)
188 L A S Z L O Κ. N Y I R I REFERENCES
Aiba, S., Humphrey, Α.Ε. and Millis, Ν.F. (1973). Biochemical Engineering. University of Tokyo Press.
Acton, R.T. (1975). Proceedings of Cell Culture Congress.
Cleland, W.W. (1970). In "The Enzymes" (P.P. Boyer, E d . ) , Third Edition, Vol. II. pp. 1-65.
Daniels, W.F., Garcia, L.H. and Rosensteel, J.F. (1970). Bio- technol. Bioeng. 12, 419-428.
Fiechter, A. and VonMeyenburg, K. (1968). Biotechnol. Bioeng.
10, 535-549.
Gorts, C.P.M. (1967). Antonie VanLeeuwenhock, J. Microbiol.
Serol., 33, 451-453.
Harmes, C S . III. (1972). In "Developments in Industrial Micro- biology." Vol. 13, pp. 146-150. A Publication of the Society for Industrial Microbiology. American Inst, of Biol. Sciences.
Washington, D.C.
VanHemert, P.A. (1972). Paper presented at the first Int'l.
Symp. on Adv. in Microbiol. Engineering. Marianske Lazne.
Czechoslovakia.
Holley, R.W. (1974). In "Control of Proliferation on Animal Cells," (B. Clarkson and R. Baserga, Eds.). Cold Spring Harbor Conferences on Cell Proliferation. Vol. 1., pp. 13-18. Cold Spring Harbor Laboratory Publ.
Humphrey, A.E. (1971). Proc. of LABEX Symposion on Computer Control of Fermentation Processes. London.
Klein, F., Mahlandt, B.G. and Lincoln, R.E. (1971). Appl.
Microbiol. 22, 145-146.
Knazek, R.A., Gulino, P.M., Kohler, P.O. and Kedrk, R. (1972).
Science 178, 64.
Kruse, P.F., Jr. and Patterson, M.K., Jr. (eds.) (1973). Tissue Culture Methods and Applications. Academic Press, New York.
Litwin, J. (1971). Process Biochemistry. 6, 15-18.
Marchesi, V.T. (1975). "Miles International Symposium on Cell
COMPUTER CONTROL 189
Membrane Receptors," John Hopkins Medical Institute.
Mastro, A.M., Beer, C.T. and Mueller, G.C. (1974). Biochem.
Biophys. Acta 352, 38-51.
Mueller, G.C. (1971). In "The Cell Cycle and Cancer," (R.
Basergal, Ed.) pp. 269-307. Marcell Dekker, Inc., New York.
Nyiri, L. and Jefferis, R.P. III. (1973). In "Single Cell Pro- tein," (S.R. Tannenbaum and D.I.C. Wang, Eds.). Vol. II, pp.
105-126. MIT Press. Cambridge, Massachusetts.
Nyiri, L.K. (1974). In "Enzyme Engineering," (E.K. Pye and L.B.
Wingard, Jr., Eds.). Vol. 2, pp. 31-40. Plenum Press.
Nyiri, L.K. and Krishnaswami, C.S. (1974). 75th National Meeting of ASM, Chicago, Illinois.
Nyiri, L.K. and Toth, G.M. (1975). Paper presented at the 1975 Annual Meeting of Society of Industrial Microbiologists. King- ston, Rhode Island.
Nyiri, L.K., Toth, G.M. and Charles, M. (1975). Biotechnol. Bio- eng. , 17 1663-1678.
Pardee, A.B., deAsua, L.J. and Rozengurt, E. (1974). In "Control of Proliferation in Animal Cells," (B. Clarkson and R. Baserga, Eds.). Cold Spring Harbor Conferences on Cell Proliferation.
Vol. 1., pp. 547-561.
Ross, L.W. (1974). Biotechnol. Bioeng. 16, 555-556.
Taylor, G.W., Kondig, J.P., Nagle, S.C. and Higuchi, K. (1971).
Appl. Microbiol. 21, 928-933.
Telling, R.C. and Radlett, P.J. (1970). Vol. 13, pp. 91-119. In
"Advances in Applied Microbiology (Perlman, D., E d . ) . Toth, G.M. (1977). In "Advances in Biochemical Engineering,"
(A. Fiechter, E d . ) . (in press) Springer Verlag. Berlin.
Wiles, C.C. and Smith, V.C. (1969). Am. Inst. Chem. Engr.
Symp., (Bioeng. Biotechnol.), pp. 85-93.
Young, T.B. (1970). ACS National Meeting, Div. Microbiol. Chem.
Technol. No. 39, Chicago, 111.