fmicb-12-617802 April 5, 2021 Time: 17:7 # 1
ORIGINAL RESEARCH published: 09 April 2021 doi: 10.3389/fmicb.2021.617802
Edited by:
Mar Benavides, Institut de Recherche Pour le Développement (IRD), France
Reviewed by:
Sven Alexander Kranz, Florida State University, United States Carolin Regina Löscher, University of Southern Denmark, Denmark
*Correspondence:
Sophie Rabouille rabouille@obs-banyuls.fr
Specialty section:
This article was submitted to Aquatic Microbiology, a section of the journal Frontiers in Microbiology
Received:15 October 2020 Accepted:01 March 2021 Published:09 April 2021
Citation:
Rabouille S, Campbell DA, Masuda T, Zavˇrel T, Bernát G, Polerecky L, Halsey K, Eichner M, Kotabová E, Stephan S, Lukeš M, Claquin P, Bonomi-Barufi J, Lombardi AT, ˇCervený J, Suggett DJ, Giordano M, Kromkamp JC and Prášil O (2021) Electron & Biomass Dynamics of Cyanothece Under Interacting Nitrogen & Carbon Limitations.
Front. Microbiol. 12:617802.
doi: 10.3389/fmicb.2021.617802
Electron & Biomass Dynamics of Cyanothece Under Interacting Nitrogen & Carbon Limitations
Sophie Rabouille1,2* , Douglas A. Campbell3,4, Takako Masuda3, Tomáš Zavˇrel5, Gábor Bernát3,6, Lubos Polerecky7, Kimberly Halsey8, Meri Eichner3,9, Eva Kotabová3, Susanne Stephan10,11, Martin Lukeš3, Pascal Claquin12, José Bonomi-Barufi13, Ana Teresa Lombardi14, Jan ˇCervený5, David J. Suggett15, Mario Giordano3,16, Jacco C. Kromkamp17and Ondˇrej Prášil3
1Sorbonne Université, CNRS, LOV, Villefranche-sur-Mer, France,2Sorbonne Université, CNRS, LOMIC, Banyuls-sur-Mer, France,3Centre Algatech, Institute of Microbiology of the Czech Academy of Sciences, Tˇrebo ˇn, Czechia,4Mount Allison University, Sackville, NB, Canada,5Department of Adaptive Biotechnologies, Global Change Research Institute CAS, Brno, Czechia,6Centre for Ecological Research, Balaton Limnological Institute, Klebelsberg Kuno u. 3. 8237 Tihany, Hungary,
7Department of Earth Sciences, Utrecht University, Utrecht, Netherlands,8Department of Microbiology, Oregon State University, Corvallis, OR, United States,9Max Planck Institute for Marine Microbiology, Bremen, Germany,10Leibniz-Institute of Freshwater Ecology and Inland Fisheries, Zur alten Fischerhütte 2, Stechlin, Germany,11Department of Ecology, Berlin Institute of Technology (TU Berlin), Ernst-Reuter-Platz 1, Berlin, Germany,12UMR BOREA (CNRS 8067), MNHN, IRD (207), Université de Caen Basse-Normandie, Caen, France,13Departamento de Botânica, Centro de Ciências Biológicas, Universidade Federal de Santa Catarina, Florianópolis, Brazil,14Universidade Federal de São Carlos, São Carlos, Brazil,
15University of Technology Sydney, Climate Change Cluster, Faculty of Science, Ultimo, NSW, Australia,16Dipartimento di Scienze della Vita e dell’Ambiente, UniversitaÌ Politecnica delle Marche, Ancona, Italy,17NIOZ Royal Netherlands Institute for Sea Research and Utrecht University, Utrecht, Netherlands
Marine diazotrophs are a diverse group with key roles in biogeochemical fluxes linked to primary productivity. The unicellular, diazotrophic cyanobacteriumCyanotheceis widely found in coastal, subtropical oceans. We analyze the consequences of diazotrophy on growth efficiency, compared to NO3−
-supported growth inCyanothece, to understand how cells cope with N2-fixation when they also have to face carbon limitation, which may transiently affect populations in coastal environments or during blooms of phytoplankton communities. When grown in obligate diazotrophy, cells face the double burden of a more ATP-demanding N-acquisition mode and additional metabolic losses imposed by the transient storage of reducing potential as carbohydrate, compared to a hypothetical N2assimilation directly driven by photosynthetic electron transport. Further, this energetic burden imposed by N2-fixation could not be alleviated, despite the high irradiance level within the cultures, because photosynthesis was limited by the availability of dissolved inorganic carbon (DIC), and possibly by a constrained capacity for carbon storage. DIC limitation exacerbates the costs on growth imposed by nitrogen fixation.
Therefore, the competitive efficiency of diazotrophs could be hindered in areas with insufficient renewal of dissolved gases and/or with intense phytoplankton biomass that both decrease available light energy and draw the DIC level down.
Keywords:Cyanothece,Crocosphaera subtropica, photosynthesis, light limitation, carbon limitation, nitrogen fixation
Frontiers in Microbiology | www.frontiersin.org 1 April 2021 | Volume 12 | Article 617802
INTRODUCTION
While the structures and genetic regulation of the key enzymes of photosynthesis and nitrogen (N2) fixation are relatively well understood, we lack understanding of how these two processes interact, in particular under fluctuating environmental conditions. Regulation of N2-fixation in photosynthetic diazotrophs is especially important, as molecular oxygen (O2), a product of photosynthesis, irreversibly denatures nitrogenase (Gallon, 1992), the key enzyme responsible for N2-fixation.
Autotrophic, unicellular cyanobacterial diazotrophs within the known groups B and C (UCYN-B, C; Zehr et al., 2001;
Taniuchi et al., 2012) overcome nitrogenase inhibition by O2 through temporal separation of day-time photosynthesis from N2-fixation (Fay, 1992; Gallon, 1992; Bergman et al., 1997) fueled by night-time respiration of carbon reserves accumulated during previous day-time photosynthesis. Despite this temporal offset, the yield of N2-fixation remains tightly dependent upon the efficiency of photosynthesis (Agawin et al., 2007; Großkopf and LaRoche, 2012; Grimaud et al., 2014). Further, the ability of UCYN to meet their nitrogen requirements using either N2or NO3−provides them with more flexibility in fluctuating environments. For instance, Agawin et al. (2007) demonstrated that a unicellular diazotroph can efficiently compete against nitrogen-limited phytoplankton incapable of N2-fixation, if sufficient light energy is available to support the extra costs of diazotrophy. We expect the respective demands and allocations of photosynthetic reductant in cells grown on nitrate or under obligate diazotrophy to differ because of the stoichiometries of these N assimilation pathways, but also because of their different timing in the light cycle, which imply distinct metabolic routes. It is therefore still unclear how reductant and energy demands are affected by the source of nitrogen and how much more costly it really is, for a diazotroph to grow on N2
vsNO3−
.
Because UCYN so much rely on dynamic internal reserves of carbon, an efficient photosynthesis and storage is key to their success. We therefore raise the question of the regulation of cellular processes by dissolved inorganic carbon (DIC) availability. As discussed by Stoll et al. (2019), DIC limitation occurred over glacial cycles which periodically triggered upregulations of the algal carbon concentrating mechanism (CCM). CCM is an essential component of the photosynthetic machinery as it maintains the intracellular CO2 concentration (Badger et al., 1998; Badger et al., 2006; Xu et al., 2008; Rae et al., 2013), enhancing the growth efficiency.
Although absolute DIC limitation is rare in the open ocean, Riebesell et al. (1993)argued that depending on which inorganic carbon forms can be used under non-limiting light and nutrient conditions, the growth rate of diatoms could actually be limited by the supply of CO2. Such observation, made from a microbial primary producer, may hint towards similar effects in diazotrophic cyanobacteria. Should DIC become transiently limiting, it could affect both the immediate photosynthetic efficiency and the subsequent activity of N2-fixation in UCYN.
In coastal environments and freshwater systems, where DIC
concentrations are lower than in the open ocean, phytoplankton blooms may draw down DIC to levels where the absolute amount of DIC can become limiting for growth, at least transiently.
So far, the literature demonstrates that DIC limitation can be a main determinant of phytoplankton growth in estuaries (Fogel et al., 1992) as well as in brackish waters during red tide episodes (Hansen et al., 2007). The development of harmful algal blooms leads to conditions of DIC limitation, in which cyanobacteria are likely to outcompete eukaryotic phytoplankton (O’Neil et al., 2012; Van Dam et al., 2018) and we therefore wonder whether such conditions could also constitute temporary niches for diazotrophs. Not onlyLu et al.
(2019)reported the presence of N2-fixing, cyanobacterial strains during a cyanobacteria-dominated harmful algal bloom (HAB) but they also demonstrated and their facilitating role on the onset of the toxic bloom. The photosynthetic efficiency in intertidal communities of diatom-dominated microphytobenthos is also periodically constrained by DIC availability (Vieira et al., 2016;
Marques da Silva et al., 2017). In freshwater systems, Kragh and Sand-Jensen (2018)challenged the paradigm that nutrients or light limit primary production in lakes, showing that DIC is a strong limiting factor, especially in the soft-water lakes.
DIC limitation, or coupled P and DIC limitation, was also found in Saint Anna Lake in Transylvania (Lajos Vörös, personal communication). DIC limitation also controls primary production in alkaline ponds (Zeng et al., 2019).
Thus this work addresses two questions. First, the consequences of diazotrophy on growth efficiency, compared to NO3−-supported growth, are not yet quantified. Second, we wonder how UCYN cope with the energetic burden of N2- fixation should they also have to face carbon limitation. Selected strains in the genus Cyanothece have extensively been studied as model organisms to address various physiological or gene regulation features (Schneegurt et al., 1994;Cólon-López et al., 1997;Sherman et al., 1998;Toepel et al., 2008;Bandyopadhyay et al., 2013).Cyanotheceis also becoming an emerging model for studying the performance of diazotrophy during the natural diel cycles of photosynthesis and N2-fixation in coastal environments (Rabouille et al., 2014; Aryal et al., 2018, Sicora et al., 2019), where it naturally occurs. The issue of a possible DIC limitation is therefore all the more relevant for this genus. We chose the strain Cyanothece sp. ATCC 51142 (hereafter Cyanothece), recently re-classified as Crocosphaera subtropica ATCC 51142 (Mareš et al., 2019)). As a starting point, we consider the theoretical energy and reducing power requirements of photosynthesis, N2-fixation and NO3−
uptake, to compare the direct costs of these two N assimilatory pathways. Double arrows indicate a multiple step conversion. N2-fixation and NO3− acquisition are distinct growth modes that impose different reductant and ATP burdens upon cells, as illustrated by the stoichiometric reactions involved (Falkowski and Raven, 2007):
Photosynthetic Electron Transport:
2 H2O + 8 H+out + 4hν→ ∼12 H+in + O2 + 4e− (1) 14H+in + 3ADP + 3Pi→14H+out + 3 ATP (2)
fmicb-12-617802 April 5, 2021 Time: 17:7 # 3
Rabouille et al. Electron & Biomass Dynamics in Cyanothece
Carbon Fixation:
CO2external + 1ATP→CO2internal + 1ADP + Pi (3) CO2internal + 4e− + 3ATP→CH2O + 3ADP + 3Pi (4) where CO2externalrefers to the extracellular CO2and CO2internal to the intracellular CO2. Note that in this study we do not distinguish between the form(s) of inorganic carbon used by cells and abbreviate them as CO2.
Nitrogen Assimilation:
NO3− + 8e− + 1ATP→→NH4+if NO3−is the N source (5) 1/2N2 + 4e− + 8ATP→→NH4+ + 1/2H2+
8ADP + 8Piif N2is the N source (6)
NH+4 + α−ketoglutarate + ATP + 2e−→→
glutamate(organic N) + ADP + Pi (7) Carbohydrate Re-oxidation:
CH2O→→CO2 + 4e− (8)
Aerobic Respiration:
4e− + O2 + 6ADP + 6Pi→2H2O + 6ATP (9) Linear photosynthetic electron transport (eqn. 1) generates
∼4 e−and translocates∼12 H+across the thylakoid membranes per two water molecules oxidized at Photosystem II (PSII).
Concurrently, 3 ATP molecules are synthesized during one full rotation of the AtpC subunit of the ATP synthase, driven by 14 H+ flowing through the membrane. Hence, linear electron transport generates 3 ATP × 12/14 ≈ 2.6 ATP per two water molecules oxidized. Combining eqn. 1 and 2 to express this ratio in terms of electrons per ATP yields 1.55 e−/ATP. In contrast, the reductant/ATP ratio needed for the Calvin cycle is 2NADPH/3ATP = 1.33 e−/ATP. Achieving sufficient reductant to ATP ratio, depending on the demands of cellular processes, is, at least partly, tuned by the cyclic electron transport around PSI generating only ATP (for further details, see e.g.Bernát and Rögner, 2011;Kramer and Evans, 2011). Carbon assimilation into biomass then costs 4 e− and 4 ATP per carbon atom (eqn. 3
& 4), including a nominal cost of 1 ATP/CO2externalto account for the cost of CCM moving CO2external to CO2internal (Raven et al., 2014). Every N atom assimilated from NO3−
to organic N (glutamate) costs 1 ATP per NO3− for uptake (Flores et al., 2005), followed by 8 +2 = 10 e− and one ATP for reductive assimilation (eqn. 5 & 7). In contrast, N assimilated from N2costs 4 +2 = 6 e− but 8+ 1 = 9 ATP (eqn. 6 & 7). To the extent the H2byproduct of N2-fixation is re-captured by dehydrogenase
activity (Tamagnini et al., 2007; Wilson et al., 2012), the net metabolic reductant cost further drops towards 4 e− per N for diazotrophy, whilst further protecting the nitrogenase against oxygen toxicity (Zhang et al., 2014).
Thus, in a cell with a C:N ratio of 7:1, growing on NO3−, the direct photosynthetic generation of a C7:N1 biomass implies an allocation to C assimilation of∼7×4 = 28 e−and∼7×4 = 28 ATP and an allocation of 10 e−and 2 ATP to N assimilation. This represents an investment of 38 e−and 30 ATP overall per C7:N1.
The same cell growing with N2as N source with a hypothetical direct photosynthetic generation of a C7:N1 biomass would make the same ∼28 e− and ∼28 ATP allocation to C assimilation, but 4–6 e− and 9 ATP towards N assimilation, i.e. 32–34 e− and 37 ATP total.
Thus, there is a lower electrons demand but higher ATP demand for photosynthetic growth under diazotrophy.
Alternately stated, when growing on NO3− the photosynthetic production of biomass uses ∼38 e−/30 ATP ≈ 1.27 e−/ATP ratio, closely matching the output of the photosynthetic electron transport coupled to proton translocation, i.e. 1.33 e−/ATP. In contrast, photosynthetic diazotrophy requires only a 32–34 e−/37 ATP ≈ 0.9 e−/ATP ratio to accumulate the same biomass, resulting in a mismatch between the output of (linear) photosynthetic electron transport and metabolic requirements. Hence, these alternative modes of growth could cause differences in photosynthetic resource allocation and performance. Note that these estimates shift further if NO3− or N2assimilation are fueled indirectly by respiratory oxidation of carbohydrate because the yield of ATP/e− then depends upon the relative allocation of electrons to respiratory electron transport vs. recycling into assimilatory paths. Furthermore, the assembly, protection, and daily de novo (re)synthesis of the iron-rich, labile nitrogenase complex imposes additional costs upon diazotrophic cells (Großkopf and LaRoche, 2012), which are expected to be higher than the cost of maintenance of the more stable enzymes of the NO3−
/NO2−
uptake and reductase system.
While NO3− assimilation can occur in the light and, therefore, be directly provisioned with electrons and ATP by photosynthesis,Cyanothecefixes N2during the night, using both electrons and ATP generated at the expense of respiration of previously stored carbon reserves. Thus, each electron and ATP equivalent ultimately destined for N2-fixation passes transiently through a CH2O reserve stage, increasing the instantaneous burden upon the carbon assimilation system during the photoperiod. Efficient carbon acquisition and storage is therefore essential for the diazotrophic growth of Cyanothece. It is, however, unknown how the processes of photosynthesis, carbon storage and N2-fixation interact to optimize light saturated growth with dissolved inorganic carbon (DIC) that transitions from replete to a possible DIC limitation during the day, and back to DIC replete conditions during the night. These temporal shifts in DIC availability further exacerbate the competition for electrons between CO2and nitrogen sources.
In the following, we assess the energetic demands of Cyanothece under diazotrophic growth versus reductive assimilation of NO3− and we describe the related electron
Frontiers in Microbiology | www.frontiersin.org 3 April 2021 | Volume 12 | Article 617802
transport and biomass dynamics when a periodical DIC limitation negatively affects carbon fixation. Cultures were continuously maintained in a state of exponential growth using bioreactors run in turbidostat mode. Using these systems, we simultaneously monitored photosynthetic electron transport, the electron requirement for carbon fixation, as well as carbon and nitrogen acquisition and incorporation in cells. We also evaluated whether the additional energy demand for N2-fixation translated into greater carbon storage or consumption. All these parameters were obtained from a variety of analyses, some of which are described in more details in theSupplementary material.
MATERIALS AND METHODS
The core of this study uses a close monitoring of the dynamics of the photosynthetic apparatus (detailed below) to trace electron fluxes through/around photosystems, with parallel assessments of the related carbon fluxes, carbon and nitrogen storage, and of the overall growth efficiency. The monitoring was completed with a series of bulk analyses (cell counts, biomass, cellular C and N contents, and an assessment of carbon allocation using Fourier Transform Infrared Spectroscopy (FTIR, Supplementary Figure 1)).
UV-Vis spectroscopy was applied to determine the pigment composition of the cells including Chl a, carotenoids and phycobiliproteins (Table 1), while Photosystem I to Photosystem II (PSI:PSII) and phycobilisomes to PSII abundance ratios were derived using low temperature (77K) fluorescence emission spectroscopy (Supplementary Figure 2). The specific growth rates were derived from changes in optical density (Supplementary Figure 3, Figure 1). Online monitoring of dissolved O2 concentrations in the cultures informed on the net production or consumption of oxygen (Figure 2 and Supplementary Figure 4). Last, photosynthetic efficiency was monitored using a membrane inlet mass spectrometer (MIMS). Specifically, gross and net O2 fluxes in light and dark were measured using an 18O2-based approach that allows for differentiating between photosynthetic O2 evolution and light-dependent O2 uptake by Mehler reaction and photorespiration (Supplementary Figure 5). Additionally, CO2 draw down by the cultures was monitored while simultaneously observing O2 fluxes (Supplementary Figure 6;
see Supplementary material). We detail below the conditions under which the experiments were performed as well as the methodology related to the photosynthetic activity measurements, which constitute the core of the work. The methods related to all other parameters can be found in the Supplementary material.
Cyanobacteria Culturing
Cyanothecesp. ATCC 51142 was cultivated in flat panel FMT-150 photobioreactors (Photon Systems Instruments, Drásov, Czech Republic) of 400 mL or 1000 mL volume at 28◦C in ASP 2 medium (Provasoli et al., 1957;van Baalen, 1962) buffered with 15 mM TAPS (pH of the medium was set to 7.8 by addition of a few drops of 1 M NaOH). Since the pioneering works of
Reddy et al. (1993), ASP 2 medium has been widely used to grow the genusCyanothece. ASP 2 medium was either prepared without addition of inorganic nitrogen (for N2 fixing cultures, thereafter called N2-fixing cultures.) or supplemented with NO3−
(17.6 mM) for the nitrate-rich cultures (thereafter called NO3− cultures). Both these treatments were run in triplicate and all cultures were bubbled with ambient air (∼410 ppm CO2) with a flow rate of 200 mL min−1, as controlled by a gas monitoring system described in detail in (Cervený et al., 2009). The airˇ was supplied to the culture through U-shape metal tubes with four perforations of 0.7 mm diameter along the bottom part.
This resulted in an average bubble size of diameter 2.6 mm (Nedbal et al., 2010). A vent topped with an air filter (Minisart, hydrophobic, 0.2µm) connected the culture headspace with the atmosphere. Additional cultures were run with the exact same setup but with a regulated CO2 supply as a control for DIC replete cultures.
Illumination was provided by cool-white LEDs following 14h:10h L:D daily cycles with maximal light intensity set to 300 µmol photons m−2 s−1. The light intensity of the initial and the final hour of each light cycle was set to follow a sinusoidal increase and decrease, respectively. Built in probes mounted within the reactors allowed a real-time, continuous monitoring of dissolved O2 (InPro6800 electrode), pH and temperature (InPro3253, both probes are manufactured by Mettler-Toledo Inc, Columbus, OH, USA), the yield of steady- state chlorophyll a (Chl a) fluorescence emission using an built in pulse-amplitude modulated system, as well as optical density measured at as well as OD720 (as a 428 proxy for light scattering) and OD680 (as a proxy for both 429 light scattering and Chl a concentration). The pH and dO2 probes were calibrated before and after the experiment while the OD sensors were calibrated only before the experiments, both according to the instructions of the manufacturer. Cultures were run in turbidostat mode controlled by the OD680 signal (see theSupplementary filefor detailed methodology). The specific growth rate in each culture was determined by exponential fitting of the OD720 signal (Supplementary Figure 3) provided by the built in sensor during the turbidostat mode, according to (Zavˇrel et al., 2015).
Cyanothecewas cultivated continuously for at least 21 days, and sampled regularly four times a day after cultures had reached equilibrium. Time is expressed in hours into the 14h:10h light cycle: the prefix L indicates hours in the light (from L0 to L14) and the prefix D means hours into the dark (from D0 to D10).
Samples were taken at the onset of the light (L0), after two hours of light (L2), at mid-light phase (i.e. after 7h of light, L7), and at the time of light to dark transition (L14 = D0). Some additional samples were also taken after 1h of light (L1) and after 2 or 4 hours of darkness (D2 and D4, respectively).
Photosynthetic Activity Measurements
PSII Kinetics
Variable fluorescence data were collected using a FastOcean Fast Repetition Rate fluorimeter (FRRf, Chelsea Technologies Group, West Molesey, Surrey, UK) on culture samples acclimated to
fmicb-12-617802April5,2021Time:17:7#5
Rabouilleetal.Electron&BiomassDynamicsinCyanothece
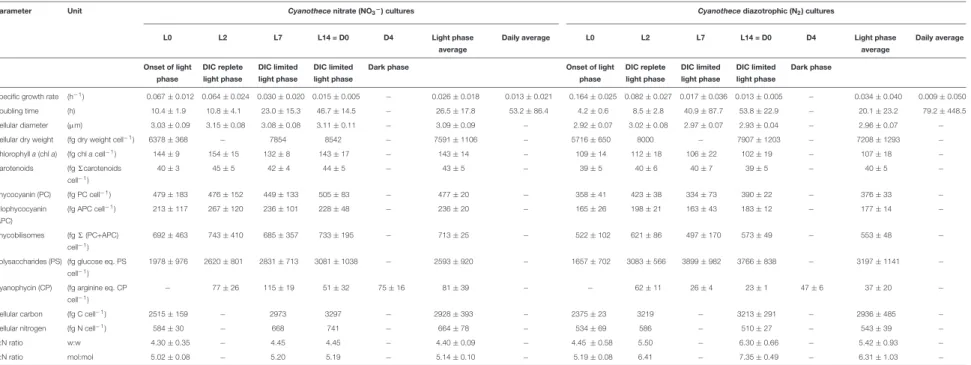
TABLE 1 |Morphology and composition ofCyanothececells cultivated in ASP2 medium supplemented with nitrate (NO3−) or under obligate diazotrophic (N2) conditions, normalized per cell.
Parameter Unit Cyanothecenitrate (NO3−) cultures Cyanothecediazotrophic (N2) cultures
L0 L2 L7 L14 = D0 D4 Light phase
average
Daily average L0 L2 L7 L14 = D0 D4 Light phase
average
Daily average
Onset of light phase
DIC replete light phase
DIC limited light phase
DIC limited light phase
Dark phase Onset of light
phase
DIC replete light phase
DIC limited light phase
DIC limited light phase
Dark phase
Specific growth rate (h−1) 0.067±0.012 0.064±0.024 0.030±0.020 0.015±0.005 − 0.026±0.018 0.013±0.021 0.164±0.025 0.082±0.027 0.017±0.036 0.013±0.005 − 0.034±0.040 0.009±0.050
Doubling time (h) 10.4±1.9 10.8±4.1 23.0±15.3 46.7±14.5 − 26.5±17.8 53.2±86.4 4.2±0.6 8.5±2.8 40.9±87.7 53.8±22.9 − 20.1±23.2 79.2±448.5
Cellular diameter (µm) 3.03±0.09 3.15±0.08 3.08±0.08 3.11±0.11 − 3.09±0.09 − 2.92±0.07 3.02±0.08 2.97±0.07 2.93±0.04 − 2.96±0.07 −
Cellular dry weight (fg dry weight cell−1) 6378±368 − 7854 8542 − 7591±1106 − 5716±650 8000 − 7907±1203 − 7208±1293 −
Chlorophylla(chla) (fg chlacell−1) 144±9 154±15 132±8 143±17 − 143±14 − 109±14 112±18 106±22 102±19 − 107±18 −
Carotenoids (fg6carotenoids
cell−1)
40±3 45±5 42±4 44±5 − 43±5 − 39±5 40±6 40±7 39±5 − 40±5 −
Phycocyanin (PC) (fg PC cell−1) 479±183 476±152 449±133 505±83 − 477±20 − 358±41 423±38 334±73 390±22 − 376±33 −
Allophycocyanin (APC)
(fg APC cell−1) 213±117 267±120 236±101 228±48 − 236±20 − 165±26 198±21 163±43 183±12 − 177±14 −
Phycobilisomes (fg6(PC+APC)
cell−1)
692±463 743±410 685±357 733±195 − 713±25 − 522±102 621±86 497±170 573±49 − 553±48 −
Polysaccharides (PS) (fg glucose eq. PS cell−1)
1978±976 2620±801 2831±713 3081±1038 − 2593±920 − 1657±702 3083±566 3899±982 3766±838 − 3197±1141 −
Cyanophycin (CP) (fg arginine eq. CP
cell−1)
− 77±26 115±19 51±32 75±16 81±39 − − 62±11 26±4 23±1 47±6 37±20 −
Cellular carbon (fg C cell−1) 2515±159 − 2973 3297 − 2928±393 − 2375±23 3219 − 3213±291 − 2936±485 −
Cellular nitrogen (fg N cell−1) 584±30 − 668 741 − 664±78 − 534±69 586 − 510±27 − 543±39 −
C:N ratio w:w 4.30±0.35 − 4.45 4.45 − 4.40±0.09 − 4.45±0.58 5.50 − 6.30±0.66 − 5.42±0.93 −
C:N ratio mol:mol 5.02±0.08 − 5.20 5.19 − 5.14±0.10 − 5.19±0.08 6.41 − 7.35±0.49 − 6.31±1.03 −
The four time points represent the onset of light phase (L0), DIC replete light phase (L2) and DIC limited light phase (L7, L14) (seeFigure 1). Data represent averages from samples taken over successive days in 3 culture replicates, error intervals represent standard deviations. When no error intervals are available, n≤2.
FrontiersinMicrobiology|www.frontiersin.org5April2021|Volume12|Article617802
FIGURE 1 |Record of dynamics in optical density measured at 680 nm [black lines; OD680,(A,B)] and 720 nm [gray lines; OD720,(C,D)] together with cell abundance [gray circles;(A,B)] ofCyanotheceturbidostat cultures cultivated in ASP 2 medium supplemented with NO3−(A,C)and under obligate diazotrophy (B,D). The OD680(more sensitive to changes in Chlacontent) and OD720(more sensitive to changes in non-pigment biomass) signals are measured within the photobioreactor vessel and represent a typical record of optical density over a diel cycle. The cell abundance data are averages from 9 samples from 3 independent bioreactors for each treatment; error bars show standard deviations. The gray dashed lines show the light profile throughout the day. Black arrows point to the first culture dilution event at the beginning of each light phase, while the gray arrow points to the last dilution event in the N2-fixing culture.
low light (ca. 5 µmol photons m−2 s−1 for at least 20 min) to ensure full oxidation of the electron transport chain prior to measurements, as described previously (Suggett et al., 2015).
Briefly, the FRRf was set to deliver a single turnover induction protocol of 100 flashlets over ca. 200 µs (2µs flashlet pitch).
Excitation was provided from a bank of blue and orange LEDs (setting of ELED 450 nm of 1.10 and ELED 624 nm of 1.26) to ensure full and consistent QA reduction. Measurements were recorded as an average of 10 consecutive acquisitions applied at intervals of 200 ms. Each FRRf acquisition was then fitted to the KPF model (Kolber et al., 1998) using FastPRO8 software (Chelsea Technologies Group) to yield the minimum (F0, or F0) and maximum (FM,or FM0
) PSII fluorescence, PSII absorption cross-section (σPSII, or σPSII0
; nm2 photon−1) for dark and actinic light (0) conditions. After the single turnover induction to close PSII the flashlet pitch was slowed to allow estimation of the lifetime for re-opening of PSII by downstream electron transport (τorτ0,µs). All fluorescence yields were adjusted for baseline fluorescence retrieved from parallel FRRf measurements upon filtrates of each sample passed through a 0.22 µm pore filter (cellulose acetate, syringe filter; Whatman, USA). Values of σPSIIwere taxonomically weighted to the composite blue-orange excitation spectra and thus spectrally adjusted to match a white
spectrum (Suggett et al., 2004). We used these parameters to quantify PSII electron transport during the light cycle, following:
e−PSII−1s−1 = σPSII/(FV/FM) × YII × I(photons m−2s−1) (10) where YII is the effective quantum yield of photosystem II photochemistry, calculated as
YII = (F0M−F0)/F0M (11) PSI Kinetics
PSI parameters were determined using a Dual-PAM-100 measuring system (Walz GmbH, Effeltrich, Germany). 3 mL of cell suspension were filtered through a GF/F filter and placed between the perspex rods of the emitter (DUAL-E) and detector (DUAL-DR) units of the system using a DUAL-B leaf holder. A default “induction with recovery” protocol was run after 2 min of dark adaptation, with 10 s of initial far red illumination followed by 40 s darkness and, subsequently, by 200 µmol photons m−2 s−1 red actinic light with saturating pulses (30 ms, 10.000 µmol photons m−2 s−1) on top. These saturating pulses (SPs) served to probe maximal P700levels in
fmicb-12-617802 April 5, 2021 Time: 17:7 # 7
Rabouille et al. Electron & Biomass Dynamics in Cyanothece
FIGURE 2 |Dynamics of dissolved oxygen(A,B), pH(C,D), and dissolved inorganic carbon [DIC,(E,F)] in continuousCyanothececultures grown in ASP 2 medium either supplemented with NO3−(A,C,E)or not(B,D,F), throughout the daily 14h/10h light/dark cycle. Each trace represents averages of 5–6 light/dark cycles of 2 (A–D)or 3(E)(with the exception of L3 sample withn= 2),(F)independent cultures, with error intervals and bars, respectively (representing standard deviations).
The dotted lines in panels(A,B)represent the level of O2equilibrium at 28◦C in the medium, while the gray dashed line in each panel represents the light profile throughout the day.
the dark and during the actinic illumination (Pm and Pm0, respectively). SPs were given at 20 s intervals over the actinic light period and the average of signal intensities at pulses 2 to 5 (4 pulses) were considered in order to minimize the effect of state transitions on the PSI quantum yields [Y(I)] that might have been induced by the dark adaptation. Raw data were corrected by subtracting a blank value of about 19.5 mV, determined by using a wet filter paper without Cyanothece cells. ETR(I) was subsequently normalized according to Pm values (to take into account changes in PSI abundance) and Chl a concentration. Rates of P700 re-reduction kinetics were
calculated from manually determined t1/2values using saturating pulses during the initial dark period of the “induction with recovery” protocol.
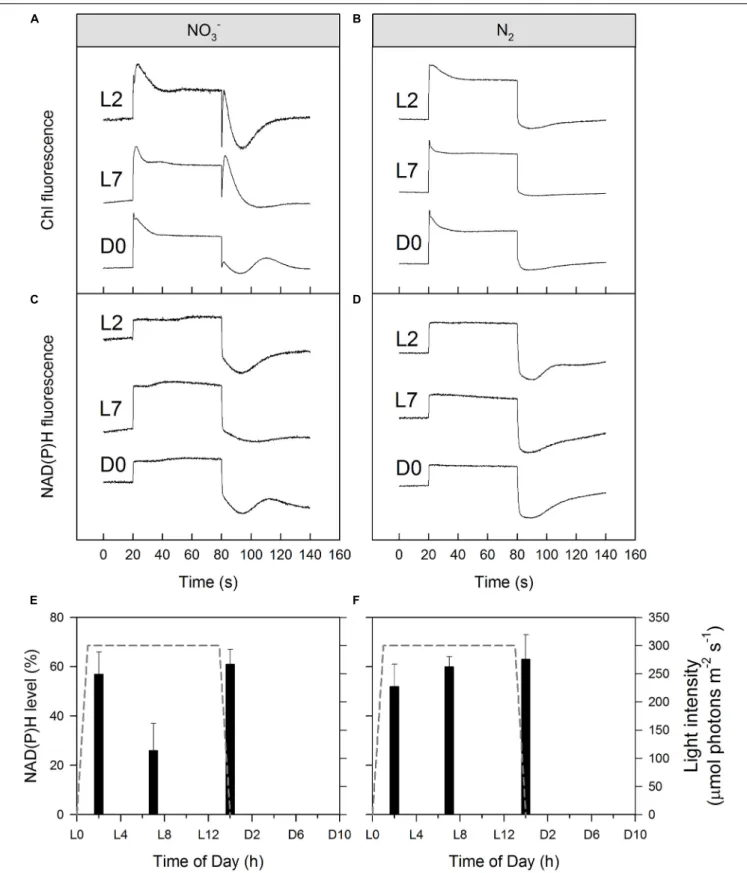
NAD(P)H Kinetics
Light-induced formation of NAD(P)H as well as its post- illumination reduction to NAD(P)+, and concomitant changes in Chl a fluorescence was probed using cell suspensions filled into a standard 1 cm quartz cuvette placed in the Optical Unit ED-101US/MD of the Dual-PAM-100 measuring system (Walz).
Simultaneous detection of NAD(P)H and Chlafluorescence was
Frontiers in Microbiology | www.frontiersin.org 7 April 2021 | Volume 12 | Article 617802
performed using a NADPH/9-AA module (consisting DUAL- ENADPH and DUAL-DNADPH) combined with DUAL-DPD and DUAL-DR (Schreiber and Klughammer, 2009). Before measurements, samples were spun down and resuspended in fresh ASP 2 medium supplemented with NO3− (nitrate-rich cultures) or not (obligate diazotrophic cultures), for a final Chl a concentration of 7 µmol−1 followed by 10 min of dark adaptation. Then, 60 s of 200µmol photons m−2s−1red actinic light was applied to initiate photosynthetic electron transport and NAD(P)H and Chlafluorescence were simultaneously recorded.
Dark NAD(P)H reduction level was estimated by dividing the signal increase upon illumination with the total signal amplitude between the maximum upon illumination [NAD(P)H] and post- illumination minimum [NAD(P)+]:
100 × [NAD(P)H]/([NAD(P)H] + [NAD(P)+]) (12) Post-illumination increase of the Chlafluorescence (if any) was interpreted as reduction of the PQ pool (Deng et al., 2003).
RESULTS AND DISCUSSION
Continuous Cyanothece cultures were cultivated in photobioreactors in two distinct growth regimes: either (i) in standard ASP 2 medium supplemented with NO3− as nitrogen source, or (ii) in a modified ASP 2 medium without NO3−, to impose dependence upon N2-fixation. Overall, and across our 4-day monitoring during the equilibrium phase (within a 19-day experiment; see Materials & Methods), the average growth rates are 0.22±0.07 d−1in N2-fixing cultures and 0.30 ± 0.08 d−1 in the NO3− cultures. These values are significantly different (p < 0.05, ANOVA, Tukey HSD test, n = 7 consecutive days for N2-fixing cultures and 11 for NO3− cultures) and reflect the overall lower growth in cells growing as obligate diazotrophs compared to cells growing on NO3−
. When integrated from the transient, hourly growth phases (Tables 1, 2andSupplementary Figure 3), the daily mean and SD values of the specific growth rates are 0.21±1.19 d−1in the N2-fixing cultures and 0.31 ±0.51 d−1 in the NO3− cultures. The large standard deviations illustrate that instantaneous, metabolic processes are highly dynamic and lead to significant variability in transient cell growth processes within a 24 h period. For instance, and as discussed below, apparent negative growth rates obtained in the early dark phase in the N2-fixing cultures are related to the significant consumption of carbon reserves to fuel N2-fixation, which led to a decrease in the overall carbon biomass (hence in optical density).Cyanothecehas achieved much higher growth rates in other studies (see for instanceReddy et al., 1993;
Agawin et al., 2007;Brauer et al., 2013), and we believe the lower achieved growth in our bioreactor experiments results from transient DIC limitations. In an ocean acidification scenario with elevated pCO2 and DIC levels (380 vs. 980µatm pCO2, 1970 vs. 2150µmol kg−1 DIC), increased particulate organic carbon (POC) and nitrogen (PON) production rates inCyanothecewere attributed to lowered energy costs for the CCM (Eichner et al., 2014). Similarly, Crocosphaera grown diazotrophically under
low pCO2 treatment (180 ppm) shows a lowered growth rate compared to a high pCO2(800 ppm), which was attributed to an ATP deficit due to the extra energy invested in the CCM (Garcia et al., 2013). As we will see below, the efficiency of CCM in the studiedCyanotheceis limited and, in addition to the energy cost to operate these mechanisms, a remaining carbon limitation likely still hinders carbon acquisition in both treatments as DIC levels in the bioreactors are drawn down.
Biomass Buildup and Transient Growth Dynamics Within the Light Cycle
As cell sizes differ slightly, but significantly, between the two treatments (mean comparison test, n = 32, p < 0.001), the concentration of all major cellular components are expressed on both cell (Table 1) and biovolume bases (Table 2). On average, diameters of cells grown on NO3− are 5% larger (3.12± 0.05 µm vs. 2.96 ± 0.05 µm; Table 1) and accumulate 19% more nitrogen, in particular in pigments and nitrogen storage pools (see Supplementary Material). In contrast, although the daily average of total cellular carbon content is similar in both types of cultures, and they also both show a diurnal increase in cellular carbon content, the diel pattern of a carbon storage strategy is more pronounced in the N2-fixing cultures. FTIR spectra reveal striking differences in carbon allocation into carbon reserves and their temporal dynamics (Supplementary Figure 1) with, in particular, larger allocation into the carbohydrate pools and a storage buildup strategy in the N2-fixing cultures, while the NO3− cultures tend to accumulate more proteins.
The carbohydrate content of the cells determined by FTIR increases linearly during the light period. By the end of the light period, the carbohydrate content of the NO3− culture increased by 50%, while carbohydrate content of the N2- fixing culture increased by 230%, compared to onset of light (Supplementary Figure 1). The strategy ofCyanotheceto store significant carbon reserves in the light to operate a respiratory protection of nitrogenase and to fuel N2-fixation during the dark is well known (Reddy et al., 1993;Schneegurt et al., 1994).
We further see here that this strategy is quite adaptable as, when provided with NO3−, the extra energy that N2-fixation required is no longer needed and Cyanotheceaccumulates far lower reserves in the light.
Slight differences can be observed in the temporal dynamics of proteins, which can be related to the N acquisition strategy (nitrate uptake in the light phase vs. N2-fixation in the dark phase), as shown by the analysis of FTIR spectra (see Supplementary Material). However, the amplitude of protein fluctuations is quantitatively comparable in the two treatments and the protein content of both cultures is similar at the end of the light phase (Supplementary Figure 1).
In the subsections below, we use biochemical data to describe the growth dynamics observed in each treatment within the light cycle. We will see that cultures pass through two distinct phases during the light period: firstly, a DIC-replete, light-saturated phase that lasts for about 3 h in the N2-fixing cultures and 4h in the NO3− cultures, followed by a DIC-limited phase for the rest of the light period. Then, clear differences in their
![FIGURE 1 | Record of dynamics in optical density measured at 680 nm [black lines; OD 680 , (A,B)] and 720 nm [gray lines; OD 720 , (C,D)] together with cell abundance [gray circles; (A,B)] of Cyanothece turbidostat cultures cultivated in ASP 2 medium suppl](https://thumb-eu.123doks.com/thumbv2/9dokorg/768254.34025/6.892.69.828.94.541/figure-dynamics-measured-abundance-cyanothece-turbidostat-cultures-cultivated.webp)
![FIGURE 2 | Dynamics of dissolved oxygen (A,B), pH (C,D), and dissolved inorganic carbon [DIC, (E,F)] in continuous Cyanothece cultures grown in ASP 2 medium either supplemented with NO 3 − (A,C,E) or not (B,D,F), throughout the daily 14h/10h light/dark cyc](https://thumb-eu.123doks.com/thumbv2/9dokorg/768254.34025/7.892.68.825.91.760/dynamics-dissolved-dissolved-inorganic-continuous-cyanothece-cultures-supplemented.webp)
![FIGURE 3 | Dynamics of steady-state fluorescence yield, F t [open circles; (A,B)], maximal fluorescence yields, F M and F M 0 [open triangles; (A,B)] and quantum yield of PSII, Y II [open circles; (C,D)] during Cyanothece cultivation in ASP 2 medium supple](https://thumb-eu.123doks.com/thumbv2/9dokorg/768254.34025/12.892.68.828.94.583/figure-dynamics-fluorescence-circles-fluorescence-triangles-cyanothece-cultivation.webp)
![FIGURE 6 | Dynamics of PSI-mediated electron flow [ETR(I)] during Cyanothece cultivation in ASP 2 medium supplemented with NO 3 −](https://thumb-eu.123doks.com/thumbv2/9dokorg/768254.34025/16.892.68.828.93.617/figure-dynamics-mediated-electron-cyanothece-cultivation-medium-supplemented.webp)