Title: Complement Analysis in the Era of Targeted Therapeutics
Authors: Zoltán Prohászka1, Michael Kirschfink2, and Ashley Frazer-Abel3
Affiliations:13rd Department of Medicine. and MTA-SE Research Group of Immunology and Hematology, Hungarian Academy of Sciences and Semmelweis University,
Budapest, Hungary; 2Institute of Immunology, University of Heidelberg; 3Exsera BioLabs, University of Colorado Department of Medicine
Keywords: complement, standardization, therapeutics, diagnostic techniques and
procedures, pre-analytic, quality control, CH50, sC5b-9, complement activation, complement diagnostics
Corresponding author: Ashley.frazer-abel@ucdenver.edu
Abstract:
Complement immunobiology, and with it complement analysis, has undergone a renaissance in the past decade. Classically, complement analysis involved a limited number of tests on C3, C4 and CH50 and was performed in highly esoteric laboratories.
This is rapidly changing with routine laboratories now being called upon to do a rapidly expanding menu of testing and to do that testing more expeditiously. This is the result of the growing recognition of the role played by complement dysfunction in many more diseases and disorders and the concomitant increase in interest in complement
targeting therapeutics. In response, laboratories specializing in complement analysis have joined with the International Complement Society to coordinate efforts to
standardize and improve complement testing, ongoing efforts that have already borne fruit. A recognition of the power of complement analysis has brought forward new testing and a new realization of the importance of post-draw specimen handling, as well as awareness of the potential for confounding changes in an individual subject. The increased usefulness of complement testing and the work to standardize and expand it means the future is strong for complement analysis.
Changing Landscape of Complement Testing: Growing Clinical Importance
For decades the primary, and nearly exclusive, use of complement testing was to test for primary immunodeficiencies or to test for disease activity in systemic
autoimmune diseases, with a limited number of rheumatological or nephrology disorders (Ricklin, Hajishengallis et al. 2010, Skattum, van Deuren et al. 2011, de Cordoba,
Tortajada et al. 2012, Holers 2014). Only a small number of tests were used, mainly to assess total complement function, C3 and C4. While specificity was important, not a great deal of sensitivity was needed. With the abundance of components of
complement in circulation, C3 being the highest at 1 to 1.5 mg/mL, the presence or absence of the proteins in the cascade could be measured by relatively simple methods (Morley and Walport 2000). However, the field has changed dramatically due to
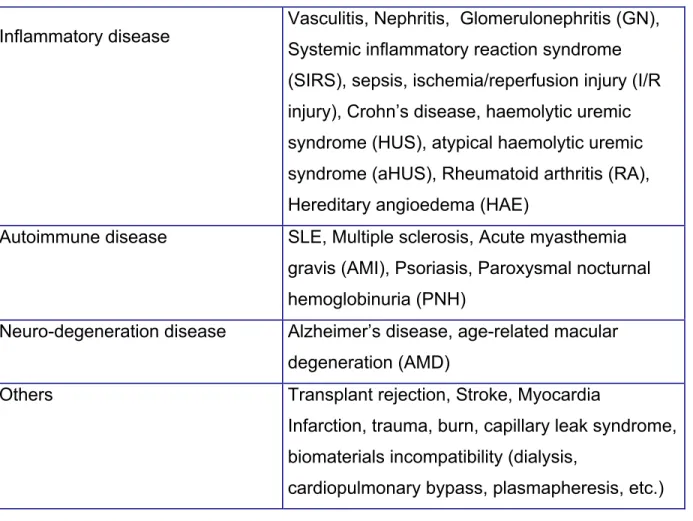
significant developments in complement science. First, there has been a notable increase in the number of diseases and disorders recognized to have complement involvement (Table 1) (Thurman and Holers 2006, Hajishengallis, Reis et al. 2017). The
diseases now recognized to connect to complement are anatomically diverse, ranging from the kidney to the eye, as well as ranging from the rare atypical hemolytic uremic syndrome to common disorders like age-related macular degeneration. The
pathophysiology of these disorders often traces back to the strong pro-inflammatory properties of complement which can affect so many properties of biology in so many tissues and organ systems. That can, in turn, be traced back to the original task of complement which is to fight infection. As a first line of defense, complement has a powerful potential to tag and even destroy invading microbes while activating the larger immune system to clear the potential damage (Walport 2001, Skattum, van Deuren et al. 2011). These are functions that can be very damaging if turned on the host tissues.
Many of the complement-connected disorders are, unsurprisingly, associated with an inappropriate over-activation of complement or with a failure to control complement.
Some of these activations or losses of control, such as seen for mutations in
complement Factor H, can be far more subtle than the yes or no deficiency historically diagnosed by a clinical lab (Jozsi, Tortajada et al. 2015, Medjeral-Thomas and Pickering 2016, Parente, Clark et al. 2017). The mutations can involve subtle changes in
function, changes limited to circulation or to those on a surface. Detecting these more nuanced changes in complement requires more nuanced testing in the diagnostic laboratory.
The second event that has changed the landscape for complement testing was the advent of therapeutics that directly target complement (Ricklin, Mastellos et al.
2017). Starting in 2007, the first complement-specific therapeutics entered the market.
With this there is a need to not only diagnose the disease but also follow the treatment.
This changed the analysis from needing to show only if a complement component were deficient to needing to know if the function was suppressed to 10% of normal, for
example (Prohaszka, Nilsson et al. 2016). This led to the development of new assays and to the appreciation of new values in existing, but formerly rare or esoteric, tests. In addition, it has helped propel efforts to improve the standardization between
laboratories and the quality of complement testing overall. This means existing
laboratories specializing in complement have improved, plus there is now an increase in complement testing in the more general, large laboratories. This produces more
pressure for the tests to be robust and approachable (Mollnes, Jokiranta et al. 2007).
The system that needs this robust testing is a set of proteins involved in the interconnect cascade of pro-enzymes, enzyme regulatory proteins, recognition molecules, signing molecules and the receptors that constitute complement.
Complement was first described in the late 1800’s, but the list of components continues to grow. The complement system is composed of more than 30 proteins. This cascade as long been known for its ability to kill invading microbes at first exposure. As part of the innate immune system, differentiation of self from non-self involves important tagging of self and control of complement on host surfaces (Zipfel and Skerka 2009, Ricklin, Hajishengallis et al. 2010).
Importance of complement functional testing:
Some of the earliest testing performed for complement was functional testing, and the utility and interest in the analysis of function of complement remains
(Prohaszka, Nilsson et al. 2016). In one functional assay it is possible to test for the
presence and functionality of all the components of an activation pathway and the terminal pathway at once (Figure 1A). This ability to broadly test for complement
function of a number of components of the cascade has led to the testing being referred to as a “Total Complement Activity” test, but it generally references the classical
pathway functional assays. Functional complement testing proved very useful in screening for an immunodeficiency or complement activation with consumption. For immunodeficiency testing the more common classical pathway activity test (also called 'CH50') is combined with an alternative pathway activity (or AH50) assay to quickly determine where in the pathway a deficiency lies; classical, alternative, or the shared terminal (Figure 1A). This dramatically reduces the work required to determine the specific component deficiency. On the activation side, if a patient has an ongoing complement consumption that in turn depletes the amount of available complement that reduction is reflected in a decreased measurable function. This has proved useful for testing for flares in autoimmune disease (Spronk, Limburg et al. 1995, Leffler,
Bengtsson et al. 2014). This utility has been the prime driver in the development of the now multiple methods for testing complement function. The types of complement functional analysis largely fall into three categories, each with their own benefits and disadvantages. What these tests share is a need to first activate the specific pathway of interest, then measure the formation of the terminal complement complex in solution or by functional outcome. The buffer components, or the addition of inhibitory antibodies, are used to keep the other activation pathways in check. For example, the inclusion of calcium chelators (e.g. EDTA) can inhibit the classical pathway through destablization of the C1 complex (Eagle and Brewer 1929, Kabat and Mayer 1961). The most historic
form of complement function testing is what is referred to as a hemolytic test. In this method, an animal red blood cell (RBC), generally a sheep RBC, is coated with antibodies (hemolysin) making it an optimal target for classical pathway recognition.
This recognition leads to activation which then results in the formation of the membrane attack complex (MAC) on the surface of the red blood cell. The MAC leads to lysis of the RBC and release into solution of the hemoglobin (Kabat and Mayer 1961). The hemoglobin is easily quantitated by spectrophotometry which can then be related back to the percentage of RBC’s that were lysed and the functionality of complement to do the lysing. As this is a sequential cascade involving the whole pathway, the relation between the concentration of serum and the amount of lysis is not linear. It is instead more sigmoidal, following the von Krug equations (Jackson, Basinger et al. 1970).
Therefore, the traditional method for running a hemolytic assay was to run a five-point serial dilution of serum or plasma, then use the three points that form the most linear portion of the curve that covers the mid-point of lysis, where half the RBC are lysed.
From there the dilution that would lead to lysis of exactly 50% of the RBC is calculated, and the result reported as the reciprocal of that dilution (Kabat and Mayer 1961). Some of the newer methods instead will report results as percentage of a normal or standard value. For the hemolytic method it is the relation to the report of the 50% lysis point that gives the test the abbreviated CH50 for the classical pathway assay. A similar assay, the AH50, can be performed where the target RBC is of rabbit or chicken origin, not from sheep, which is an activating surface for the alternative pathway; the classical pathway is kept inactive by chelating calcium (e.g. by EGTA) necessary to maintain the C1 complex. These hemolytic assays have the advantage of having the greatest
sensitivity at the low end of function. Since they are also so complex, however, a
specialized laboratory is required. Because they rely on live cells, there is the potential for variability in supply that needs to be very carefully controlled.
The most common method used in US clinical laboratories for measuring total complement is based on lysis of a liposome. In this assay a synthetic liposome stands in for the RBC of the hemolytic assay. The liposome is loaded with an enzyme, such as glucose-6-phosphate, that is easily measured on a common clinical laboratory
chemistry analyzer (Frazer-Abel, Sepiashvili et al. 2016). As for the CH50, the liposome is coated with antibody to activate the classical pathway, one concentration of serum or plasma is then used in the reaction mixture and the amount of enzyme release is
measured. This assay is very well suited to a large hospital-type laboratory, as it is automated with high throughput, thus fairly inexpensive to run. This testing has proven very useful when a fast yes or no answer is needed, but there is evidence that this type of assay is not sufficiently sensitive for monitoring nuanced changes at either end of the functional spectrum (Gatault, Brachet et al. 2015). It is important to keep this in mind when measuring low levels of remaining function in order to monitor the effectiveness of a therapeutic complement blockade.
A more recent addition is the ELISA style complement function assays. There are currently at least three commercially available forms of the classical pathway
function assay that have regulatory approval in the US (Quidel & DiaSorin) or in the EU (Wieslab, Eurodiagnostica). These assays have rapidly gained popularity and are now utilized by an increasing number of laboratories. As an ELISA style assay, it is well suited to being run in an immunology laboratory without access to high quality RBC and
without requiring the same level of expertise in complement analysis. While the three assays differ they all utilize antibodies on the plate, or complexes in solution, to activate the C1 complex and then measure the production of the membrane attack complex, a measure of the level of complement activation that occurred. Wieslab also has kits for the alternative and lectin pathway function which afford a more complete investigation of complement function (Mollnes, Jokiranta et al. 2007). Like the liposomal assay, these are largely regulatory-approved assays for patient diagnostics, and therefore they have the benefit of strong supply chain control, low lot-to-lot variability and higher throughput than the traditional hemolytic assay. Depending on the assay and the way the data is calculated, the sensitivity can be better than the liposomal assay at the lower end of function. This makes these assays generally well suited to follow the therapeutic blockade of complement, perhaps trading some low level detection for more consistent quantitation and reproducibility than the hemolytic assay generally.
For the monitoring of complement blockade by therapeutics, the functional assays remain the most common assay. However, there is growing interest in
measuring the split products (C4d, C3a, C3d or Bb) and complexes (sC5b-9) to look at the level of complement activation or inhibition. These assays have the potential to add more detail and sensitivity to the functional assays. Measurements of the soluble terminal pathway activation complex sC5b-9 (sometimes referred to as soluble
membrane attack complex, sMAC) can assess potential response level to complement blockade as well as monitor the completeness of that blockade. There have been some documented issues related to the consistency of results between laboratories (Bu, Meyer et al. 2015), however, measurements of the inhibition of the convertases has
been found by some laboratories to be a promising method for stratifying patients. This testing is currently available in a limited number of laboratories (Blom, Volokhina et al.
2014).
The value of measuring activation products can be twofold. First, they pinpoint one pathway or component. This has the potential to test the level of control of an individual component, in addition to being able to differentially specify which pathway is activated or inhibited (Frazer-Abel, Sepiashvili et al. 2016). As well as differentiating the point of activation or control, measurement of the split products or complexes can be more sensitive than the measurement of total function (Frazer-Abel, unpublished data).
The functional assays interrogate the whole pathway, so it is not possible to determine the specific rate-limiting component nor the step in the pathway. Combining
complement activation markers can reveal the point of inhibition and if that inhibition affects the upstream portion of the cascade or if the underlying complement activation is still in process (Figure 1B).
Complication of specimen handling:
Historically one of the bigger impediments to the adoption of complement testing by physicians has been the potential issues around ex vivo activation of complement and the resulting uncertainty of the results. It has long been known that if serum and plasma for complement analysis are not handled correctly, the results can differ greatly from the values for the patient at the time of draw. Work from Mollnes and colleagues demonstrated some pretty remarkable increases in the levels of activation fragments after storage a 4C (Mollnes, Garred et al. 1988). In work by Yang et al., they
concluded that if EDTA was included in the sample at a concentration of > 10mM the levels of C3a, C4d, C5a and sC5b-9 were consistent for four hours at room temperature and 24 hours at 4oC (Yang, McGookey et al. 2015). An important note for this testing was that it was performed on collections from normal individuals. A lot of testing for diagnostics or clinical trials will be performed on specimens from individuals with
ongoing complement activation, due to the presence of complement activators (immune complexes, cryoglobuline, paraproteins, septic samples, etc.), or dysregulation in the sample. If there is strong baseline in vivo activation there is the possibility of more ex vivo activation. For one patient, the level of C4a measured increased after one hour at room temperature and doubled at four hours. This variable has been found among patients, with some results remaining consistent over time. (unpublished data, Frazer- Abel). If you look at the specimen production instructions for a complement specialty laboratory or the instructions for sample preparation included in a complement kit inserts, the recommendations will be to get the specimen processed and frozen at - 80oC within an hour, or at most two hours. Even then there is data that storage at -80oC is not sufficient to stabilize complement for extended storage, over six to 10 years
(Morgan, O'Hagan et al. 2017).
In addition to sample handling concerns, there are also considerations around the subject. One of these factors can be the level of stress in the subject. Work from Burns et al. 2008 demonstrated marked increases in complement activation fragments in response to a psychological stress (Burns, Edwards et al. 2008). Normal subjects were giving a paced auditor serial addition task (PASAT) which has been shown to cause stress responses in individuals. For this testing an additional burst of noise was
included for each incorrect answer. C3a and Bb levels increased markedly at the time the task was performed while C5a increased 30 minutes after the test. Of potential importance for this study, all testing was performed in the afternoon. This is important because there is some data on the effect of the circadian rhythm and sleep on
complement levels. Work from Reis et al. in 2011 looked at the levels of C3 and C4 as well as the split product C3a over the circadian cycle (Reis, Lange et al. 2011). C3 and C4 levels decreased during the night, but the change was independent of the sleep- wake cycle. C3a, by contrast, increased at night but that increase was lost if the subject did not sleep. While there was some controversy around the circadian cycle effect on complement, there is clearly enough data to consider it a possibility. These factors point to the value of obtaining baselines levels on a patient or subject, if possible. While there are reference ranges for the complement components, there are also individual differences.
Progress and efforts to standardize complement analysis:
With this increased attention and the new demands on complement testing, it was clear to the experts that there was a need to improve the consistency and quality of the testing. From this recognized need, a standardization and quality committee was developed out of the XXIInd International Complement Workshop. In 2009, Dr. George Füst, of Semmelweis University, Third Department of Internal Medicine, Budapest (Hungary) was elected the chairman. The Sub-Committee for the Standardization and Quality Assessment of Complement Measurements was formally recognized and became part of the IUIS Quality Assessment and Standardization Committee
(Prohaszka, Nilsson et al. 2016). Since that time seven rounds of external quality assessment, now covering 18 parameters (function, proteins, activation products and autoantibodies), have been completed. These efforts have shown the need for such standards and resulted in improvements in the consistency of testing across
participating institutions, while extending the global reach of the efforts.
Now that these efforts are well underway and bearing fruit, efforts have turned to creating a recognized standard with defined amounts of the individual components.
These efforts are necessary because currently there is only one WHO standard that includes a limited number of complement analyses; it is now over 40 years old and increasingly difficult to obtain (1st International Reference Preparation, 1980, Code W1032; Document 80.1281; Human serum complement components C1q, C4, C5, factor B, and whole functional complement CH50).
Future of complement analysis?
Now that complement testing has moved beyond C3, C4 and CH50, it is unlikely to ever revert to the quiet recesses of esoteric testing. Complement is recognized to have roles in both devastating rare diseases and more common inflammatory and immunological disorders, so complement testing will only increase and improve. And while there have been substantial changes already, it is unlikely that the pace of these changes will slow. For example, multiplex analysis of complement has recently become available commercially in the Luminex format (Millipore Corp), and a number of other modalities are also being pursued in individual laboratories (e.g., Mass Sped and MSD Mesoscale). Having more quality testing available can only aid in connecting
complement to other places where it is a factor. Combining that with the potential for low volume requirements, the possibility of multiple results and the increased sensitivity that may be afforded by the newer methods the future of the field looks good.
References:
Blom, A. M., E. B. Volokhina, V. Fransson, P. Stromberg, L. Berghard, M. Viktorelius, T.
E. Mollnes, M. Lopez-Trascasa, L. P. van den Heuvel, T. H. Goodship, K. J.
Marchbank and M. Okroj (2014). "A novel method for direct measurement of complement convertases activity in human serum." Clin Exp Immunol 178 (1): 142- 153.
Bu, F., N. C. Meyer, Y. Zhang, N. G. Borsa, C. Thomas, C. Nester and R. J. Smith (2015). "Soluble c5b-9 as a biomarker for complement activation in atypical hemolytic uremic syndrome." Am J Kidney Dis 65 (6): 968-969.
Burns, V. E., K. M. Edwards, C. Ring, M. Drayson and D. Carroll (2008). "Complement cascade activation after an acute psychological stress task." Psychosom Med 70 (4):
387-396.
de Cordoba, S. R., A. Tortajada, C. L. Harris and B. P. Morgan (2012). "Complement dysregulation and disease: from genes and proteins to diagnostics and drugs."
Immunobiology 217 (11): 1034-1046.
Eagle, H. and G. Brewer (1929). "Mechanism of Hemolysis by Complement: I.
Complement Fixation as an Essential Preliminary to Hemolysis.” J Gen Physiol 12 (6): 845-862.
Frazer-Abel, A., L. Sepiashvili, M. M. Mbughuni and M. A. Willrich (2016). "Overview of Laboratory Testing and Clinical Presentations of Complement Deficiencies and Dysregulation." Adv Clin Chem 77: 1-75.
Gatault, P., G. Brachet, D. Ternant, D. Degenne, G. Recipon, C. Barbet, E. Gyan, V.
Gouilleux-Gruart, C. Bordes, A. Farrell, J. M. Halimi and H. Watier (2015).
"Therapeutic drug monitoring of eculizumab: Rationale for an individualized dosing schedule." MAbs 7 (6): 1205-1211.
Hajishengallis, G., E. S. Reis, D. C. Mastellos, D. Ricklin and J. D. Lambris (2017).
"Novel mechanisms and functions of complement." Nature Immunology 18: 1288.
Holers, V. M. (2014). "Complement and its receptors: new insights into human disease."
Annu Rev Immunol 32: 433-459.
Jackson, R. W., S. F. Basinger and J. M. Werth (1970). "Use of a logistic function in expressing kinetic hemolysis data." Infect Immun 1 (2): 142-145.
Jozsi, M., A. Tortajada, B. Uzonyi, E. Goicoechea de Jorge and S. Rodriguez de Cordoba (2015). "Factor H-related proteins determine complement-activating surfaces." Trends Immunol 36 (6): 374-384.
Kabat, I. A. and M. M. Mayer (1961). Experimental Immunochemistry. Springfield, Illinois Charles C. Thoms.
Leffler, J., A. A. Bengtsson and A. M. Blom (2014). "The complement system in systemic lupus erythematosus: an update." Ann Rheum Dis 73 (9): 1601-1606.
Medjeral-Thomas, N. and M. C. Pickering (2016). "The complement factor H-related proteins." Immunol Rev 274 (1): 191-201.
Mollnes, T. E., P. Garred and G. Bergseth (1988). "Effect of time, temperature and anticoagulants on in vitro complement activation: consequences for collection and preservation of samples to be examined for complement activation." Clin Exp Immunol 73 (3): 484-488.
Mollnes, T. E., T. S. Jokiranta, L. Truedsson, B. Nilsson, S. Rodriguez de Cordoba and M. Kirschfink (2007). "Complement analysis in the 21st century." Mol Immunol 44 (16): 3838-3849.
Morgan, A. R., C. O'Hagan, S. Touchard, S. Lovestone and B. P. Morgan (2017).
"Effects of freezer storage time on levels of complement biomarkers." BMC Res Notes 10 (1): 559.
Morley, B. J. and M. J. Walport (2000). The Complement Fact Book. London, UK, Academic Press.
Parente, R., S. J. Clark, A. Inforzato and A. J. Day (2017). "Complement factor H in host defense and immune evasion." Cell Mol Life Sci 74 (9): 1605-1624.
Prohaszka, Z., B. Nilsson, A. Frazer-Abel and M. Kirschfink (2016). "Complement analysis 2016: Clinical indications, laboratory diagnostics and quality control."
Immunobiology 221 (11): 1247-1258.
Reis, E. S., T. Lange, G. Kohl, A. Herrmann, A. V. Tschulakow, J. Naujoks, J. Born and J. Kohl (2011). "Sleep and circadian rhythm regulate circulating complement factors and immunoregulatory properties of C5a." Brain Behav Immun 25 (7): 1416-1426.
Ricklin, D., G. Hajishengallis, K. Yang and J. D. Lambris (2010). "Complement: a key system for immune surveillance and homeostasis." Nat Immunol 11 (9): 785-797.
Ricklin, D., D. C. Mastellos, E. S. Reis and J. D. Lambris (2017). "The renaissance of complement therapeutics." Nature Reviews Nephrology 14: 26.
Skattum, L., M. van Deuren, T. van der Poll and L. Truedsson (2011). "Complement deficiency states and associated infections." Mol Immunol 48 (14): 1643-1655.
Spronk, P. E., P. C. Limburg and C. G. Kallenberg (1995). "Serological markers of disease activity in systemic lupus erythematosus." Lupus 4 (2): 86-94.
Thurman, J. M. and V. M. Holers (2006). "The central role of the alternative complement pathway in human disease." J Immunol 176 (3): 1305-1310.
Walport, M. J. (2001). "Complement. First of two parts." N Engl J Med 344 (14): 1058- 1066.
Yang, S., M. McGookey, Y. Wang, S. R. Cataland and H. M. Wu (2015). "Effect of blood sampling, processing, and storage on the measurement of complement activation biomarkers." Am J Clin Pathol 143 (4): 558-565.
Zipfel, P. F. and C. Skerka (2009). "Complement regulators and inhibitory proteins." Nat Rev Immunol 9 (10): 729-740.
Table 1. Complement – associated disorders
Inflammatory disease Vasculitis, Nephritis, Glomerulonephritis (GN), Systemic inflammatory reaction syndrome (SIRS), sepsis, ischemia/reperfusion injury (I/R injury), Crohn’s disease, haemolytic uremic syndrome (HUS), atypical haemolytic uremic syndrome (aHUS), Rheumatoid arthritis (RA), Hereditary angioedema (HAE)
Autoimmune disease SLE, Multiple sclerosis, Acute myasthemia gravis (AMI), Psoriasis, Paroxysmal nocturnal hemoglobinuria (PNH)
Neuro-degeneration disease Alzheimer’s disease, age-related macular degeneration (AMD)
Others Transplant rejection, Stroke, Myocardia
Infarction, trauma, burn, capillary leak syndrome, biomaterials incompatibility (dialysis,
cardiopulmonary bypass, plasmapheresis, etc.)
Figure 1A: The Functional Complement Assays. The components involved in each of the complement functional assays is depicted. The classical pathway function is shown with orange arrow, the lectin pathway functional assay in green and the
alternative pathway in blue. For each of these tests the presence and functionality of each component for that activation pathway and the terminal pathway is required.
Figure 1B: The Complement Activation Markers. The activation or inhibition of the complement system can be monitored by measuring the levels of activation fragments or assessing the convertase. These individual markers also have the benefit of being able to distinguish activation or inhibition of the individual pathway. Circles indicated activation markers. Colors correspond to the pathway involved. Two colors indicated two pathways can produce that fragment.
Figure 1A
Figure 1B
C1q
C4
C2 C4bC2a
MBL Lectin
C3
C3H2O
C3b
C4bC2a3b
C5 C5b C5b‐9
C3bBb
Factor B Bb
C3bBbC3b
C3b Factor D
Properdin C1r,C1s
MASPs
C3a C5a
C3a C4a
C2b
Ba C3b
C1‐INH
MAP1
Factor H Factor I Factor H
Factor I
S‐Protein/
Vitronectin sC5b‐9
Terminal Pathway
Lectin PathwayClassical PathwayAlternative Pathway
C6
C8 C7
C9 C4b
CH50/CP/CH100
LP
AH50/AP/AP50
C1q
C4 C2
C4bC2a
MBL Lectin
C3
C3H2O
C3b
C4bC2a3b
C5 C5b C5b‐9
C3bBbP
Factor B Bb
C3bBbC3b
C3b Factor D
Properdin C1r,C1s
MASPs
C3a C5a
C3a C4a
C2b
Ba C3b
C1‐INH
MAP1
Factor H Factor I Factor H
Factor I
sC5b‐9
Terminal Pathway
Lectin PathwayClassical PathwayAlternative Pathway
C6
C8 C7
C9 C4b
C4d
C3d