807
Trypsin
Wirnt Rick
Trypsin
1
) is a proteolytic enzyme, whose precursor trypsinogen (molecular weight of both proteins is about 24000
2
)) is formed in the exocrine cells of the pancreas and is secreted into the lumen of the duodenum. Trypsinogen is converted to trypsin by the enzyme enterokinase and also autocatalytically by the action of the trypsin formed. Enterokinase, which is secreted by the cells of the mucus membrane of the small intestine, acts by splitting a hexapeptide, H2N-Val-Asp4-Lys-COOH, from the trypsinogen
3
). The p H optimum for the reaction is between 7.0 and 9.00 for bovine tryp
sinogen. Trypsin is most stable at p H ca. 2.3
4
). A n inert protein is also formed during the activation process
5
). This inactive protein sediments slower than native trypsin in the ultracentrifuge and has therefore been considered to be a polymer of the monomeric enzyme
6
). The formation of the inert protein can be inhibited by C a
2+
i o n s
7 - 9
) , which prevent the aggregation of the trypsin molecule
6
). Magnesium ions are inactive. Owing to the increased stability of trypsin in the presence of calcium ions, a higher activity of the enzyme is found in most assay systems when C a
2+
is added. However the hydrolysis of protamines and the activation of a-chymotrypsinogen are independent of C a
2 + 1
o ) .
The enzyme hydrolyses bonds involving the carboxyl group of lysine or a r g i n i n e
1 1
.
1 2
) . Peptides, amides and esters of these amino acids are hydrolysed and the rate increases in the following order:
peptides < amides < esters. Proteins which are not denatured are attacked only slowly.
The following are suitable as substrates for the assay of trypsin activity: denatured proteins (haemo
globin
1 3
) , casein
1 4
> and the esters and amides of lysine or arginine {e.g. V-faJ-benzoylargininamide
1 5
), N-fa>benzoylarginine ethyl e s t e r
1 6
.
1 7
) , 7vVa>benzoylarginine-p-naphthylamide
1 8
)).
O J. H. Northrop, M. Kunitz and R. M. Herriott: Crystalline Enzymes. 2 n d ed., Columbia Univ.
Press, N e w York 1948; E. L. Smith in / . B. Summer and K. Myrback: The Enzymes. Academic Press, N e w York 1951, Vol. I, p. 846; M.Laskowski'm S.P. Colowick and N. O. Kaplan: Methods in Enzymology. Academic Press, N e w York 1955, Vol. II, p. 26.
F. Tietze, J. biol. Chemistry 204, 1 [1953].
H. Neurath and G. H. Dixon, Fed. Proc. 16, 791 [1957]; F. Turba and W. Zillig in: Ergebnisse der medizinischen Grundlagenforschung. Thieme, Stuttgart 1960, Vol. Ill, p. 253.
M. Kunitz and J. H. Northrop, J. gen. Physiol. 77, 591 [1934].
M. Kunitz, J. gen. Physiol. 22, 293 [1939].
M. Bier, L. Terminiello and F. F. Nord, Arch. Biochem. Biophysics 41, 238 [1952].
M. R. McDonald and M. Kunitz, J. gen. Physiol. 25, 53 [1941].
M. R. McDonald and M. Kunitz, J. gen. Physiol. 29, 155 [1946].
M. Bier and F. F. Nord, Arch. Biochem. Biophysics 33, 320 [1951]; L. Gorini, Biochim. biophysica Acta 7, 318 [1951].
TV. M. Green and H. Neurath, J. biol. Chemistry 204, 379 [1953].
H. Neurath and G. W. Schwert, Chem. Rev. 46, 69 [1950].
M. Dixon and E. C. Webb: Enzymes. Longmans, Green & Co., London 1958, p. 252.
M. L. Anson, J. gen. Physiol. 22, 79 [1939]; M. L. Anson and A. E. Mirsky, J. gen. Physiol. 17, 151 [1933].
M. Kunitz, J. gen. Physiol. 30, 291 [1947].
M. Bergmann, J. S. Fruton and H. Pollok, J. biol. Chemistry 727, 643 [1939]; G. W. Schwert, H. Neurath, S. Kaufman and / . E. Snoke, J. biol. Chemistry 772, 221 [1948].
G. W. Schwert and M. A. Eisenberg, J. biol. Chemistry 779, 665 [1949].
G. W. Schwert and Y. Takenaka, Biochim. biophysica Acta 16, 570 [1955].
A. Riedel and E. Wunsch, Hoppe-Seylers Z. physiol. Chem. 316, 61 [1959]: H. Schon, B. Rassler and N. Henning, Klin. Wschr. 39, 217 [1961].
808 Section C : Measurement of Enzyme Activity
A. Determination with Haemoglobin as Substrate
Principle
Haemoglobin is denatured with alkaline urea solution. Trypsin hydrolyses substances from the dena
tured protein, which are soluble in trichloroacetic acid and whose tyrosine and tryptophan content can be determined according to the method of Folin and Ciocalteu
1 9
>. The method of Anson 13) for the measurement of trypsin activity in pure solution is described below.
Optimum Conditions for Measurements
The pH optimum for the proteolytic action of trypsin is between 7.0 and 8.0. The optimum substrate concentration is around 6.7 mg. haemoglobin/ml. reaction mixture. The addition of 0.02 M C a
2+
prevents the formation of enzymatically inert protein (see a b o v e )
7 )
.
Reagents
1. Bovine haemoglobin *)
2. Sodium hydroxide, A. R., 1 N and 0.5 N 3. Urea, pure, crystalline
4. Boric acid, crystalline, A. R.
5. Sodium chloride, A. R.
6. Calcium chloride solution, 5% (w/v)
7. Hydrochloric acid, A. R., 10-3 N, 0.2 N and ca. 1 N 8. Trichloroacetic acid, 5% (w/v)
9. Folin and Ciocalteu phenol reagent **>
available ready-made, e.g. from E. Merck, Darmstadt, Germany.
10. L-(—)-Tyrosine, chromatographically pure.
Preparation of Solutions I. Boric acid (1 M):
Dissolve 6.184 g. boric acid and 0.292 g. NaCl in doubly distilled water and make up to 100 ml.
11. Substrate solution:
Suspend 2.0 g. haemoglobin with about 50 ml. doubly distilled water in a 100 ml.
volumetric flask, add 36 g. urea and 8 ml. 1 N NaOH, and dilute with doubly distilled water to about 80 ml. To denature the haemoglobin allow to stand for 30—60 min. at room temperature, then add 10 ml. boric acid solution (I) and after thorough shaking add 4.4 ml. 5% CaCl 2 solution. Adjust to pH 7.5 with 1 N HC1 (glass electrode) and dilute to 100 ml. with doubly distilled water. Centrifuge off any erythrocyte stroma (15 min., 4000 g).
III. Phenol reagent:
a) The commercially available stock solution contains:
10 g. N a 2 W 0 4 - 2 H 2 0 , 2.5 g. N a 2 M o 0 4 - 2 H 2 0 , 15 g. L i 2 S 0 4 and 5 ml. 85% H3PO4 in 100 ml.
ca.1 N HC1.
b) Dilute solution: dilute the stock solution three-fold with doubly distilled water.
*) e.g. from Behringwerke, Marburg, Germany; Armour, Kankakee, U S A ; Serva, Heidelberg, Germany.
**)J. biol. Chemistry 73, 627 [1929]; see also P. G. Hawk, B.L.Oser and W. H'. Summerson:
Practical Physiological Chemistry. The Blakiston Comp., Philadelphia 1947, p. 879.
19) O. Folin and V. Ciocalteu, J. biol. Chemistry 73, 627 [1927].
1I.4.D Trypsin 809
IV. Tyrosine standard solution (10~
3
M tyrosine):
Dissolve 181.19 mg. L -(-)-tyrosine in 0.2 N H Q and make up to 1000 ml.
Stability of the s o l u t i o n s
Store the substrate and tyrosine standard solution in a refrigerator at 0 — 4 ° C . T o prevent the growth of micro-organisms add 2.5 mg. merthiolate *) (Lilly) per 100 ml. substrate solution, and before diluting the tyrosine solution to 1000 ml. add 14.3 ml. 3 5 % formaldehyde (A. R.).
Procedure
Tyrosine standard curve
Pipette into 50 ml. Erlenmeyer flasks:
0.2 —1.0 ml. tyrosine standard solution (IV) 4.8 m l . - 4 . 0 ml. 0.2 N HC1
10 ml. 0.5 N NaOH.
Add with continuous shaking
3.0 ml. dilute phenol reagent (solution IIIb).
Measure the optical densities (as described under "Colour reaction") against a blank con
taining 0.2 N HC1 instead of the tyrosine standard solution and plot against the u.moles tyrosine/flask.
Enzymatic reaction
For each determination prepare a blank in which the haemoglobin is first precipitated with trichloroacetic acid and then the trypsin solution (sample) is added.
Pipette into a 20 ml. centrifuge tube:
5.0 ml. substrate solution (II).
Equilibrate at 25°C in a constant temperature water bath, add 1.0 ml. enzyme solution (2—20 u,g. protein in 10~
3
N HC1), mix and incubate for exactly 10 min. at 25°C. Add
10.0 ml. 5% trichloroacetic acid,
shake and allow to stand for 30 min. at room temperature. Filter or centrifuge off the pre
cipitate (20 min. at 4000 g).
Colour reaction
Pipette into 50 ml. Erlenmeyer flasks:
5.0 ml. filtrate or supernatant 10 ml. 0.5 N NaOH
and with continous shaking add
3.0 ml. dilute phenol reagent (solution IIIb).
Centrifuge off any slight precipitate (5 min. at 4000 g). Between 5 and 10 min. after the addi
tion of the phenol reagent, measure the optical density of the solution against distilled water in 1 cm. cuvettes at 578 mu,, 691 mu, (Photometer Eppendorf) or 750 mu, (Zeiss photometer).
*) Sodium salt of c-(ethylmercurythio)benzoic acid.
810 Section C : Measurement of Enzyme Activity Calculations
The trypsin unit ( T U
H b
) proposed by Anson
13
) is similar to the pepsin unit: 1 trypsin unit ( T U
H b
) is defined as the amount of enzyme, which under the standard conditions of Anson (6 ml. final volume containing 0.1 g. haemoglobin, temperature: 35.5°C), hydrolyses haemoglobin at such an initial rate that the amount of hydrolysis products formed per minute has the same optical density o n reaction with the phenol reagent as 1 m m o l e tyrosine.
The specific activity is defined as the number of trypsin units ( T U
H b
) per mg. protein nitrogen.
A t 25° C the trypsin activity is 1.78 times lower than at 35.5° C, so that the results obtained at 25° C must be multiplied by this factor. A s in the case of pepsin, there is no linear proportionality between the trypsin activity and the amount o f hydrolysis products formed. The trypsin activity must there
fore be extrapolated to the origin or a standard curve must be used. The extrapolation m e t h o d is employed for the assay of the activity of purified enzyme preparations: different and sufficiently small amounts of trypsin are incubated with the substrate as described above. After determination of the hydrolysis products (corrected for the blank) the u.moles tyrosine (obtained from the tyrosine stan
dard curve) are plotted against the amounts of trypsin and a tangent is drawn to the curve through the origin. The amount of enzyme which liberates 1 u.mole tyrosine is read off from the tangent.
This amount of enzyme is multiplied by 1000 X (5/16) X 10 X (1/1.78) to obtain the amount of enzyme corresponding to a trypsin unit. T h e multiplication factors are derived as follows:
1 000 = conversion o f u.moles to mmoles
5/16 = conversion from the colour reaction to the enzymatic reaction 10 = conversion from 10 min. to 1 min.
1/1.78 = conversion from 25°C to 35.5° C.
For routine work Anson
13
) modified the evaluation and gave an empirical standard curve (Fig. 1).
12 -•10'^
10 Fig. 1. Dependence of the hydrolysis of
haemoglobin by trypsin on the amount of
8 enzyme (according to Anson
13
)) Ordinate: Tyrosine equivalent [mmoles] of
6 the hydrolysis products in 5 ml. filtrate (see
Text under "Enzymatic reaction"). Enzy
k matic reaction: 10 min. at 25°C.
Abscissa: Trypsin units ( T U
H b
) according
2 to Anson
13
).
J I i 1 1 1 I I _
1 2 3 4 5 6 7 8-W
The optical density read on the colorimeter is converted to mmoles tyrosine by means of the tyrosine standard curve and the trypsin units corresponding to this amount are read off from the abscissa of Fig. 1. T o obtain the units per ml. sample it is necessary to divide by the volume of sample taken for the assay.
Example
The standard curve prepared with L-(—)-tyrosine is linear up to 1.0 u.mole/flask. The optical densities found with 1 u.mole of tyrosine in the colour reaction were
at 578 mu. (Photometer Eppendorf) 0.490 at 691 mu. (Photometer Eppendorf) 0.620 at 750 mu. (Zeiss spectrophotometer) 0.665 1.75 mg. trypsin (Boehringer) in 100 ml. 1 0 ~
3
N HC1 was used. For results see Table 1.
II.4.b Trypsin 811 Table 1
Trypsin [u.g.
per assay]
Optical density at 578 mu.
Tyrosine [[xmoles in 5 ml. nitrate] *)
10-3 TUHb read off from Fig. 1
10-3 TUHb per mg. trypsin
3.5 0.060 0.122 0.065 18.6
3.5 0.065 0.133 0.070 20.0
7.0 0.124 0.251 0.135 19.3
7.0 0.133 0.272 0.145 20.7
10.5 0.198 0.404 0.220 21.0
10.5 0.198 0.404 0.220 21.0
14.0 0.263 0.537 0.310 22.1
14.0 0.258 0.527 0.300 21.4
17.5 0.327 0.668 0.400 22.8
17.5 0.315 0.644 0.375 21.8
Mean 20.8
*) After deproteinization of the enzymatic reaction mixture with trichloroacetic acid.
One mg. trypsin is equivalent to 0.0208 T U
H b
. A s trypsin contains 15.0% nitrogen
1
), the specific activity is 0.0208 X = 0.139 T U
H b
/ m g . protein nitrogen.
Details for Measurements in Duodenal Juice
If mixtures of proteases, for example, trypsin and chymotrypsin, are assayed, the various proteolytic enzymes present will all contribute to the trichloroacetic acid-soluble peptides liberated. Only the total proteolytic activity of the duodenal juice can therefore be determined. The result can be expressed in T U
H b
, but it should be noted that no information can be obtained about the amounts of the different proteases.
Example
Duodenal juice (0.02 ml.) which had been centrifuged was analysed. The optical density minus the blank was 0.153, corresponding to 0.31 (jimoles tyrosine. Read off from Fig. 1: 0.17 X 1 0
-3
T U
Hb
in 0.02 ml., corresponding to 9.5 X 10~3 T U
H b
/ m l . duodenal juice. Consequently, the proteases contained in 1 ml. of the duodenal juice had an enzymatic activity corresponding to 8.5 X 10~
3
T U
H b
.
B. Determination with Casein as Substrate
Principle
During the hydrolysis of casein by trypsin
1 4
> products soluble in trichloroacetic acid are formed, and the tyrosine and tryptophan content o f these is determined by measurement of the optical den
sity at 280 mu,.
Optimum Conditions for Measurements
The p H optimum of the reaction lies between 7.0 and 8.0. A s described above, calcium ions stabilize trypsin by preventing the formation of an enzymatically inactive protein from it during the incubation.
812 Section C: Measurement of Enzyme Activity
However, if calcium chloride is added to a 1 % casein solution in 0.2 M borate buffer (pH 7.6) 0 to give a final concentration of 0.005 M, a slight opalescence occurs due to the formation of the insoluble calcium salt of casein
2 0
>. In this case, the enzymatic hydrolysis is reduced by about 1 0 % as compared to reaction mixtures without calcium i o n s
2 1 )
and therefore calcium is omitted from this assay.
Reagents
1. Casein according to Hammersten *)
2. Potassium dihydrogen phosphate, KH2PO4, A. R.
3. Disodium hydrogen phosphate, Na2HPC>4-2 H2O, A. R.
4. Trichloroacetic acid, 5 % 5. Hydrochloric acid, A. R., 1 0 ^ N
Preparation of Solutions
I. Phosphate buffer (0.1 M; pH 7.6):
Dissolve 0.157 g. K H 2 P 0 4 and 1.575 g. N a 2 H P 0 4 • 2 H 2 0 in about 90 ml. doubly distilled water, adjust to pH 7.6 (glass electrode) and dilute to 100 ml. with doubly distilled water.
II. Substrate solution:
Suspend 1 g. casein in 100 ml. phosphate buffer (solution I), heat for about 15 min.
in a boiling water bath until all the casein is dissolved and then dilute to 100 ml. with doubly distilled water.
Stability of the solutions
Store the buffer and substrate solution, stoppered, in a refrigerator at 0 — 4 ° C . The casein solution keeps at this temperature for at least a week.
Procedure
Spectrophotometric m e a s u r e m e n t s
Wavelength: 280 mu.; silica cuvettes, light path: 1 cm.; temperature: 35°C. Measure against water. Equilibrate the substrate solution for at least 5 min. at 35°C.
Pipette successively into 12 ml. centrifuge tubes (in a 35°C water bath):
Blank
1 ml. substrate solution (II) 3 ml. 5% trichloroacetic acid.
Shake, add
1 ml. enzyme solution (sample diluted to 1 ml. with phosphate buffer, solution I) and allow to stand for 30 min. at room temperature.
*> e.g. from E. Merck, Darmstadt, Germany.
2 0 )
G. Schmidt in Hoppe-Seyler-Thierfelder: Handbuch der physiologisch- und pathologisch-chemi- schen Analyse. 10th ed., Springer, Berlin 1960, Vol. IV, p. 627.
2 1 )
W. Rick, unpublished.
11.4. b Trypsin 813
Experimental
0.01 —1.0 ml. enzyme solution (sample, 1 —25 y.g. trypsin in 10~
3 N HC1) phosphate buffer (solution I) to 1.0 ml.
1.0 ml. pre-warmed substrate solution (II).
Mix and simultaneously start a stopwatch. After
exactly20 min. add 3.0 ml. 5% trichloroacetic acid
and mix thoroughly. Allow to stand for at least 30 min. at room temperature. If several determinations are to be carried out, pipette the substrate into the test tubes in the 35° C water bath at timed intervals, for example, every 30 sec. Exactly 20 min. after the start of the incubation of the first tube add 3 ml. trichloroacetic acid to each tube in the same order and at the same time interval.
Filter the contents of the blank and experimental tubes or centrifuge for 20 min. at 3000 g.
Read the optical densities of the filtrates or supernatants. The optical density of the experi
mental tube after subtraction of the blank is used to calculate the enzyme activity.
Calculations
A s the optical density of the casein hydrolysis products is not proportional to the amount of enzyme added (compare determination with haemoglobin), the initial rate of the reaction must be measured.
For this, several tubes containing different amounts of sample (1—25 u.g. trypsin) are incubated.
0
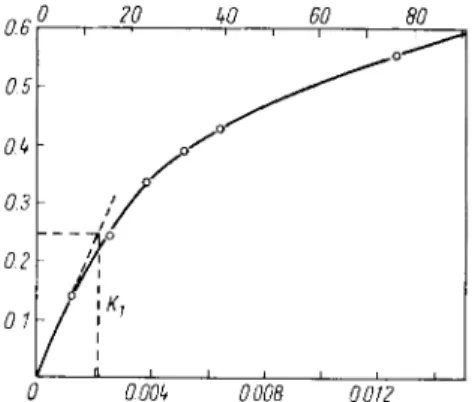
0 20 kO 60 806
0.5 0M 0.3 0.2 0.1
0 0.00k 0.008 0.012
Fig. 2. Standard curve for the hydrolysis of casein by trypsin (according to Kunitz
1
*)). Volume of the incubation mixture: 2 ml.; casein concentration: 0.5%; 20 min. incubation at 3 5 ° C ; volume after the
addition of trichloroacetic acid: 5 ml.; final concentration of trichloroacetic acid: 3 % . Ordinate: Optical density of the hydrolysis products liberated from casein in 20 min. by the action
of trypsin (1 cm. light path; 5 ml. final volume).
Lower abscissa: mg. trypsin in 1 ml. incubation mixture.
Upper abscissa: 10~
3
T U
C a s
in 1 ml. incubation mixture.
Plot the optical densities against the [ig. enzyme/ml. incubation mixture (for a 2 ml. incubation mix
ture divide the amount o f trypsin per tube by 2) (Fig. 2). D r a w a tangent to the initial part of the curve; the slope of this is a measure of the specific activity of the preparation.
According to Kunitz
14
> a unit ( T U
C a s
) is the amount of trypsin which under the defined conditions (20 min. incubation at 35°C, final volume of the incubation mixture: 2.0 ml., after addition of
814 Section C : Measurement of Enzyme Activity
trichloroacetic acid: 5 ml.) liberates sufficient trichloroacetic acid-soluble hydrolysis products, so that the optical density at 280 mu, increases by 1.00 in 1 min. Specific activity: T U
C a s
/ m g . protein.
According to Fig. 2
0.25 T U
C a s
/ [ J L g . trypsin = 2 \ x 20
=
^
X
^ ~
3
' *'
6
' *
m g
'
c r y
s t a l l i n e trypsin contains 6 T U
C a s
, where
0.25 = AE
2
8o/20 min.2.1 = u.g. trypsin/ml.
20 = conversion o f A E / 2 0 min. to AE/min.
The upper abscissa of Fig. 2 gives the T U
C a s
corresponding to the ordinate (AE280/2O min.). This scale is independent of the purity of the enzyme preparation. The activity of unknown samples can be read directly from the curve (Fig. 2) in T U
C a s
. The optical factor
1 4
>, i.e. the reciprocal of the optical density of a solution of 1 mg. protein/ml. at 280 m\i and 1 cm. light path serves to determine the protein concentration o f the enzyme solution.
For crystalline trypsin the optical factor is 0.585
1 4
>.
Example
"Boehringer" trypsin (9.84 mg.) was dissolved in 10 ml. 1 0 ~
3
N HC1 and diluted with phosphate buffer to 100 ml. Optical density at 280 mu.: 0.166; protein content: 0.166 X 0.585 = 0.097 mg./ml.
The sample solution was diluted 1:10 with phosphate buffer (solution I) and 0.1 to 1.0 ml. was analysed. The optical density for 0.1 ml., corresponding to 0.485 \ig. protein/ml. assay mixture, was 0.056. T h e curve in Fig. 2 is still a straight line at this optical density. Therefore the calcu
lations can be made directly with the formula given on p. 802 and hence:
0.056 x 10³ 0.485 x 20 1 0
3
= conversion of \ig. to mg. protein.
5.8 T U
C a s
/ m g . protein.
Details for Measurements in Duodenal Juice
A s casein is also hydrolysed by chymotrypsin the determination is not specific for trypsin. Therefore only the total proteolytic activity of the duodenal juice can be measured with casein as substrate.
Example
ml. duodenal juice: 0.005 ml. 0 . 0 1 m l . Optical density
Experimental 0.503 0.930 Blank 0.045 0.057 Difference 0.458 0.873
Catenations") ^ W = « » T U ^ / m l . = 4 .37 T U ^ / m l .
A s both amounts give practically the same activity per ml., the use o f smaller volumes of sample is unnecessary. The standard curve (Fig. 2) is approximately linear over this range, therefore the for
mula on p. 802 is used for the calculations.
22) W. Rick in A. Gigon and H. Ludwig: Enzymatische Regulationen in der Klinik. Schwabe, Basle and Stuttgart 1961, p. 251.
II.4.D Trypsin 815
C. Determination with Benzoylarginine Ethyl Ester as Substrate
Principle
TV-faJ-Acylarginine esters have been used as substrates for trypsin
1 6
»
1 7
) . T h e reaction was followed by direct electrometric titration of the carboxyl groups liberated
1 6
). Schwert and Takenaka found that the absorption o f A-faJ-benzoyl-L-arginine ethyl ester is much weaker at 253 mu. than that o f N-(a)- benzoyl-L-arginine, hence the hydrolysis of the ester can be followed spectrophotometrically
1 7
>.
In the absence of thrombin, plasmin and kallikrein the m e t h o d is specific for t r y p s i n
1 1
.
1 2
) .
Optimum Conditions for Measurements
The p H o p t i m u m of the hydrolysis is at 8.0
1 7
>. T h e rate is maximal with > 1.5 X 10~
4
M substrate
2 3
).
TV-fa,)-benzoyl-L-arginine does not i n h i b i t
1 6
) . With substrate concentrations above 3 x l O ~
4
M the reaction is linear until about 9 0 % of the substrate has been c o n s u m e d
2 3
) . Calcium chloride is added to a final concentration of 0.02 M because of its stabilizing action o n trypsin.
Reagents *)
1. Tris-hydroxymethyl-aminomethane, tris 2. N-(a) -Benzoyl-L-arginine * *)
3.'N-faJ-Benzoyl-L-arginine ethyl ester hydrochloride**)
chromatographically pure
4. Calcium chloride solution, 5 % (w/v) 5. Hydrochloric acid, A. R., 10"
3 N ; 2 N Preparation of Solutions
I. Tris buffer (0.05 M; pH 8.0):
Dissolve 6.057 g. tris in about 900 ml. doubly distilled water, adjust to pH 8.0 ( ± 0.05) (glass electrode) with ca. 15 ml. 2 N HC1 and dilute to 1000 ml. with doubly distilled water.
II. Substrate solution (0.001 M):
Dissolve 34.29 mg. A^faJ-benzoyl-L-arginine ethyl ester hydrochloride in about 90 ml.
buffer (solution I), add 4.44 ml. 5 % C a C i 2 solution and dilute with buffer (solution I) to 100 ml.
III. A^-faJ-Benzoyl-L-arginine (0.001 M):
Dissolve 27.83 mg. N-(aJ-benzoyl-L-arginine in buffer (solution I) and make up to 100 ml.
Stability of the s o l u t i o n s
Store all solutions, stoppered, in a refrigerator at 0—4° C. A b o u t 4 % of the ester (solution II) is hydro
lysed s p o n t a n e o u s l y
2 3
) in 24 hours. This is not important as long as the substrate concentration in the assay mixture is above 1.5 X 1 0 ~
4
M. Consequently, the solution is stable for at least 14 days at 4°C.
The absorption of solution III does not change in 14 days.
Procedure
Spectrophotometric m e a s u r e m e n t s
Preliminary remarks:
The difference spectrum of A^faJ-benzoyl-L-arginine ethyl ester and A
r
-faJ-benzoyl-L-arginine shows a sharp maximum at 253—254 mu.
1 7
). In this laboratory
*) Complete reagent kits are available commercially, see p. 1037.
**) e.g. from Mann Research Laboratories, N e w York 6, N . Y., U S A .
23
) W. Rick, unpublished.
816
Section C : Measurement of Enzyme Activitythe maximum was found to be at 254 mu.
2 3
). As the absorption decreases rapidly on either side of the maximum, it is important that measurements are made with a narrow band-width.
If the Zeiss spectrophotometer PMQ 2 is used, it is possible with an amplification of 1/10/10 and a slit-width of 0.25 mm., to set the optical density of the ester solution to 0. The corre
sponding half band-width for 254 mu. is then about 0.9 mu.. Because of the narrow maximum of the difference spectrum small errors in setting the wavelength cause considerable variation in the molar extinction coefficient and consequently errors in the calculations. It is therefore advisable to check the wavelength scale with a mercury lamp. To calibrate the wavelengths the following mercury lines are used: 244.6, 246.4, 248.2, 257.6, 260.3, 264.0 and 265.2 mu..
The assays are especially elegant and accurate, if the measurements of optical density can be made with a continuous recording spectrophotometer.
Method:
Wavelength: 254 mpi; silica cuvettes, light path: 1cm.; final volume: 3.2 ml.;
temperature: 25°C (constant temperature cuvette holder). Measure against the blank.
Pre-warm the substrate solution to 25° C in a water bath.
Pipette successively into the cuvettes:
Blank
3.0 ml. substrate solution (II) 0.2 ml. doubly distilled water.
Place in the spectrophotometer and adjust to zero optical density with the smallest possible half band-width (about 1 mu.).
Experimental
3.00 ml. substrate solution (II) 0.19-0 ml. buffer (solution I)
0.01 —0.20 ml. enzyme solution (sample).
Mix with a plastic paddle, start a stopwatch and read the optical density against the blank every 30 sec. for 2—4 min.
The optical density difference AE/min. should not be greater than 0.400, otherwise dilute the enzyme solution 1 : 2 or 1 : 4 with buffer (solution I).
To check the substrate concentration measure the optical density of solution III against solution II. The optical density difference should be larger than 0.5.
Calculations Schwert and Takenaka
17
) defined the activity of their enzyme preparation in (AE/sec.)/mg./ml.
reaction mixture. Over the range tested there was proportionality between AE/sec. and the amount of enzyme added up to a AE/sec. of 0.005.
A s in contrast to the methods requiring natural substrates a defined reaction is measured with this method, the activity of the enzyme can be expressed in u,moles of substrate converted/min. according to the proposal of King
24
) and Webb
25
). The specific activity is defined as the amount of substrate reacting (u.moles/min.) per mg. protein or per ml. body fluid.
24) E. J. King and D. M. Campbell, Proc. 4 th. Internat. Congr. on Clinical Chemistry, Edinburgh 1960.
E. & S. Livingstone, Edinburgh and London 1961, p. 185; E. J. King and D. M. Campbell, Clin.
chim. Acta 6, 301 [1961].
25) E. C. Webb, Proc. 4 t h . Internat. Congr. on Clinical Chemistry, Edinburgh 1960. E . & S . L i v i n g stone, Edinburgh and London 1961, p. 55.
II.4.D Trypsin 817
According t o
2 3
.
2 6
) the optical density difference between 10~
3
M solutions of A-(a>benzoyl-L-arginine and the ethyl ester is 1.15 at 25° C, p H 8.0 and with a 1 cm. light path. With a volume of 1 ml. an optical density change o f + 1 . 1 5 / m i n . corresponds to the conversion o f 1 u.mole of substrate/min.
With a 3.2 ml. assay volume the reaction of 1 (Jimole of substrate/min. is equivalent to an increase in optical density o f 0.359/min. T h e activity is therefore calculated according to the following formula:
AE254/min. , , , , » , , .
— 0 ^ 5 ^
=
[xmoles substrate hydrolysed/min.
If the activity is divided by the mg. protein or the ml. duodenal juice per reaction mixture, the specific activity is obtained.
Example
Trypsin (3.78 mg.) [recrystallized twice, salt-free (Serva)] was dissolved in 10 ml. 10~
3
N HC1. The optical density o f the solution at 280 mu. and with a 1 c m . light path was 0.640; the protein concen
tration was 0.640 X 0.585 = 0.374 mg./ml.
ml. sample
mg. trypsin/reaction mixture Optical density at 254 mu. after
AE
2
54/min.0.05 ml. 0.10 ml.
0.0187 0.0374
0 sec. 0.062 0.120
10 sec. 0.120 0.220
20 sec. 0.164 0.330
30 sec. 0.214 0.420
40 sec. 0.256 0.510
50 sec. 0.306 0.600
60 sec. 0.351 0.690
0.289 0.570
0 289 Specific activity q 359 *
x
q Qig7~= 3 A 4
^moles/min./mg.
0-570 „42.5 urnoles/min./mg.
t
, , . ,0.359 x 0.0374
Example of the m e a s u r e m e n t of trypsin activity in d u o d e n a l juice Refer t o
2 7
) . 0.05 ml. duodenal juice was analysed.
Time Optical density AE/0.5 1 [min.] [254 mu.]
0 0.260
0.051
0.5 0.311
0.049
1 0.360
0.044
1.5 0.404
0.046
2 0.450
0.062
2.5 0.512
0.046
3 0.558
0.048
3.5 0.606
0.046
4 0.652
Mean 0.049/0.5 min.
26) /. Trautschold and E. Werle, Hoppe-Seylers Z. physiol. Chem. 325, 48 [1961].
27) G.Lundh, Scand. J. clin. Lab. Invest. 9, 229 [1957].
818 Section C: Measurement of Enzyme Activity
The optical density increase per min. is 0.098 Calculations: q 359^ 0 05
=
^ ^
m o
^
e s
/
m m
' /
m
^ ' duodenal juice
Stability of the Enzyme in Duodenal Juice
Duodenal juice should be collected in tubes which are cooled in ice water. There is n o decrease in trypsin activity in 7 hours if the samples are stored at 0—4° C
2 7
> . If it is necessary to keep the material for longer periods, it should be stored frozen at —15 to — 20° C.
Sources of Error
T o check the specificity of the reaction with N-faJ-benzoyl-L-arginine ethyl ester 12,27) I90u.g. chymo
trypsin per reaction mixture was used. The optical density change per minute was 0.0039 and there
fore the activity of the preparation was c i' ^ T T T o n
=
0.057 u,moles/min./mg. protein.
0.359 X 0.190
The ratio of the specific activities of trypsin and chymotrypsin is 43 : 0.057 or 754 : 1. It is possible that the slight activity of the chymotrypsin preparation was due to contamination.