R A P P O R T E U R ' S R E P O R T
Of the six papers allotted to this session, two are descriptions of apparatus for producing and using microbeams of subcellular dimen- sions. The other four deal with effects of u.v. microbeam irradiation of various cell parts upon various aspects of cell replication, the featured organelles being the nucleolus and the spindle. I shall devote prac- tically all of my effort to description of the observations trusting that their theoretical significance can be developed during the discussion.
M I C R O B E A M A P P A R A T U S
Of the various experimental arrangements that have been used to achieve micro-irradiation of cells, the overwhelming majority employ microbeams (see reviews by Zi r k l e , 1957; Sm i t h , 1964). Such a microbeam must, of course, have a cross-section with at least one dimension small compared to the dimensions of the cell, that is, in most cases, of the order of microns. T o produce such a beam, all investigators to date have started with a macroscopic beam and have produced the microbeam by canalization or focusing or a combination of both. Although, theoretically, either canalization or focusing could be used with any type of radiation, practical considerations of the demands of biological experimentation have led nearly all investigators to use canalization for ionizing radiations (protons, alpha particles, X-rays) and focusing for u.v. and other low-energy photon radiations.
Our two papers on apparatus exemplify these two categories.
Bu r n s and Pa t t e e describe an X-ray microbeam apparatus which, depending on the size of the collimating aperture, produces beams ranging from a few to 30 μ in diameter. T o hold the ranges of the ejected electrons to acceptably low values, the X-rays are generated at 8 to 16 kV. T h e dose rates are of the order of 500 r/sec. The X-ray microbeam enters the cell-containing chamber from below, passing through a Mylar window 6 μ thick. The cell is observed from above, even during irradiation, with an incident-light microscope which is
311 R . Ε . Zi r k l e
Department of Biophysics, Chicago University, 111., U.S.A.
312 M I C R O - I R R A D I A T I O N O F C E L L S
rigidly mounted coaxial with the electron beam of the X-ray outfit.
The microbeam is visualized by placing a fluorescent crystal or fine- grained screen at the focus of this same microscope. The cell part to be irradiated is then aligned with the position of the beam by suitable manipulating apparatus. The target current is monitored continuously during exposure. The viewing system makes possible an exceptional rapidity in handling the cells, and the dose rate permits delivery of effective exposures in a matter of seconds. The whole assembly has been tested in preliminary experiments on a single-celled freshwater alga, Micrasterias radiât a.
The paper by Fo r e r, St e p h e n s and In o u é describes some simpli- fications in u.v.-microbeam technology that are useful in certain investigations. Most u.v.-microbeam outfits, including the pioneering apparatus devised long ago by Ch a h o t i n ( Ts c h a c h o t i n , 1912), include two sources of light; one is restricted by an aperture of suitable size and shape and is used for the u.v. irradiation, while the other is used for viewing and positioning the selected subcellular target with respect to the microbeam. Fo r e r and co-workers have simplified their system by using one source for both functions. The u.v. aperture—a slit or hole in an aluminum diaphragm—is located in the filter holder of a mercury-arc lamp with quartz optics. For observation of the specimen, the aperture and diaphragm are removed, and appropriate filters are inserted. For irradiation the filters are removed, and the aperture is replaced.
For clear observation of some cell parts, phase-contrast optics are essential. This requirement was first encountered by Ur e t z and
Pe r r y (1957), who were using a 50 χ reflecting lens both to focus the u.v. radiation to a microbeam and as the objective lens of their viewing system ; they achieved the phase contrast by use of auxiliary optics and without modifying the construction of the reflecting objective. Fo r e r
et al also use the reflecting lens both to produce the microbeam and as a component of the viewing system. However, in the viewing system they use it as the condenser rather than the objective. T o get phase optics they place a suitable central obstruction in the mirror assembly of this reflecting condenser and use it in the viewing system in con- junction with a refracting phase objective. A substantial advantage of
this viewing system is that the refracting objective can be oil-immersed.
The dispersion of refractive index is always more or less troublesome whenever the focal plane of the u.v. microbeam is determined by observations with visible light. In most outfits nowadays, the use of
r a p p o r t e u r ' s r e p o r t 313
reflecting optics enables one to reduce the inconvenient refracting material essentially to the quartz cover-slip through which the micro- beam penetrates to the cell. However, such a coverslip can bring u.v.
and visible radiation to focal planes several microns apart. The necessary adjustment of optical path is usually made by moving the aperture restricted u.v. source a suitable distance along the optic axis.
Forer and co-workers eliminate the need for such movement; they make the wavelength correction by interposing or removing, as required, an object of suitable optical path between the source and the reflecting lens. This object is a glass-ended cylinder filled with an aqueous solution of hexylene glycol, the concentration being adjusted to give the optical path desired.
U . V . - M I C R O B E A M E F F E C T S O N C E L L R E P L I C A T I O N
Ga u l d e n , Ca r l s o n and Jagger have observed a variety of effects on mitosis and mitotic structures as results of one basic type of experi- ment. Their experimental cells were neuroblasts of grasshopper (Chortophaga viridisfasciata) undergoing mitosis in surviving prepara- tions. These cells regularly have two nucleoli. In their basic experi- ment, one of these nucleoli was irradiated with an u.v. microbeam whose focal spot was 3 μ in diameter. The radiation was mono- chromatic, the wavelength band being usually centered at 280 or 265 nm, less frequently at 235 or 238. Exposures ranged from o-oooi to i-o erg.
Nucleolar irradiation produced some clear-cut effects on the nucleoli themselves. Thus, when a 265 nm exposure of ο·οι erg or more was delivered to a nucleolus during its formation (i.e., in middle telophase), its growth was completely stopped, while the non- irradiated sister nucleolus grew to a final volume considerably greater than normal. If a nucleolus was irradiated in prophase (i.e., just before its disappearance), as little as ο·οοι erg produced, at subsequent telophase, one of the following abnormal nucleolar complements in the daughter nuclei: (a) one large and one small nucleolus; (b) one large nucleolus and many small, randomly located spherical bodies resembling nucleoli; (c) a single, very large nucleolus. The authors ascribe the small nucleolus in (a) to a damaged organizer and the nucleolus-like fragments in (b) to a completely inactivated organizer, as well as the total lack of one nucleolus in (c). Since cells with comple- ment (a) are able to accomplish the next mitosis, whereas those with complement (b) or (c) are unable to, it is concluded that the neuroblast
3 1 4 MICRO-IRRADIATION OF CELLS
φ ω rö Φ π3 Ε
"Ό Φ JZ
± 1 - 0
c 0
Middle telophase 2650Α
0 0 0 0 1 001 Ergs in microspot (3jj dia)
Fi g . ι. Example of variation of mitotic-rate ratio with u.v.-microbeam exposure of nucleoli of grasshopper neuroblasts. Each point represents one cell. Triangles: one nucleolus irradiated. Circles: each of the two nucleoli given the plotted exposure. The diamond indicates exposure necessary to reduce mitotic-rate ratio to 0-67 ( Ga u l d e n ,
Ca r l s o n and Ja g g e r ) .
cell, the abscissae are exposures in ergs, and the ordinates are ratios of mitotic rate as just described.
A ratio of zero means that mitosis was stopped completely. In this example (265 nm irradiation in middle telophase), complete stoppage was produced by exposures of about ο·οι erg and above. For 265 nm irradiation in other mitotic phases (late telophase, interphase, very early prophase, early prophase and middle prophase), the corres- ponding minimal exposures for complete stoppage were from two to five times as great. At each of the six phases named, at least twice as much exposure was required at 280 as at 265 nm.
needs both nucleoli, albeit one may be damaged, to accomplish a mitosis.
The rate of mitosis was altered in various ways by nucleolar ir- radiation at various mitotic stages. These alterations were expressed numerically by dividing the time required for an irradiated cell to reach metaphase into the corresponding time required by the control.
I shall call this number the mitotic-rate ratio. The results are exempli- fied by the data of Fig. 1. Here, each plotted point represents a single
R A P P O R T E U R ' S R E P O R T 315
10,000
in
$1,000- Co 1
x: Q.
m
φ Ε
I 100-
10H
c υ
£ von
0-1
ο 2 6 5 0 £
• 280AAo A2352and2378A
.Middle Late, Inter- yearly Early Middle, Telophase Pn a se Prophase
Mitotic stage
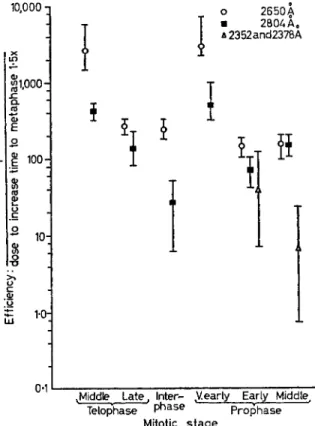
Fig. 2. Variation of mitotic rate ratio with wavelength and mitotic stage irradiated (Ga u l d e n, Ca r l s o n and Ja g g e r ) .
produce a rate ratio of 0-67 was read off, and the reciprocal of this exposure was taken as a measure of relative efficiency. The fourteen values thus determined are plotted in Fig. 2 against the mitotic stages investigated. It will be noted that, for any given wavelength (e.g.
265 nm) the efficiency varied substantially with mitotic stage. Also, at most mitotic stages, 265 nm irradiation was more efficient than 280 nm.
Lower exposures retarded, rather than stopped, the mitotic process.
In Fig. ι, this is manifested by the decrease in mitotic-rate ratio with increasing exposure. In order to compare efficiencies of microbeam exposures at various wavelengths and mitotic stages, a least-squares regression line was drawn as shown in Fig. 1, the exposure required to
3l6 M I C R O - I R R A D I A T I O N O F C E L L S
Finally, under certain conditions, rate ratios greater than unity were observed, that is, nucleolar irradiation accelerated mitosis. This was particularly investigated with irradiations in early prophase and middle prophase with 280 nm and 265 nm microbeams, each irradiated cell having as its control a closely neighbouring cell in the same stage of mitosis. At 280 nm, with exposures ranging from 0-0003 t 0 ° '0 0 2 e rg>
nineteen cells exhibited rate ratios greater than unity and ranging from 1-04 to 2-4, whereas only two had ratios less than unity (about 0-8). A similar result was obtained with microbeams of 235 or 238 nm.
By contrast, at 265 nm, no range of exposures was found in which there was any such preponderance of ratios greater than unity.
In all the foregoing experiments of Ga u l d e n and co-workers, one nucleolus was irradiated (plus, of course, some superjacent and sub- jacent cytoplasm and nuclear material). When a given exposure was
delivered to each of the two nucleoli in a cell, retardation of mitosis was approximately the same as that resulting from the same exposure of only one nucleolus. This was observed with both 265 and 280 nm irradiation and at all mitotic stages.
Neuroblast nuclei were irradiated with 265 nm and 280 nm micro- beams at sites well removed from both nucleoli. All the mitotic stages of Fig. 2 were investigated. In general, large exposures stopped mitosis or retarded it, while smaller ones produced less retardation, but the plotted points were scattered much more than for nucleolar irradiation (Fig. 1). This suggests a great non-uniformity of relevant target material in the non-nucleolar part of the nucleus.
De n d y and Sm i t h also studied effects of u.v.-microbeam irradia- tion, under various conditions, upon the reproductive capacities of cells, and, in addition, made correlative observations upon their D N A content and the rate of D N A synthesis. Their microbeam was hetero- chromatic and had a focal spot 3-5 μ in diameter.
Cells of mouse L-strain were scattered singly on a quartz cover-slip which served as a window in a special culture chamber. When, after 3-5 days, each cell had produced a colony of four to eight cells, each colony was randomly assigned to one of four categories: A, B, C, D . Category D was not irradiated in any fashion. In each of the other three categories, each cell of each colony was given the microbeam exposure to (a) one nucleolus; (b) the nuclear sap (nucleoplasm);
or (c) the cytoplasm. Exposures lasted from 0*5 to 2 sec and were calculated to correspond to absorbed doses of the order of i o ~4 erg μ,- 3, the absorbance of the cytoplasm being taken as about half that of the
r a p p o r t e u r ' s r e p o r t 317
0 10 20 30 ώ 50 60 70 80 90 100
Time (hr) after irradiation
Fi g . 3. Effects of u.v. irradiation of various cell target areas upon
replication of mouse L-cells (De n d y and Sm i t h ) .
of silver grains over the same nucleus gave a measure of its rate of D N A synthesis at the time of flash-labelling.
Effects on reproductive rate are illustrated by Fig. 3, where each point represents the total number of cells in all colonies (seven or eight) in a particular category at a given time after irradiation. It will be noted that, in all irradiated categories, increase in cell number was delayed, this amounting to roughly 60, 40 and 20 h for cells irradiated in nucleolus, nuclear sap and cytoplasm, respectively. After this delay, cell numbers in all categories increased at rates less than the controls.
nuclear regions. After irradiation the cells of each colony were counted and photographed at 12-h intervals, and after 7 days the culture was flash-labelled with tritiated thymidine, fixed, Feulgen stained, and finally autoradiographed. The total D N A in each nucleus was deter- mined in arbitrary units by microspectrophotometry, and the number
3l8 M I C R O - I R R A D I A T I O N O F C E L L S
The cells irradiated in cytoplasm showed a rate not far from the controls. However, both of the categories given nuclear irradiation were greatly deficient in replicative rate, which agrees qualitatively with the results of Ga u l d e n , Ca r l s o n and Ja g g e r. Analysis of the individual cells in the photographed colonies showed that the average decrease in replicative rate in the irradiated categories was due to two phenomena : (a) some of the irradiated cells failed completely to divide, usually developing into giants or polynucleates ; (b) the rest divided and so did their progeny, but some of them did so at less than the control rate.
An interesting physiological effect was displayed by the category irradiated in the nucleolus (Fig. 3). The cell count remained constant for about 15 h and then decreased precipitously to less than 15 per cent of the original value. This massive decrease was due to detachment of cells from the quartz cover-slip. A hint of the same behaviour was shown by the cells irradiated in the nuclear sap.
The spectrophotometric and radio-autographic results can be described by reference to Fig. 4, in which each point represents a single cell in the control category. Its abscissa is the total D N A in the nucleus (arbitrary units), and the ordinate is grain count over the same nucleus. All cells with zero grain count are shown by closed circles.
For clarity, some are shown slightly displaced from the true zero grain-count ordinate. The distribution of these points is bimodal with respect to D N A content. The two means, at 50 and 100 arbitrary units, are taken to be the mean telophase and mean prophase values, and the cells in these two groups are assumed to be in G1 and G2 stages of the cell cycle, respectively. The cells with grain counts (open circles) are correspondingly assigned to the S-stage. Irradiation delivered to any of the three cellular sites failed to change the mean telophase or pro- phase D N A . However, the variance of the D N A values was signi- ficantly increased by irradiation of either nucleolus or nuclear sap.
In each category of irradiated cells, an interesting type of metabolic abnormality was observed: A few cells with spectrophotometric D N A values within the normal range exhibited abnormally high rates of D N A synthesis, as indicated by grain count. T w o other clear-cut types of abnormality, giant cells and polynucleate cells, have already been mentioned. These had an incidence of 5 per cent in the control category and showed no statistically significant increase in the category irradiated in nuclear sap. On the other hand, they were significantly
facing p . 318
FIG. 7. Disappearance of spindle birefringence in Amblystoma cells after various exposures to 8-/X u.v. microbeam aimed into cytoplasm a few microns from spindle. Top row, three cells before irradiation. Bottom row, same three cells after irradiation: (b) spindle not detectable; (d) diminished; (/) not affected (BROWN and ZIRKLE).
FIG. 8. Metaphase and early anaphase of first meiotic division in a spermatocyte of crane fly Nephrotoma suturalis. b, bivalent ; u, univalent ; m, mitochondria. In anaphase each of the three bivalents (A, B) separates into a pair of oppositely migrating dyads (H). Phase microscopy; marker represents ίο μ (FORER).
FIG. 9. Production of area of reduced birefringence (arb) in half-spindle of Nephrotoma spermatocyte by u.v.- microbeam exposure (Α-D) and its migration to the pole of the spindle (E-J). Polarization microscopy; marker represents 10 μ. A, Β, C: 6-5, 5, 0-5 min before irradiation. D, E, F, G, Η, I, J: 2, 3, 4, 5, 6, 11, 16, 17 min after irradiation (FORER).
r a p p o r t e u r ' s r e p o r t 319
55
50-
AOH
5 30-
2 20·
ο
D N A GRAINS OVER VALUE THE NUCLEUS
CELL 10 1 9 3 0 ( 2 NUCLEI) 9 8 1 3 CELL 3 2 4 7 0 ( 2 NUCLEI) 1 0 8 0 CELL 3 7 1 9 8 0 CELL 5 9 3 8 3 0 CELL 9 7 2 7 7 0
Ο Ο Ο
Ο ( Ο Ο Ο Ο Ο Ο Ο
Ο Ο
Ο
Ο
Ο
M E A N ι ° M E A N T E L O P H A S E I P R O P H A S E D N A VALUE Y D N A VALUE
ψ· · Μ · · · f · ·ι f ι · «·ι· · · ·ι « τ τ·-
15 25 35 45 55 65 75 85 95 105 115 125 DNA arbitrary units
Fi g . 4. D N A per nucleus of mouse L-cells (arbitrary units) and rate of D N A synthesis (flash-labelling with tritiated thymidine). Each point represents one nucleus. All closed circles have true ordinate of
zero (De n d y and Sm i t h ) .
of spindles, and, at the First International Photobiology Congress,
Ca r l s o n (1954) presented evidence that the wavelength dependence of this effect roughly paralleled absorption in protein. Shortly afterward
Bl o o m, Zi r k l e and Ur e t z (1955) found that, in tissue-culture cells of amphibia (Triturus; Amblystoma) spindles could be diminished or even caused to disappear by suitable u.v.-microbeam irradiation of part of the cell. In the first experiments the microbeam traversed one more frequent in the categories irradiated in cytoplasm and in nucleolus.
The remaining two papers deal with various effects upon spindles.
Ca r l s o n and Ho l l a e n d e r (1948) discovered that, in grasshopper neuroblasts, total-cell u.v. irradiation produced diminution in size
320 M I C R O - I R R A D I A T I O N O F C E L L S
1-0 4-0 Exposure (ergs/cell)
FIG. 5. Typical exposure-effect curve for disappearance of spindles after cytoplasmic irradiation with S-μ u.v. microbeam. The 50 per cent effective exposure (EE50) is read off at probit 5 (BROWN and
ZIRKLE).
and in all cases were directed to a portion of the cytoplasm a few microns away from the metaphase spindle of a tissue-culture cell of Amblystoma tigrinum. Effects on the spindle were observed by polarization microscopy. This is illustrated in Fig. 7, where all spindles in the top row were photographed before irradiation, and the bottom row shows the same three cells after irradiation; in (b) the biréfringent spindle has completely disappeared, in (d) it has dimin- ished in size, and in (/) it has undergone no change in size. At all of the twelve wavelengths, the exposure-effect curves were of the same shape. Figure 5 shows a plot of the probit of the percentage of spindles destroyed against the logarithm of 275 nm exposure. At each wave- length a value of relative effectiveness was calculated by converting or both of the half-spindles, plus, of course, the subjacent and super- jacent cytoplasm. It was soon learned, however, that the same diminu- tion or disappearance could be achieved by approximately the same exposures to cytoplasm only.
The work reported here by Br o w n and Zi r k l e was designed to determine the wavelength dependence of this indirect action. Twelve wavelength bands, 4-5 nm in width, were selected from the range 225-302 nm. The absolute power in each microbeam was determined with a calibrated photomultiplier, and exposures were graded by progressive doubling. All microbeams had focal spots 8 μ in diameter
r a p p o r t e u r ' s r e p o r t 321
2Λ00 2600 o 2800 3000
Wavelength (A)
Fi g . 6. Action spectrum for spindle disappearance (crosses) compared with absorption spectra of two tyrosine-containing proteins (con- tinuous lines). The ordinate of each point of the action spectrum is proportional to the reciprocal of the EE50 (Fig. 5). In each chart the action spectrum is normalized vertically to provide best fit to absorp-
tion spectrum (Br o w n and Zi r k l e ) .
nucleic acids, etc.). Only one class of molecules—the tyrosine- containing proteins—demonstrated even an approximate approach to parallelism. In Fig. 6B and C, are shown the absorption spectra of two such proteins (trypsin and ribonuclease). The points of the action spectrum were normalized vertically to achieve the best overall fit, which appears good enough to make us suspect that a protein is the
21
the 50 per cent exposure (corresponding to probit 5) to photons per cell and taking its reciprocal. The resulting twelve values were plotted against wavelength to obtain the shape of the action spectrum (Fig. 6).
This spectrum was compared with absorption spectra of numerous substances known or suspected to be contained in cytoplasm (lipids,
322 M I C R O - I R R A D I A T I O N O F C E L L S
cytoplasmic material which absorbs the particular photons that make spindles diminish or disappear.
The possible nature of such a species of protein is the subject of more speculation than can even be outlined here. However, it may be pointed out that this species could be the structural spindle protein itself if one visualizes a biréfringent metaphase spindle as consisting essentially of elongate aggregates of protein molecules in equilibrium or in steady state with a cytoplasmic pool of single molecules of the same species.
In contrast to Br o w n and Zi r k l e, who attacked spindles by ir- radiating cytoplasm, Fo r e r aimed his microbeams directly into the spindle itself. His cells were spermatocytes of the crane fly Nephrotoma suturaltSy and his spindles were those of the first meiotic division. The phase-contrast appearance of such a cell during metaphase and early anaphase is shown in Fig. 8. One great advantage of this material is the small number of chromosomes, which makes the spindle essentially a clear target for the microbeam. The most prominent members of the metaphase chromosome complement are the three bivalents (b in Fig. 8A), each of which, in anaphase, yields a pair of oppositely migrating dyads (Fig. 8H). The microbeams were heterochromatic, and their wavelength distribution was sometimes varied by means of filters. The size of the focal spot varied with the experiment at hand, but it was always small in relation to the half-spindle ; its cross- sectional shape was usually almost rectangular. The exposure per unit area was the same for most of the experiments and was of the order of
io ergs /x~2; thus the total energy delivered to the cell varied with area of focal spot. With this equipment and material, Fo r e r made a formidable collection of observations, only a fraction of which can even be mentioned here.
Perhaps the most striking of these observations is illustrated by Fig. 9, which is the record of one cell as observed by means of sensitive polarization microscopy, the biréfringent spindle appearing bright.
In frame A (6-5 min before irradiation) the marker indicates the portion of the half-spindle to be irradiated, C shows an image of the microbeam focal spot (0-5 min before irradiation), and D shows plainly (2 min after irradiation) an area of reduced birefringence (arb) where the focal spot was aimed but nowhere else. This area promptly migrated to the pole of the irradiated half-spindle as seen in frames E, F, G, H and I (3, 4, 5, 6, 11 and 16 min after irradiation, respectively). The velocity of migration, in all cells containing such an area of reduced
RAPPORTEUR S REPORT 323 birefringence, was equal to or slightly greater than the velocity of
chromosomes in normal anaphase.
In many instances it was feasible to irradiate selectively one or more of the three dyad (chromosomal) spindle fibres in a half-spindle. Such irradiations were performed in either metaphase or anaphase, the results, of course, being somewhat different. Here we consider only some of the effects of anaphase irradiations on velocity of dyad movement.
TABLE I. Summary of effects of irradiating one, two or three chromosomal fibres in one half-spindle on anaphase movement of the three pairs of chromo- some dyads in first meiotic division of twenty-five Nephrotoma spermatocytes.
In Row ι, the three chromosomal fibres in the irradiated half-spindle are designated a'y b\ c'y but only those in the path of the microbeam are shown.
In Row 5, dyads that retained normal anaphase velocity are designated a, b, c, corresponding to fibres a , b\ c', respectively ; those which stopped temporarily are respectively Ay Bf C. In all cells but one, both members of a dyad pair behaved identically (FORER).
I Fibre(s) irradiated a', b', cr b\ c' a' V
2 No dyad affected ι cell ι cell
3 All six dyads slowed ι cell
4 All six dyads stopped 3 cells 5 cells 2 cells
5 Some dyads stopped, 5 cells: 3 cells : 4 cells : others not affected
Abe ABc ABc
2 Abe 2ABc ABc
aBC aBC aBC
Z aBC aBC aBC
abC aBc
abC a~Bc
ABC aBC
Whether one, two or three chromosomal fibres were irradiated, the effects on dyad velocity were almost always of an all-or-none nature.
Table 1 summarizes the results on twenty-five cells. In only one of these were the dyads slowed down; in all the remaining twenty-four cells, some dyads stopped completely, resuming movement 10-20 min later, while the velocity of the others was unaffected. In two cells, all
324 MICRO-IRRADIATION OF CELLS
six dyads were unaffected. In ten cells, all six dyads stopped, and there seems to be no correlation between frequency of this occurrence and the number of fibres irradiated. In the remaining twelve cells, some dyads were unaffected and the others stopped ; with one excep- tion, both members of any one pair always behaved the same. It will be noted that, of the dyad pairs that stopped, some had an irradiated spindle fibre and some did not, and the same holds for dyad pairs whose velocities were unaffected.
The twenty-five cells summarized in Table ι all showed reduced birefringence in the irradiated areas. However, thirty-four additional cells were similarly irradiated but showed no change in birefringence.
Moreover, the distribution of stopped dyad pairs in these thirty-four cells was very similar to that observed in the twenty-five which showed reduced birefringence. Thus there seems to be no correlation between the stoppage of anaphase chromosome movement and the localized derangement of spindle components that is indicated by reduced birefringence. This no doubt has great import for theories of spindle function.
REFERENCES
Bl o o m W., Zi r k l e R. E . and Ur e t z R . B . (1955) Ann. N.Y. Acad. Sei. 59,
503-13·
Ca r l s o n J. G . (1954) Proc. First Intern. Photobiol. Congr., pp. 137-8. H . Veenam & Zonen, Wageningen.
Ca r l s o n J.G. and Ho l l a e n d e r A . (1948) J. Cell. Comp. Physiol. 3 1 , 149-73, Ch a h o t i n S. (1912) Biol. Zbl. 3 2 , 623-30.
Sm i t h C . L . (1964) Int. Rev. Cytol. 1 6 , 133-53.
Ur e t z R . B . and Pe r r y R . P . (1957) Rev. Sei. Inst. 2 8 , 861-6, Zi r k l e R.E. (1957) Adv. Biol. Med. Phys. 5, 103-46,