Cytogenetic Prognostication Within Medulloblastoma Subgroups
David J.H. Shih, Paul A. Northcott, Marc Remke, Andrey Korshunov, Vijay Ramaswamy, Marcel Kool, Betty Luu, Yuan Yao, Xin Wang, Adrian M. Dubuc, Livia Garzia, John Peacock, Stephen C. Mack, Xiaochong Wu, Adi Rolider, A. Sorana Morrissy, Florence M.G. Cavalli, David T.W. Jones, Karel Zitterbart, Claudia C. Faria, Ulrich Schu¨ller, Leos Kren, Toshihiro Kumabe, Teiji Tominaga, Young Shin Ra,
Miklo´s Garami, Peter Hauser, Jennifer A. Chan, Shenandoah Robinson, La´szlo´ Bogna´r, Almos Klekner, Ali G. Saad, Linda M. Liau, Steffen Albrecht, Adam Fontebasso, Giuseppe Cinalli, Pasqualino De Antonellis, Massimo Zollo, Michael K. Cooper, Reid C. Thompson, Simon Bailey, Janet C. Lindsey, Concezio Di Rocco, Luca Massimi, Erna M.C. Michiels, Stephen W. Scherer, Joanna J. Phillips, Nalin Gupta, Xing Fan, Karin M. Muraszko, Rajeev Vibhakar, Charles G. Eberhart, Maryam Fouladi, Boleslaw Lach, Shin Jung, Robert J. Wechsler-Reya, Michelle Fe`vre-Montange, Anne Jouvet, Nada Jabado, Ian F. Pollack,
William A. Weiss, Ji-Yeoun Lee, Byung-Kyu Cho, Seung-Ki Kim, Kyu-Chang Wang, Jeffrey R. Leonard, Joshua B. Rubin, Carmen de Torres, Cinzia Lavarino, Jaume Mora, Yoon-Jae Cho, Uri Tabori, James M. Olson, Amar Gajjar, Roger J. Packer, Stefan Rutkowski, Scott L. Pomeroy, Pim J. French, Nanne K. Kloosterhof, Johan M. Kros, Erwin G. Van Meir, Steven C. Clifford, Franck Bourdeaut, Olivier Delattre, Franc¸ois F. Doz, Cynthia E. Hawkins, David Malkin, Wieslawa A. Grajkowska, Marta Perek-Polnik, Eric Bouffet, James T. Rutka, Stefan M. Pfister,
and Michael D. Taylor
Processed as a Rapid Communication manuscript. Listen to the podcast by Dr Robinson at www.jco.org/podcasts
Author affiliations appear at the end of this article.
Published online ahead of print at www.jco.org on February 3, 2014.
Support information appears at the end of this article.
D.J.H.S., P.A.N., and M.R. contributed equally to this work. S.M.P. and M.D.T.
are co-senior authors.
Authors’ disclosures of potential con- flicts of interest and author contribu- tions are found at the end of this article.
Corresponding author: Michael D.
Taylor, MD, PhD, Hospital for Sick Chil- dren, 555 University Ave, Suite 1503, Toronto, ON M5G-1X8 Canada; e-mail:
mdtaylor@sickkids.ca.
© 2014 by American Society of Clinical Oncology
0732-183X/14/3209w-886w/$20.00 DOI: 10.1200/JCO.2013.50.9539
A B S T R A C T
Purpose
Medulloblastoma comprises four distinct molecular subgroups: WNT, SHH, Group 3, and Group 4.
Current medulloblastoma protocols stratify patients based on clinical features: patient age, metastatic stage, extent of resection, and histologic variant. Stark prognostic and genetic differences among the four subgroups suggest that subgroup-specific molecular biomarkers could improve patient prognostication.
Patients and Methods
Molecular biomarkers were identified from a discovery set of 673 medulloblastomas from 43 cities around the world. Combined risk stratification models were designed based on clinical and cytogenetic biomarkers identified by multivariable Cox proportional hazards analyses. Identified biomarkers were tested using fluorescent in situ hybridization (FISH) on a nonoverlapping medulloblastoma tissue microarray (n ⫽ 453), with subsequent validation of the risk stratifica- tion models.
Results
Subgroup information improves the predictive accuracy of a multivariable survival model compared with clinical biomarkers alone. Most previously published cytogenetic biomarkers are only prognostic within a single medulloblastoma subgroup. Profiling six FISH biomarkers (GLI2,MYC, chromosome 11 [chr11], chr14, 17p, and 17q) on formalin-fixed paraffin-embedded tissues, we can reliably and reproducibly identify very low-risk and very high-risk patients within SHH, Group 3, and Group 4 medulloblastomas.
Conclusion
Combining subgroup and cytogenetic biomarkers with established clinical biomarkers substantially improves patient prognostication, even in the context of heterogeneous clinical therapies. The prognostic significance of most molecular biomarkers is restricted to a specific subgroup. We have identified a small panel of cytogenetic biomarkers that reliably identifies very high-risk and very low-risk groups of patients, making it an excellent tool for selecting patients for therapy intensification and therapy de-escalation in future clinical trials.
J Clin Oncol 32:886-896. © 2014 by American Society of Clinical Oncology
J
OURNAL OFC
LINICALO
NCOLOGY O R I G I N A L R E P O R TINTRODUCTION
Medulloblastoma, the most common malignant childhood brain tu- mor, is an embryonal tumor with a peak incidence in early childhood.
Current therapy entails surgical resection, craniospinal irradiation, and high-dose chemotherapy. Risk stratification is based primarily on clinical variables, with high-risk patients identified as having leptomeningeal metastases at presentation and/or an incomplete resection.1-3Unfortunately, most survivors are left with long-term disabilities secondary to the disease and treatment.4-6Clinicians have hypothesized that improved patient prognostication could enable therapy intensification in high-risk patients and therapy de-escalation to maximize quality of life in lower-risk patients.
Numerous publications have attempted to identify biomarkers to either support or supplant clinical risk stratification.2,7-14Mutations of specific genes such asCTNNBandTP53have shown prognostic significance.15-19 Additional candidates include medulloblastoma- overexpressed genes such asTRKC,ERBB2, andFSTL5.20-25Several DNA copy-number aberrations have also been purported as biomark- ers, although the results have often been conflicting.15,26-48 These aberrations are summarized in Table 1. Few of these putative molec- ular biomarkers have been validated in prospective clinical trials.
It is now recognized that medulloblastoma is a collection of heterogeneous entities with disparate demographics, transcriptomes, genetics, and clinical outcomes.2,28,32,49-60
According to international consensus, the principle subgroups of medulloblastoma are WNT, SHH, Group 3, and Group 4.52Because earlier prognostic biomarker studies did not account for these subgroups, we hypothesized that some of the disparate biomarker findings could have resulted from differential subgroup representation among studies. Several previ- ously reported biomarkers were in fact enriched within a specific subgroup of the disease (eg, monosomy 6 in WNT tumors, MYC amplification in Group 3 tumors). In cases where a biomarker is prognostic across all medulloblastomas, but the prognostic impact is driven by a single subgroup, we suggest that the marker be designated as subgroup driven. These surrogate markers are replaceable by sub-
group status. In cases where a biomarker is variably or not effective across the spectrum of medulloblastomas but is valid only within a specific subgroup, we suggest that it be designated as subgroup spe- cific. Such biomarkers are prognostically informative only within spe- cific medulloblastoma subgroups.
To determine whether subgroup affiliation and cytogenetic bio- markers could support or supplant clinical variables for prognostica- tion in patients with medulloblastoma, we assembled an international discovery cohort of 673 medulloblastomas through MAGIC (Medul- loblastoma Advanced Genomics International Consortium), for which we had both clinical follow-up and whole-genome copy- number data. To begin, we identified subgroup-specific copy-number aberrations (CNAs) and integrated them with clinical variables to develop subgroup-specific risk models based on the discovery cohort.
To validate our models and ensure that our technique was generaliz- able to routine pathology laboratories, we then studied a panel of six cytogenetic biomarkers (GLI2,MYC, chromosome 11 [chr11], chr14, 17p, and 17q) using interphase fluorescent in situ hybridization (FISH) on a formalin-fixed paraffin-embedded (FFPE) medulloblas- toma tissue microarray (TMA) that included 453 medulloblastomas treated at a single center and did not overlap with the discovery cohort.
Our analysis of⬎1,000 patients with medulloblastoma clearly demonstrates that subgroup affiliation can improve prognostica- tion with clinical variables and that a majority of published molec- ular biomarkers are relevant only within a single subgroup. The combination of clinical variables, subgroup affiliation, and six cytogenetic markers analyzed on FFPE tissues can achieve an un- precedented level of prognostic prediction for patients that is prac- tical, reliable, and reproducible.
PATIENTS AND METHODS
Tumor Material and Patient Characteristics
A discovery set of 673 medulloblastoma samples with clinical follow-up was acquired retrospectively from 43 cities around the world. These samples
Table 1.Previously Reported Prognostic Molecular Markers in MB
Marker
Previous Studies Our Study
Cohort Prognosis Validated MB (P) SHH (P) Group 3 (P) Group 4 (P)
1q gain MB26,27 Poor No .61 .59 .018 .33
Chr2 gain SHH30 Poor No .16 .66 .17 .49
3q gain MB,32SHH32 Poor No .14 .20 .80 —
6q gain MB31 Poor No .61 .30 .94 .19
Chr6(q) loss MB15,31,34 Good SGD .002 .90 .73 —
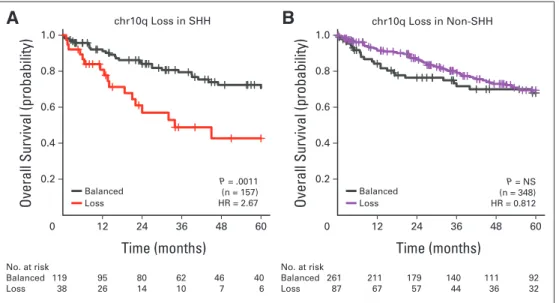
10q loss MB,32,35SHH30 Poor SGS .012 .001 .23 .082
17p loss MB,26,32,36-40SHH,30,32Group 432 Poor SGS .003 .011 .030 .37
17q gain MB,31,32,35,40SHH,30Group 3,32Group 432 Poor SGS .095 — .049 .72
Iso17q MB31,35,38,41 Poor SGS .005 — .008 .81
CDK6amplification MB32,40 Poor No .51 .36 .17 .55
GLI2amplification SHH30 Poor SGS <.001 .001 — —
MYCamplification MB31,42-46 Poor SGS <.001 — .011 .37
MYCNamplification MB,31,44SHH,32Group 432 Poor SGS .92 .002 — .24
OTX2amplification MB47 Poor No .61 — .46 .77
NOTE. Bold font indicates significance; — indicates event not observed at sufficient frequency (nⱕ1).
Abbreviations: chr, chromosome; iso, isochromosome; MB, medulloblastoma (across all subgroups); SGD, subgroup driven; SGS, subgroup specific.
were copy-number profiled on the Affymetrix SNP6 platform (Santa Clara, CA) to identify potential biomarkers.28An independent validation set of 453 samples with clinical follow-up on a TMA was analyzed using FISH as previ- ously described.53Tumors were classified based on signature marker expres- sion into molecular subgroups as previously described61; additional tumors were classified based on cytogenetic aberrations using standard condi- tional probability models. Subgroup affiliation was not available for 162 discovery samples. The validation set additionally included 50 WNT tu- mors not on the TMA. Details on clinical data are listed in Data Supple- ment 1, along with the availability of clinical and cytogenetic data. Nucleic acid isolation, TMA construction, and-catenin mutation analysis were performed as previously described.28
Prognostic Biomarker Identification
Cytogenetic events and CNAs were identified as previously described in the discovery set.28Subsequent to biomarker discovery, cross validation was performed to estimate the reproducibility of the candidates in an independent cohort, with multiple-hypothesis correction. Additionally, sample size esti- mates for prospective trials of the biomarkers were calculated based on the observed hazard ratios. Additional details are available in Data Supplement 1.
Statistical Analyses
Patient survivals were analyzed using the Kaplan-Meier method. The predictive values of biomarkers were assessed through time-dependent re- ceiver operating characteristic analyses. Details of the survival analyses and risk model selections are available in Data Supplement 1.
RESULTS
Prognostic Significance of Clinical Variables Within Medulloblastoma Subgroups
Many prior medulloblastoma biomarker studies were limited by sample size. Our study included 1,126 patients with medulloblastoma (673 discovery plus 453 validation patients; Data Supplement 1), which is more than double the sample size of any prior medulloblas- toma biomarker study, and it is one of few studies to include a valida- tion cohort (Data Supplement 2). Although the discovery cohort accumulated by MAGIC consists of medulloblastomas gathered from 43 different treating centers from around the world, the subgroup- specific outcomes mirror those previously published, with good out- comes for patients with WNT, poor outcomes for those with Group 3, and intermediate outcomes for those with SHH and Group 4 medul- loblastomas (Data Supplement 2), suggesting that the discovery co- hort was a representative sample (Data Supplement 1).
To assess long-term survivors, patients with WNT medulloblas- toma were observed for up to 10 years, and only two deaths were observed among 53 patients, both resulting from tumor recurrence (Fig 1A; Appendix Fig A1A, online only; Data Supplement 1). Among those with SHH tumors, there were significantly better outcomes among adult patients as compared with children or infants (Fig 1B;
Appendix Fig A1B, online only). Infants with Group 4 tumors had significantly worse outcomes than children or adults (Fig 1B; Appen- dix Fig A1B, online only), suggesting that radiation therapy is critical in the treatment of Group 4 medulloblastoma. There was no consis- tent association between sex and prognosis in any of the four sub- groups (Data Supplement 1). Desmoplastic histology indicated a more favorable prognosis than classic histology, which was more favorable than anaplastic histology among SHH tumors (Data Supplement 1). Large-cell/anaplastic histology was prognostically significant for Group 3 medulloblastomas in the discovery cohort but not in the validation cohort.
Metastatic status was not prognostic for patients with WNT tumors; however, macroscopic metastasis (M2/M3) was consistently associated with poor survival in all non-WNT subgroups, although the clinical effect was modest among patients with Group 4 disease (Fig 1C; Appendix Fig A1C, online only). Although the prognostic significance of M0 disease as compared with M2/3 disease was con- vincing across SHH, Group 3, and Group 4 subgroups, the prognostic significance of isolated M1 disease (presence of tumor cells in cerebro- spinal fluid) was less clear (Fig 1C; Appendix Fig A1C, online only;
Data Supplement 1). Isolated M1 disease was not consistently associ- ated with poor prognosis in the discovery or validation cohort for any subgroup, which may be the result of small sample sizes. There were no CNAs in any of the subgroups that were associated with an in- creased risk of leptomeningeal dissemination (Data Supplement 1).
Overall, many clinical biomarkers continued to exhibit prognostic significance when medulloblastoma was analyzed in a subgroup- specific fashion (Data Supplement 1).
Subgroup and Metastatic Status Are the Most Powerful Predictive Prognostic Biomarkers
Multivariable survival analyses were conducted to examine the relative predictive value of clinical variables and subgroup affiliation.
Stepwise Cox regressions revealed that subgroup affiliation signifi- cantly contributed to multivariable survival prediction, on top of a regression model already parameterized by sex, age, metastatic status, and histology (Data Supplement 2). Furthermore, Cox proportional hazards models parameterized with both clinical biomarkers and mo- lecular subgroups achieved higher accuracy in time-dependent re- ceiver operating characteristic analyses (Data Supplements 1 and 2).
In isolation, each biomarker had modest prediction accuracy (Data Supplement 2) compared with the complete multivariable model (Data Supplement 2). In the complete model, the removal of meta- static status and subgroup led to the greatest decreases in predictive accuracy (Data Supplement 2). Taken together, these results suggest that subgroup affiliation and metastatic status are the most important predictive biomarkers and that they make nonredundant contribu- tions to the prediction of survival. We conclude that combining both clinical and molecular biomarkers can enhance prediction of pa- tient survival.
Subgroup Specificity of Published Molecular Biomarkers
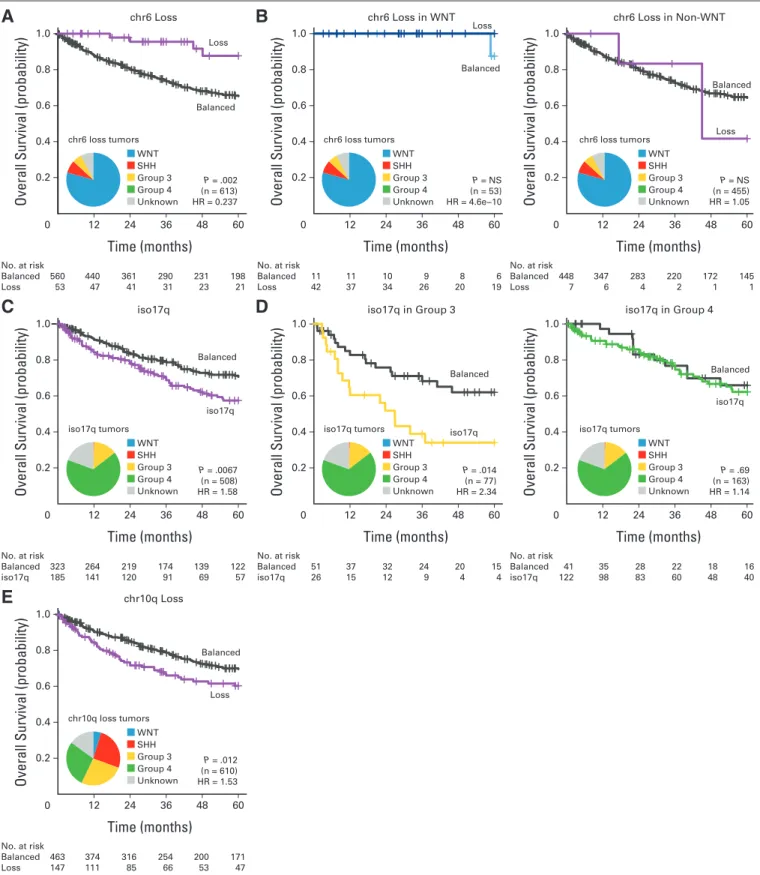
Several cytogenetic biomarkers have been associated with patient survival across medulloblastoma, but their prognostic value has sel- dom been assessed in the context of medulloblastoma subgroups (Table 1). Monosomy for chromosome (chr) 6 is associated with improved survival across medulloblastoma in toto (Fig 2A; Data Sup- plement 1). However, the prognostic value of chr6 loss can be com- pletely attributed to its enrichment in WNT medulloblastomas (Fig 2B; Data Supplement 1), because loss of chr6 has no prognostic value among patients with WNT or non-WNT tumors when compared with their respective controls with balanced chr6. We suggest that monosomy 6 is a subgroup-driven biomarker; its prognostic signifi- cance is driven by its enrichment in a particular subgroup, and it thus holds no further significance in subgroup-specific analysis. Further- more, these results would add a note of caution to using monosomy 6 as the lone diagnostic criterion for WNT medulloblastoma, because it was also observed in non-WNT medulloblastomas (seven [14%] of 49
monosomy 6 medulloblastomas were not in WNT subgroup), and monosomy 6 was only present in 42 (79%) of 53 WNT tumors. The prognostic role of isochromosome (iso) 17q has been controversial;
for our cohort in toto, iso17q was a statistically significant predictor of
poor outcome (Fig 2C). However, subgroup-specific analysis demon- strated that iso17q was highly prognostic for Group 3 but not for Group 4 medulloblastoma (Fig 2D), indicating that it is a subgroup- specific molecular biomarker. Similarly, although 10q loss was a
A
0
Overall Survival (probability)
Time (months)
1.0
0.8
0.6
0.4
0.2
36 96
12 24 48 60 72 84 108120
No. at risk
Pediatric 43 38 34 27 21 19 12 10 9 7 7 Adult 9 9 9 8 7 6 5 4 4 3 2
B
0
Overall Survival (probability)
Time (months)
1.0
0.8
0.6
0.4
0.2
48
24 60
12 36
No. at risk
Infant 49 35 27 22 15 14 Child 72 56 39 30 23 20 Adult 35 29 27 19 14 11
0
Overall Survival (probability)
Time (months)
1.0
0.8
0.6
0.4
0.2
No. at risk
Infant 9 6 3 2 2 1 Child 180 150 129 101 82 68
Adult 13 13 9 8 6 6
C
0
Overall Survival (probability)
Time (months)
1.0
0.8
0.6
0.4
0.2
No. at risk
M0 95 84 68 54 37 33
M2/M3 18 10 4 2 2 1
0
Overall Survival (probability)
Time (months)
1.0
0.8
0.6
0.4
0.2
No. at risk
M0 41 38 33 24 17 14
M2/M3 24 10 6 5 4 4
48
24 60
12 36
48
24 60
12 36 12 24 36 48 60
Pediatric
Adult
Infant Child Adult
Child
Child
Infant Infant
Adult Adult
M0
M2/M3 M0
M2/M3 P = .029 (n = 52)
Infant Child Adult
P = .038 (n = 156) HR = 0.383
M0 M2/M3
P < .001 (n = 113) HR = 5.05
Infant Child Adult
P = .0042 (n = 202) HR = 0.244, 0.159
M0 M2/M3
P < .001 (n = 65) HR = 5.63 WNT
SHH Group 4
SHH Group 3
Fig 1.(A) Ten-year overall survival curves for WNT medulloblastoma by age group.
(B) Overall survival curves for age groups within SHH and Group 4 subgroups (in- fant, age⬍3 years; child, age 3 to⬍16 years; adult, ageⱖ16 years). (C) Overall survival curves for metastatic status for SHH and Group 3 subgroups. Numbers belowx-axis represent patients at risk of event; statistical significance evaluated using log-rank tests; hazard ratio (HR) es- timates derived from Cox proportional hazards analyses.
B A
D
0
Overall Survival (probability)
Time (months)
1.0
0.8
0.6
0.4
0.2
48
24 60
12 36
No. at risk
Balanced 560 440 361 290 231 198 Loss 53 47 41 31 23 21
C
0
Overall Survival (probability)
1.0
0.8
0.6
0.4
0.2
No. at risk
Balanced 323 264 219 174 139 122 iso17q 185 141 120 91 69 57
E
0
Overall Survival (probability)
1.0
0.8
0.6
0.4
0.2
No. at risk
Balanced 463 374 316 254 200 171 Loss 147 111 85 66 53 47
Time (months)
48
24 60
12 36
Time (months)
48
24 60
12 36
0
Overall Survival (probability)
Time (months)
1.0
0.8
0.6
0.4
0.2
48
24 60
12 36
No. at risk
Balanced 11 11 10 9 8 6 Loss 42 37 34 26 20 19
0
Overall Survival (probability)
1.0
0.8
0.6
0.4
0.2
No. at risk
Balanced 51 37 32 24 20 15
iso17q 26 15 12 9 4 4
Time (months)
48
24 60
12 36
0
Overall Survival (probability)
Time (months)
1.0
0.8
0.6
0.4
0.2
48
24 60
12 36
No. at risk
Balanced 448 347 283 220 172 145 Loss 7 6 4 2 1 1
0
Overall Survival (probability)
1.0
0.8
0.6
0.4
0.2
No. at risk
Balanced 41 35 28 22 18 16 iso17q 122 98 83 60 48 40
Time (months)
48
24 60
12 36
chr6 Loss
iso17q
chr10q Loss
chr6 Loss in WNT
iso17q in Group 3
chr6 Loss in Non-WNT
iso17q in Group 4 chr6 loss tumors
Balanced Loss
Balanced
iso17q
Balanced
Loss WNT
SHH Group 3 Group 4 Unknown
iso17q tumors WNT SHH Group 3 Group 4 Unknown
chr10q loss tumors WNT SHH Group 3 Group 4 Unknown
P = .002 (n = 613) HR = 0.237
P = NS (n = 53) HR = 4.6e−10 Balanced Loss
Balanced
Loss
P = NS (n = 455) HR = 1.05
P = .0067 (n = 508) HR = 1.58
P = .014 (n = 77) HR = 2.34 iso17q Balanced
iso17q Balanced
P = .69 (n = 163) HR = 1.14
P = .012 (n = 610) HR = 1.53
chr6 loss tumors WNT SHH Group 3 Group 4 Unknown
iso17q tumors WNT SHH Group 3 Group 4 Unknown
chr6 loss tumors WNT SHH Group 3 Group 4 Unknown
iso17q tumors WNT SHH Group 3 Group 4 Unknown
Fig 2.(A) Overall survival curves and frequency distribution of chromosome 6 (chr6) status across entire cohort. (B) Overall survival curves for chr6 status in WNT and non-WNT medulloblastomas. (C) Overall survival curves and frequency distribution of isochromosome 17q (iso17q) across entire cohort. Patients with broad gain or loss of chr17 excluded. (D) Overall survival curves for iso17q status in Group 3 and Group 4 subgroups. (E) Overall survival curves for chr10q status across entire cohort. HR, hazard ratio; NS, not significant.
modestly significant predictor of poor outcome across medulloblas- tomas (Fig 2E), its prognostic power was limited to SHH tumors in a subgroup-specific analysis (Appendix Figs A2A and A2B, online only). We conclude that determination of subgroup affiliation is cru- cial in the evaluation and implementation of molecular biomarkers for patients with medulloblastoma (Table 1; Data Supplement 1), because some putative biomarkers are merely enriching for a specific subgroup (ie, subgroup driven), whereas most others are significant only within a specific subgroup (ie, subgroup specific).
Patients With SHH Tumors Can Be Stratified Into Three Distinct Risk Groups
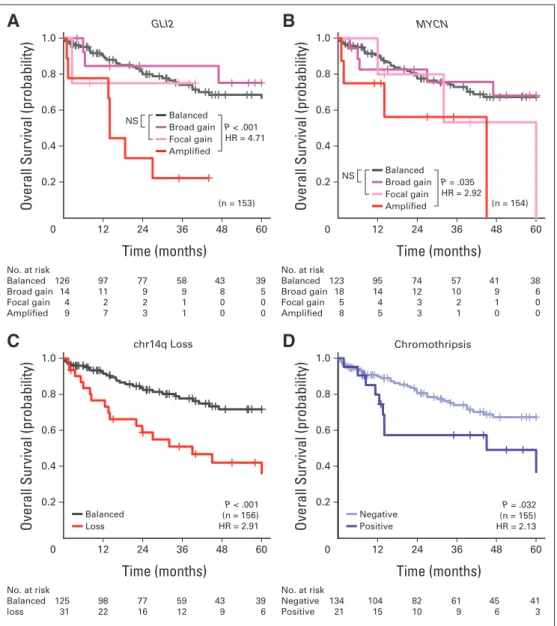
We identified 11 CNAs that were prognostically significant in our SHH medulloblastoma discovery set (Appendix Figs A3A to A3D, online only; Data Supplement 1) in univariable survival analyses.
Given the considerable number of candidates, the reproducibility of the identified biomarkers was assessed through cross validation to facilitate candidate prioritization, and the sample sizes required for prospective trials were estimated for future studies (Data Supplement 1). Specific amplifications but not broad gains encompassingGLI2or MYCNwere associated with poor prognosis (Appendix Figs A3A and A3B, online only; Data Supplement 1). Loss of chr14q conferred significantly inferior survival (Appendix Fig A3C, online only). There was no minimal region of deletion on chr14 in patients with SHH tumors (Data Supplement 1), and recent medulloblastoma rese- quencing efforts have not identified any recurrent single-nucleotide variants on chr14 in SHH medulloblastoma.28,54,56,57,62The presence of chromothripsis (ie, chromosome shattering) was associated with worse survival in those with SHH tumors (Appendix Fig A3D, on- line only).17
B A
C
D
0
Overall Survival (probability)
Time (months)
1.0
0.8
0.6
0.4
0.2
48
24 60
12 36
No. at risk
Low risk 84 67 57 45 32 30 Standard risk 39 27 19 13 10 6
High risk 12 8 3 1 0 0
0
Overall Survival (probability)
1.0
0.8
0.6
0.4
0.2
No. at risk
Low risk 116 116 95 80 78 68 Standard risk 26 24 16 12 8 6 High risk 23 20 12 9 8 5
Time (months)
48
24 60
12 36
Discovery
Validation
P < .001 (n = 165) Low risk
Standard risk High risk
P < .001 (n = 135) Low risk
Standard risk High risk k
s i r w o L k
s i r d r a d n a t S k s i r h g i H
SHH
Not GLI2 amplified GLI2 amplifed
No 14q loss 14q loss
M+ M0 M+ M0
****** ***
Clinical + molecular Molecular Clinical Clinical + molecular Molecular Clinical
0.5 0.6 0.7 0.8
AUC
SHHNon-SHH
Infant Child Adult Not anaplastic Anaplastic Female Male
M+
M0
12.9× risk
3.96× risk GLI2 amplifed
14q loss M+
Sex Age Anaplastic
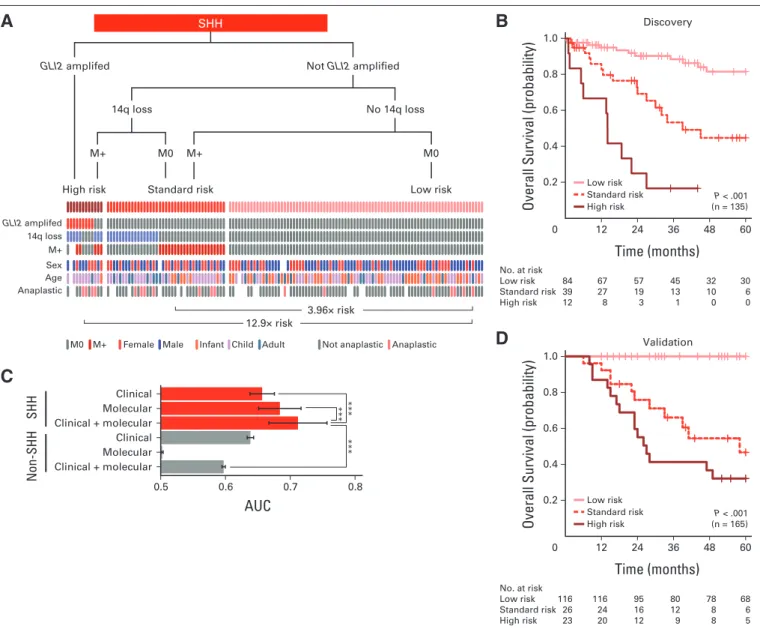
Fig 3.Clinical prognostication of patients with SHH medulloblastoma. (A) Risk stratification of SHH medulloblastomas by molecular and clinical prognostic markers.
Decision tree, with events plot depicting status of molecular and clinical markers across risk groups below. (B) Overall survival curves for SHH risk groups. (C) Average time-dependent areas under the curve (AUCs) for risk groups stratified using only clinical or molecular markers or both. Risk stratification regimens applied to SHH and non-SHH medulloblastomas. ***P⬍.001 by Friedman rank sum tests. (D) Survival curves for SHH risk groups in validation cohort. Survival differences evaluated by log-rank tests; hazard ratio estimates derived from Cox proportional hazards analyses.
To integrate the individual biomarkers into a risk stratification model, multivariable Cox analyses were performed on all significant biomarkers. Through multiple stepwise regression procedures, a con- sensus set of biomarkers was selected for inclusion in the model in an unbiased manner. The proposed risk stratification scheme represents the model that was most consistent with available data in the discovery cohort, from among many possible alternatives (Figs 3A and 3B; Data Supplement 1). GLI2amplification, 14q loss, and leptomeningeal dissemination identified high- and standard-risk patients. Specifically, GLI2amplification alone identified patients with poor prognosis (Figs 3A and 3B; Data Supplement 1). Absence of these markers defined a low-risk group of patients who exhibited survivorship reminiscent of patients with WNT tumors. Importantly, none of the covariates, particularly age and anaplastic histology, could explain the survival differences observed among risk groups (Figs 3A and 3B; Data
Supplement 1). Direct application of the proposed risk stratifica- tion scheme on the independent validation cohort yielded distinct survivorship rates for the three risk groups, thereby validating the model (Fig 3D).
Two additional stratification schemes were constructed using only clinical biomarkers or only cytogenetic markers; however, the proposed model, which combines both types of biomarkers, yielded the highest accuracy (Fig 3C; Data Supplement 1). Further- more, the accuracy of the combined risk model was drastically reduced when applied across patients with non-SHH tumors, fur- ther underscoring the importance of taking subgroup into consid- eration during risk stratification. We conclude that by using two molecular biomarkers (GLI2and 14q FISH) and metastatic status, we can practically and reliably predict prognosis for patients with SHH medulloblastoma.
B A
C
D
0
Overall Survival (probability)
Time (months)
1.0
0.8
0.6
0.4
0.2
48
24 60
12 36
No. at risk
Standard risk 37 29 25 20 16 13 High risk 53 32 27 20 15 14
0
Overall Survival (probability)
1.0
0.8
0.6
0.4
0.2
No. at risk
Standard risk 18 18 13 11 8 3 High risk 70 54 32 24 17 13
Time (months)
48
24 60
12 36
Discovery
Validation
P = .013 (n = 88) Standard risk
High risk
P < .001 (n = 90)
Clinical + molecular Molecular Clinical Clinical + molecular Molecular Clinical
0.5 0.6 0.7 0.8
AUC
Group 3Non-Group 3
Standard risk High risk
Infant Child Adult Not anaplastic Anaplastic Female Male
M+
M0
Group 3
None
High risk MYC amplified
or iso17q
or M+
Standard risk
5.76× risk MYC amp
iso17q M+
Sex Age Anaplastic
****** ***
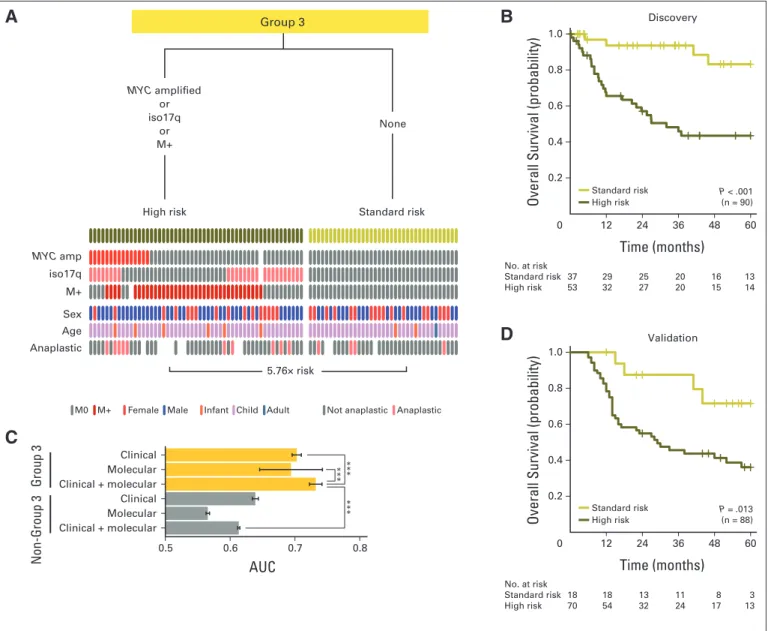
Fig 4.Clinical prognostication of patients with Group 3 medulloblastoma. (A) Risk stratification of Group 3 medulloblastomas by molecular and clinical prognostic markers. Decision tree, with events plot depicting status of molecular and clinical markers across risk groups below. (B) Overall survival curves for Group 3 risk groups.
(C) Average time-dependent areas under the curve (AUCs) for risk groups stratified using only clinical or molecular markers or both. Risk stratification regimens applied to Group 3 and non–Group 3 medulloblastomas. ***P⬍.001 by Friedman rank sum tests. (D) Survival curves for Group 3 risk groups in validation cohort. Survival differences evaluated by log-rank tests; hazard ratio estimates derived from Cox proportional hazards analyses. Iso, isochromosome.
Metastatic Status, Iso17q, andMYC
Amplification Identify High-Risk Patients With Group 3 Medulloblastoma
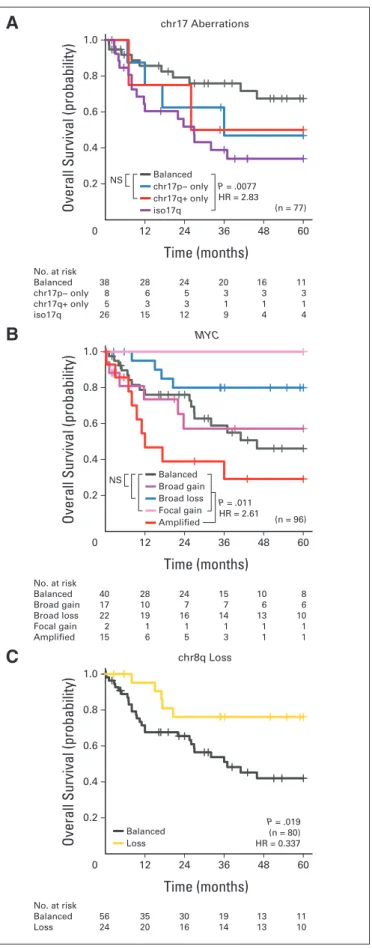
In patients with Group 3 tumors, iso17q andMYCamplification remained the only cytogenetic markers associated with poor survival (Appendix Figs A4A and A4B, online only), whereas chr8q loss and chr1q gain were the only good prognosis markers (Appendix Fig A4C, online only; Data Supplement 1). In multivariable survival analyses, patients with metastasis, iso17q, orMYCamplification represented the high-risk group (Figs 4A and 4B). Critically, absence of these markers identified a population of patients with Group 3 tumors with favorable prognosis. The risk groups were not associated with any clinical covariates, including age (Figs 4A and 4B; Data Supplement 1).
Consistent with the findings in patients with SHH tumors, optimal risk stratification of those with Group 3 tumors required the use of
both clinical and molecular prognostic markers, which have little prognostic value outside of Group 3 (Fig 4C; Data Supplement 1). Our proposed risk stratification scheme was validated on the nonoverlap- ping validation cohort using three molecular biomarkers (MYC, 17p, and 17q FISH) and metastatic status (Fig 4D).
Identification of a Low-Risk Group of Patients With Metastatic Group 4 Medulloblastoma
Patients with Group 4 tumors with whole-chromosome loss of chr11 or gain of chr17, in addition to 10p loss, exhibited better survival under univariable Cox models (Appendix Fig A5A, online only; Data Supplement 1). There was no cytogenetic marker associated with poor prognosis (Data Supplement 1). Specifically, neitherMYCNgain nor amplification was associated with poorer survival in those with Group 4 tumors, in stark contrast to patients with SHH tumors, reinforcing
B A
C
D
0
Overall Survival (probability)
Time (months)
1.0
0.8
0.6
0.4
0.2
48
24 60
12 36
0
Overall Survival (probability)
1.0
0.8
0.6
0.4
0.2
Time (months)
48
24 60
12 36
Discovery
Validation
Clinical + molecular Molecular Clinical Clinical + molecular Molecular Clinical
0.5 0.6 0.7 0.8
AUC
Group 4Non-Group 4
No. at risk
Low risk 59 55 44 36 31 26 Standard risk 79 62 53 42 35 30 High risk 55 44 36 26 19 14
No. at risk
Low risk 87 86 73 58 47 35 Standard risk 69 65 40 27 18 13 High risk 44 40 24 17 7 3 P < .001 (n = 200) Low risk
Standard risk High risk
P = .0012 (n = 193) Low risk
Standard risk High risk
Infant Child Adult Not anaplastic Anaplastic Female Male
M+
M0
Group 4
M+ M0
Neither
High risk Standard risk Low risk
****** ***
chr11 loss chr17 gain M+
Sex Age Anaplastic
5.35× risk
3.33× risk
chr11 loss or chr17 gain
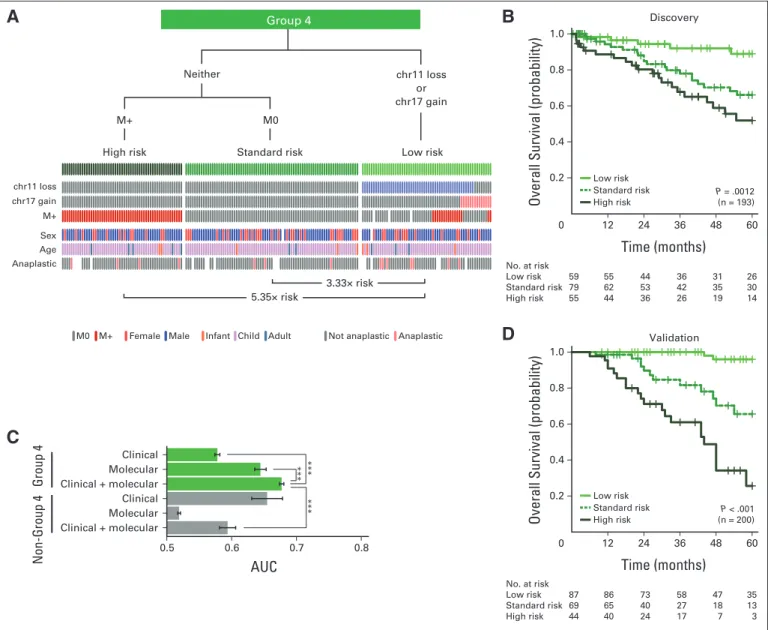
Fig 5.Clinical prognostication of patients with Group 4 medulloblastoma. (A) Risk stratification of Group 4 medulloblastomas by molecular and clinical prognostic markers. Decision tree, with events plot depicting status of molecular and clinical markers across risk groups below. (B) Overall survival curves for Group 4 risk groups.
(C) Average time-dependent areas under the curve (AUCs) for risk groups stratified using only clinical or molecular markers or both. Risk stratification regimens applied to Group 4 and non–Group 4 medulloblastomas. ***P⬍.001 by Friedman rank sum tests. (D) Survival curves for Group 4 risk groups in validation cohort. Survival differences evaluated by log-rank tests; hazard ratio estimates derived from Cox proportional hazards analyses. Chr, chromosome.
the distinction in their underlying biology (Appendix Fig A5B, online only; Data Supplement 1). Similarly, none of the cytogenetic biomark- ers identified for patients with Group 3 tumors (eg, iso17q) had any prognostic value for those with Group 4 tumors (Data Supplement 1).
After unbiased model selection, the consensus set of biomarkers re- sulted in a risk stratification scheme in which leptomeningeal dissem- ination identified high-risk patients with Group 4 tumors, except in the context of chr11 loss or chr17 gain (Figs 5A and 5B). The biology underlying chr11 loss was not apparent, because there was no obvious minimal common region of deletion (Data Supplement 1), nor were there any recurrent single-nucleotide variants on chr11 reported. Pa- tients with Group 4 tumors with either chr17 gain or chr11 loss, irrespective of metastatic status, exhibited excellent survivorship in both the discovery and validation cohorts (Figs 5B and 5D), and the survival differences were not explainable by covariates (Data Supple- ment 1). Consistent with other subgroups, the risk stratification model using both clinical and molecular biomarkers achieved the highest accuracy (Fig 5C). Critically, the cytogenetic biomarkers iden- tified low-risk patients with Group 4 tumors who would be otherwise designated as high risk by evidence of metastasis and/or anaplastic histology; this finding could not be extrapolated to patients with SHH or Group 3 medulloblastoma (Figs 5A to 5C; Data Supplement 1). We conclude that through the use of three molecular biomarkers (chr11, 17p, and 17q FISH) and metastatic status, we can reliably predict the prognosis of patients with Group 4 medulloblastoma.
DISCUSSION
Current consensus identifies the existence of four major subgroups of medulloblastoma, with excellent prognosis for those with WNT tu- mors, intermediate prognosis for those with SHH and Group 4 tu- mors, and poor prognosis for those with Group 3 tumors.32,52 However, early evidence suggests clinical heterogeneity within these core subgroups.7,30,63Practical and reliable prognostication of risk could allow for therapy intensification in high-risk children to im- prove survival and de-escalation of therapy in low-risk children so as to avoid the significant complications of therapy. However, the ma- jority of published medulloblastoma biomarker studies included only small cohorts of patients, were not validated on nonoverlapping co- horts, and were performed in the presubgrouping era. Our prognostic study of 1,123 medulloblastomas, using techniques (eg, FISH) com- patible with FFPE tissues, has identified clinically applicable risk strat- ification for SHH, Group 3, and Group 4 medulloblastomas.
We have demonstrated that medulloblastoma subgroup affilia- tion is significantly more informative for predicting patient outcome than existing clinical variables and that by incorporating subgroup status with conventional clinical parameters for risk stratification, the accuracy of survival prediction can be dramatically improved. More-
over, we have proposed, tested, and validated novel subgroup-specific risk stratification models incorporating both clinical and molecular variables. These models performed robustly both in the discovery cohort consisting of heterogeneously treated groups of patients and in a nonoverlapping validation cohort of patients treated at a single institution according to standardized treatment protocols. Because we do not have detailed treatment information for patients in the discov- ery cohort, it is possible that treatment protocols (type, duration, or intensity) could have affected our results. We suggest that this possi- bility can only be eliminated through examination of our stratification model in a sufficiently large prospective cohort. Although our study used single-nucleotide polymorphism arrays or interphase FISH on FFPE sections, it is possible that other approaches such as array com- parative genomic hybridization could also be used to determine the copy-number status of the six markers.64Through the incorporation of current clinical variables, subgroup affiliation, and our six copy- number prognostic markers, as detailed in Data Supplement 1, rapid prognostication is feasible in the setting of a regular hospital neuropa- thology laboratory, making it a clinically utile technique. Because both subgrouping assays and prognostic FISH markers will need to be performed in a Clinical Laboratory Improvement Amendments–
approved laboratory, we suggest that these assays be adopted and optimized in most major neuro-oncology centers, whereas smaller centers may consider sending tissues for analysis at larger centers. Our findings demonstrate the utility of incorporating tumor biology into clinical decision making and offer a novel perspective on risk stratifi- cation using FISH applicable on paraffin sections; thus, they could be translated immediately into routine clinical practice.
AUTHORS’ DISCLOSURES OF POTENTIAL CONFLICTS OF INTEREST
The author(s) indicated no potential conflicts of interest.
AUTHOR CONTRIBUTIONS
Conception and design:David J.H. Shih, Paul A. Northcott, Marc Remke, Andrey Korshunov, Stefan M. Pfister, Michael
D. Taylor
Provision of study materials or patients:Jennifer A. Chan, Linda M.
Liau, Xing Fan, Robert J. Wechsler-Reya, Anne Jouvet, Carmen de Torres, Roger J. Packer
Collection and assembly of data:All authors
Data analysis and interpretation:David J.H. Shih, Paul A. Northcott, Marc Remke, Andrey Korshunov, Vijay Ramaswamy, Yuan Yao, Robert J. Wechsler-Reya, Erwin G. Van Meir, Stefan M. Pfister, Michael D. Taylor
Manuscript writing:All authors
Final approval of manuscript:All authors
REFERENCES
1.Gajjar A, Chintagumpala M, Ashley D, et al:
Risk-adapted craniospinal radiotherapy followed by high-dose chemotherapy and stem-cell rescue in children with newly diagnosed medulloblastoma (St Jude Medulloblastoma-96): Long-term results from a prospective, multicentre trial. Lancet Oncol 7:813- 820, 2006
2.Northcott PA, Korshunov A, Pfister SM, et al:
The clinical implications of medulloblastoma sub- groups. Nat Rev Neurol 8:340-351, 2012
3.Lannering B, Rutkowski S, Doz F, et al: Hyperfrac- tionated versus conventional radiotherapy followed by chemotherapy in standard-risk medulloblastoma: Results from the randomized multicenter HIT-SIOP PNET 4 trial.
J Clin Oncol 30:3187-3193, 2012
4.Edelstein K, Spiegler BJ, Fung S, et al: Early aging in adult survivors of childhood medulloblas-
toma: Long-term neurocognitive, functional, and physical outcomes. Neuro Oncol 13:536-545, 2011 5. Palmer SL, Hassall T, Evankovich K, et al:
Neurocognitive outcome 12 months following cere- bellar mutism syndrome in pediatric patients with medulloblastoma. Neuro Oncol 12:1311-1317, 2010 6. Lafay-Cousin L, Bouffet E, Hawkins C, et al:
Impact of radiation avoidance on survival and neu- rocognitive outcome in infant medulloblastoma.
Curr Oncol 16:21-28, 2009
7.Remke M, Hielscher T, Korshunov A, et al:
FSTL5 is a marker of poor prognosis in non-WNT/
non-SHH medulloblastoma. J Clin Oncol 29:3852- 3861, 2011
8.Remke M, Hielscher T, Northcott PA, et al:
Adult medulloblastoma comprises three major mo- lecular variants. J Clin Oncol 29:2717-2723, 2011
9.Dubuc AM, Northcott PA, Mack S, et al: The genetics of pediatric brain tumors. Curr Neurol Neu- rosci Rep 10:215-223, 2010
10.Castelo-Branco P, Choufani S, Mack S, et al:
Methylation of the TERT promoter and risk stratifi- cation of childhood brain tumours: An integrative genomic and molecular study. Lancet Oncol 14:534- 542, 2013
11.Northcott PA, Jones DT, Kool M, et al:
Medulloblastomics: The end of the beginning. Nat Rev Cancer 12:818-834, 2012
12.Pfister SM, Korshunov A, Kool M, et al: Mo- lecular diagnostics of CNS embryonal tumors. Acta Neuropathol 120:553-566, 2010
13.Ramaswamy V, Northcott PA, Taylor MD:
FISH and chips: The recipe for improved prognosti- cation and outcomes for children with medulloblas- toma. Cancer Genet 204:577-588, 2011
14.Northcott PA, Rutka JT, Taylor MD: Genomics of medulloblastoma: From Giemsa-banding to next- generation sequencing in 20 years. Neurosurg Fo- cus 28:E6, 2010
15.Ellison DW, Onilude OE, Lindsey JC, et al:
Beta-catenin status predicts a favorable outcome in childhood medulloblastoma: The United Kingdom Children’s Cancer Study Group Brain Tumour Com- mittee. J Clin Oncol 23:7951-7957, 2005
16.Thompson MC, Fuller C, Hogg TL, et al:
Genomics identifies medulloblastoma subgroups that are enriched for specific genetic alterations.
J Clin Oncol 24:1924-1931, 2006
17.Rausch T, Jones DT, Zapatka M, et al: Ge- nome sequencing of pediatric medulloblastoma links catastrophic DNA rearrangements with TP53 mutations. Cell 148:59-71, 2012
18.Pfaff E, Remke M, Sturm D, et al: TP53 mutation is frequently associated with CTNNB1 mutation orMYCNamplification and is compatible with long-term survival in medulloblastoma. J Clin Oncol 28:5188-5196, 2010
19.Tabori U, Baskin B, Shago M, et al: Universal poor survival in children with medulloblastoma har- boring somatic TP53mutations. J Clin Oncol 28:
1345-1350, 2010
20.Hernan R, Fasheh R, Calabrese C, et al:
ERBB2 up-regulates S100A4 and several other pro- metastatic genes in medulloblastoma. Cancer Res 63:140-148, 2003
21.Gilbertson RJ, Perry RH, Kelly PJ, et al: Prog- nostic significance of HER2 and HER4 coexpression in childhood medulloblastoma. Cancer Res 57:3272- 3280, 1997
22.Gilbertson RJ, Pearson AD, Perry RH, et al:
Prognostic significance of the c-erbB-2 oncogene product in childhood medulloblastoma. Br J Cancer 71:473-477, 1995
23.Eberhart CG, Kratz J, Wang Y, et al: Histo- pathological and molecular prognostic markers in medulloblastoma: C-myc, N-myc, TrkC, and anapla- sia. J Neuropathol Exp Neurol 63:441-449, 2004
24.Grotzer MA, Janss AJ, Phillips PC, et al:
Neurotrophin receptor TrkC predicts good clinical outcome in medulloblastoma and other primitive neuroectodermal brain tumors. Klin Padiatr 212:196- 199, 2000
25.Segal RA, Goumnerova LC, Kwon YK, et al:
Expression of the neurotrophin receptor TrkC is
linked to a favorable outcome in medulloblastoma.
Proc Natl Acad Sci U S A 91:12867-12871, 1994 26.McCabe MG, Ba¨cklund LM, Leong HS, et al:
Chromosome 17 alterations identify good-risk and poor-risk tumors independently of clinical factors in medulloblastoma. Neuro Oncol 13:376-383, 2011
27.Lo KC, Ma C, Bundy BN, et al: Gain of 1q is a potential univariate negative prognostic marker for survival in medulloblastoma. Clin Cancer Res 13:
7022-7028, 2007
28.Northcott PA, Shih DJ, Peacock J, et al:
Subgroup-specific structural variation across 1,000 medulloblastoma genomes. Nature 488:49-56, 2012 29.Northcott PA, Nakahara Y, Wu X, et al: Multi- ple recurrent genetic events converge on control of histone lysine methylation in medulloblastoma. Nat Genet 41:465-472, 2009
30.Northcott PA, Hielscher T, Dubuc A, et al:
Pediatric and adult sonic hedgehog medulloblasto- mas are clinically and molecularly distinct. Acta Neuropathol 122:231-240, 2011
31.Pfister S, Remke M, Benner A, et al: Outcome prediction in pediatric medulloblastoma based on DNA copy-number aberrations of chromosomes 6q and 17q and theMYCandMYCNloci. J Clin Oncol 27:1627-1636, 2009
32.Kool M, Korshunov A, Remke M, et al: Molec- ular subgroups of medulloblastoma: An international meta-analysis of transcriptome, genetic aberrations, and clinical data of WNT, SHH, group 3, and group 4 medulloblastomas. Acta Neuropathol 123:473-484, 2012
33.Clifford SC, O’Toole K, Ellison DW: Chromo- some 1q gain is not associated with a poor outcome in childhood medulloblastoma: Requirements for the validation of potential prognostic biomarkers.
Cell Cycle 8:787, 2009
34.Clifford SC, Lusher ME, Lindsey JC, et al:
Wnt/wingless pathway activation and chromosome 6 loss characterize a distinct molecular sub-group of medulloblastomas associated with a favorable prog- nosis. Cell Cycle 5:2666-2670, 2006
35.Korshunov A, Remke M, Werft W, et al: Adult and pediatric medulloblastomas are genetically dis- tinct and require different algorithms for molecular risk stratification. J Clin Oncol 28:3054-3060, 2010
36.Batra SK, McLendon RE, Koo JS, et al: Prog- nostic implications of chromosome 17p deletions in human medulloblastomas. J Neurooncol 24:39-45, 1995
37.Park AK, Lee SJ, Phi JH, et al: Prognostic classification of pediatric medulloblastoma based on chromosome 17p loss, expression of MYCC and MYCN, and Wnt pathway activation. Neuro Oncol 14:203-214, 2012
38.Lamont JM, McManamy CS, Pearson AD, et al: Combined histopathological and molecular cyto- genetic stratification of medulloblastoma patients.
Clin Cancer Res 10:5482-5493, 2004
39.Gilbertson R, Wickramasinghe C, Hernan R, et al: Clinical and molecular stratification of disease risk in medulloblastoma. Br J Cancer 85:705-712, 2001
40.Mendrzyk F, Radlwimmer B, Joos S, et al:
Genomic and protein expression profiling identifies CDK6 as novel independent prognostic marker in medulloblastoma. J Clin Oncol 23:8853-8862, 2005 41.Pan E, Pellarin M, Holmes E, et al: Isochromo- some 17q is a negative prognostic factor in poor-risk childhood medulloblastoma patients. Clin Cancer Res 11:4733-4740, 2005
42.Aldosari N, Bigner SH, Burger PC, et al: MYCC and MYCN oncogene amplification in medulloblas- toma: A fluorescence in situ hybridization study on
paraffin sections from the Children’s Oncology Group. Arch Pathol Lab Med 126:540-544, 2002
43.Ellison DW, Kocak M, Dalton J, et al: Defini- tion of disease-risk stratification groups in childhood medulloblastoma using combined clinical, patho- logic, and molecular variables. J Clin Oncol 29:1400- 1407, 2011
44.Ryan SL, Schwalbe EC, Cole M, et al: MYC family amplification and clinical risk-factors interact to predict an extremely poor prognosis in childhood medulloblastoma. Acta Neuropathol 123:501-513, 2012
45.Scheurlen WG, Schwabe GC, Joos S, et al:
Molecular analysis of childhood primitive neuroecto- dermal tumors defines markers associated with poor outcome. J Clin Oncol 16:2478-2485, 1998
46.Bien-Willner GA, Lo´pez-Terrada D, Bhattachar- jee MB, et al: Early recurrence in standard-risk medul- loblastoma patients with the common idic(17)(p11.2) rearrangement. Neuro Oncol 14:831-840, 2012
47.Adamson DC, Shi Q, Wortham M, et al: OTX2 is critical for the maintenance and progression of Shh-independent medulloblastomas. Cancer Res 70:181-191, 2010
48.Korshunov A, Remke M, Kool M, et al: Biolog- ical and clinical heterogeneity of MYCN-amplified medulloblastoma. Acta Neuropathol 123:515-527, 2012
49.Schwalbe EC, Williamson D, Lindsey JC, et al:
DNA methylation profiling of medulloblastoma al- lows robust subclassification and improved out- come prediction using formalin-fixed biopsies. Acta Neuropathol 125:359-371, 2013
50.Northcott PA, Dubuc AM, Pfister S, et al:
Molecular subgroups of medulloblastoma. Expert Rev Neurother 12:871-884, 2012
51.Dubuc AM, Morrissy AS, Kloosterhof NK, et al: Subgroup-specific alternative splicing in medullo- blastoma. Acta Neuropathol 123:485-499, 2012
52.Taylor MD, Northcott PA, Korshunov A, et al:
Molecular subgroups of medulloblastoma: The current consensus. Acta Neuropathol 123:465-472, 2012
53.Northcott PA, Korshunov A, Witt H, et al:
Medulloblastoma comprises four distinct molecular variants. J Clin Oncol 29:1408-1414, 2011
54.Jones DT, Ja¨ger N, Kool M, et al: Dissecting the genomic complexity underlying medulloblas- toma. Nature 488:100-105, 2012
55.Kool M, Koster J, Bunt J, et al: Integrated genomics identifies five medulloblastoma subtypes with distinct genetic profiles, pathway signatures and clinicopathological features. PLoS One 3:e3088, 2008
56.Parsons DW, Li M, Zhang X, et al: The genetic landscape of the childhood cancer medulloblas- toma. Science 331:435-439, 2011
57.Robinson G, Parker M, Kranenburg TA, et al:
Novel mutations target distinct subgroups of medul- loblastoma. Nature 488:43-48, 2012
58.Schwalbe EC, Lindsey JC, Straughton D, et al:
Rapid diagnosis of medulloblastoma molecular sub- groups. Clin Cancer Res 17:1883-1894, 2011
59.Ellison DW, Dalton J, Kocak M, et al: Medul- loblastoma: Clinicopathological correlates of SHH, WNT, and non-SHH/WNT molecular subgroups.
Acta Neuropathol 121:381-396, 2011
60.Gibson P, Tong Y, Robinson G, et al: Subtypes of medulloblastoma have distinct developmental origins. Nature 468:1095-1099, 2010
61.Northcott PA, Shih DJ, Remke M, et al: Rapid, reliable, and reproducible molecular sub-grouping of clinical medulloblastoma samples. Acta Neuropathol 123:615-626, 2012