R E S E A R C H A R T I C L E Open Access
Genetic diversity in developmental
responses to light spectral quality in barley (Hordeum vulgare L.)
Arantxa Monteagudo1, Tibor Kiss2, Marianna Mayer2, Ana M. Casas1, Ernesto Igartua1* and Ildikó Karsai2
Abstract
Background:Plants use light wavelength, intensity, direction and duration to predict imminent seasonal changes and to determine when to initiate physiological and developmental processes. Among them, crop responses to light are not fully understood. Here, we study how light quality affects barley development, using two broad- spectrum light sources, metal halide (M) and fluorescent (F) lamps. Eleven varieties with known allelic variants for the major flowering time genes were evaluated under controlled conditions (long days, same light intensity). Two experiments were carried out with fully-vernalized plants: 1) control treatments (M, F); 2) shifting chambers 10 days after the start of the experiment (MF, FM).
Results:In general, varieties developed faster under longer exposure to M conditions. The greatest differences were due to a delay promoted by F light bulbs, especially in the time to first node appearance and until the onset of stem elongation. Yield related-traits as the number of seeds were also affected by the conditions experienced.
However, not each variety responded equally, and they could be classified in insensitive and sensitive to light quality. Expression levels of flowering time genesHvVRN1,HvFT1andPPD-H1were high in M, whileHvFT3and HvVRN2were higher under F conditions. The expression under shift treatments revealed also a high correlation betweenHvVRN1andPPD-H1transcript levels.
Conclusions:The characterization of light quality effects has highlighted the important influence of the spectrum on early developmental stages, affecting the moment of onset of stem elongation, and further consequences on the morphology of the plant and yield components. We suggest that light spectra control the vernalization and photoperiod genes probably through the regulation of upstream elements of signalling pathways. The players behind the different responses to light spectra found deserve further research, which could help to optimize breeding strategies.
Keywords:Barley, Flowering, Gene expression, Growth, Light quality
Background
As plants are sessile organisms, they measure quantity (intensity), quality (spectral composition), direction and duration (photoperiod) of light to regulate their develop- ment and to acclimatise to the surrounding environment
[1–3]. The integration of several cues is essential for the plant to decipher what is happening around it and re- spond accordingly. In an example exposed by Casal and Qüesta [4]:“the same photoperiod can take place in late summer and spring”, thus an unique signal does not provide enough information, and more signals are needed to solve that ambiguity, similarly to what occurs in winter crops, in which the memory of winter temper- atures complements photoperiodic information to define
© The Author(s). 2020Open AccessThis article is licensed under a Creative Commons Attribution 4.0 International License, which permits use, sharing, adaptation, distribution and reproduction in any medium or format, as long as you give appropriate credit to the original author(s) and the source, provide a link to the Creative Commons licence, and indicate if changes were made. The images or other third party material in this article are included in the article's Creative Commons licence, unless indicated otherwise in a credit line to the material. If material is not included in the article's Creative Commons licence and your intended use is not permitted by statutory regulation or exceeds the permitted use, you will need to obtain permission directly from the copyright holder. To view a copy of this licence, visithttp://creativecommons.org/licenses/by/4.0/.
The Creative Commons Public Domain Dedication waiver (http://creativecommons.org/publicdomain/zero/1.0/) applies to the data made available in this article, unless otherwise stated in a credit line to the data.
* Correspondence:igartua@eead.csic.es
1Aula Dei Experimental Station (EEAD-CSIC), Avda. Montañana 1005, E-50059 Zaragoza, Spain
Full list of author information is available at the end of the article
the season. Spectral composition is a parameter of light sensed by plants that vary with altitude, latitude, seasons, and climatic and atmospheric factors [5]. During the day, spectral energy distribution of solar light changes between day, dawn and dusk, thus light quality contrib- utes to determine the precise timing of photoperiod sig- nals. Also, the relative levels of blue, red and far-red wavelengths change in many circumstances, for instance in presence of clouds. Thus, natural light spectra vary in a continuous state of flux, being accompanied by other environmental changes [6]. Finally, the radiation that reaches a plant is affected by these factors and by the canopy of neighbours in the vicinity [7]. All these cir- cumstances cause spectral differences that lead to com- plex interactions, affecting plant growth [8].
Flowering is a complex process that involves signals from several pathways recording information from the plant and the environment, and promoting transition to the reproductive stage under favourable conditions. Bar- ley (Hordeum vulgareL.) and wheat (Triticum spp.) are long-day (LD) plants, flowering earlier under increasing daylengths. Flowering promotion is controlled through the interplay of the major flowering time genes, VERNALIZATION 1 (HvVRN1), VERNALIZATION 2 (HvVRN2) and the homologous ofFLOWERING LOCUS T (FT), HvFT1. Vernalization and photoperiod signals must be integrated to allow timely flowering; thus, the aforementioned genes interplay with the long and short photoperiod response genes, PHOTOPERIOD RE- SPONSE1 (PPD-H1, whose candidate is HvPRR37 [9]), and PHOTOPERIOD RESPONSE2(PPD-H2, whose can- didate isHvFT3[10]), respectively.
The effect of light quality in plant growth has been widely studied, especially in horticultural and ornamen- tal species. Nowadays, new protocols for growing crops as fast as possible in indoor facilities are at the cutting edge of plant breeding research [11]. Optimizing the spectral composition of the growth chambers must be considered when planning an experiment, to favour fast development or facilitating replication of the results. In a recent experiment with LED lighting in wheat [3], light spectra and intensity affected development, metabolism, yield and quality, opening the possibility to modulate light to improve them.
The red to far-red (R:FR) ratio has been extensively studied due to its relation with vegetation shade and its consequent involvement in shade avoidance syndrome, including comparisons of different light sources [12–14].
Lately, much attention has been given to other wave- band ratios to which plant responsiveness is also highly dependent on the species and cultivar of interest [15]. In wheat, for instance, light quality was determinant in stem elongation, which was influenced by blue, green and far-red light antagonistically [3].
Our work has focused on the effect on plant develop- ment of two conventional artificial lighting regimens that provide different spectral quality: fluorescent (F) and metal halide (M) bulbs. Our aims are 1) to characterize the effect of different lighting systems and examine the conse- quences of transferring plants between both conditions, 2) to evaluate natural variation in the responses of a set of varieties from different origins, and 3) to determine the molecular effect on vernalization and photoperiod path- ways at early developmental phases. We have compared the responses on morphology and development, including apex examination, and gene expression studies of major flowering time genes in barley.
Results
Developmental responses to light quality
In this work, the effect of two broad-spectrum light sources was investigated: fluorescent (F) and metal hal- ide (M) light bulbs. Both light sources emit continuous visible spectra with major differences in specific regions (Figure S1). In general, fluorescent light was rich in the green-yellow (GY) and red (R) regions, whereas metal halide spectrum was more balanced across the photo- synthetically active region (PAR).
Eleven barley varieties with different allelic composition atHvVRN1,HvVRN2,HvFT1andHvFT3genes (described in Table1) were evaluated under M and F conditions, and in shift treatments that involved the interchange between growth chambers 10 days after the end of the vernalization process. In general, barley plants grown under F lighting flowered later than in M conditions (Fig. 1, M and F).
Among the phenological phases encompassing the flower- ing process (phenophases), time to first node appearance (DEV31) and from there until the onset of stem elong- ation phase (DEV30) were the most affected by the light- ing conditions (much longer in F).
Regarding the shift treatments, in general, plants trans- ferred from M to F (MF) took longer to reach the end of the stem elongation (ZDSE) than plants transferred from F to M (FM), but developed earlier than those in F con- ditions (Fig. 1). In both shifts, plants showed similar average duration of DEV31 phase, which took around 25 days. However, from that moment on, FM conditions shortened the duration of the different phenophases, be- coming more similar to development in M conditions.
Overall, the differences in phase duration among treat- ments were more concentrated in two stages, before and after onset of stem elongation (DEV30). The total duration until DEV30 was 24.2, 27.9, 34.4 and 52.4 days (at M, FM, MF, F, respectively). After DEV30, the sum showed little variation among treatments, being 13.9, 15.3, 17.3 and 17.8 days, at FM, MF, M and F, respect- ively. The analyses of variance revealed significant differ- ences between treatments, varieties and the interaction
treatment × variety for all the developmental phases (Figure S2).
Treatments M and FM showed rather similar duration of the phenophases (Fig.1). Ten days in fluorescent conditions caused slight delay in occurrence of DEV31 and DEV30 (later FM), but this delay was almost completely offset by the hastening of the three last phases. Larger differences were
found when comparing F and MF. Most of the phenophases were shorter after a period of 10 days under M conditions (Fig. 1), with the largest differences in the first two phases (DEV31 and DEV31–30). A brief exposition of 10 days under metal halide lighting (MF) supposed an acceleration of DEV31 up to 17.5 days, and an acceleration of awns appear- ance (DEV49) up to 31 days (Figure S3).
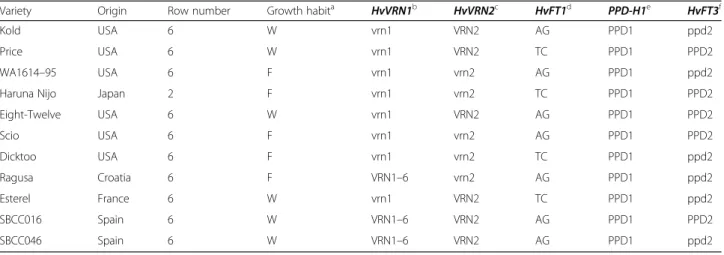
Table 1List of the barley genotypes examined and allelic variants for the major flowering time genes
Variety Origin Row number Growth habita HvVRN1b HvVRN2c HvFT1d PPD-H1e HvFT3f
Kold USA 6 W vrn1 VRN2 AG PPD1 ppd2
Price USA 6 W vrn1 VRN2 TC PPD1 PPD2
WA1614–95 USA 6 F vrn1 vrn2 AG PPD1 ppd2
Haruna Nijo Japan 2 F vrn1 vrn2 TC PPD1 PPD2
Eight-Twelve USA 6 W vrn1 VRN2 AG PPD1 PPD2
Scio USA 6 F vrn1 vrn2 AG PPD1 PPD2
Dicktoo USA 6 F vrn1 vrn2 TC PPD1 ppd2
Ragusa Croatia 6 F VRN1–6 vrn2 AG PPD1 ppd2
Esterel France 6 W vrn1 VRN2 TC PPD1 ppd2
SBCC016 Spain 6 W VRN1–6 VRN2 AG PPD1 PPD2
SBCC046 Spain 6 W VRN1–6 VRN2 AG PPD1 ppd2
aGrowth habit deduced from the alleles at lociHvVRN1andHvVRN2. W, winter; F, facultative
bAlleles based on the size of intron 1 [16]
cPresence/absence ofHvZCCT[17]
dAlleles based on two SNPs in intron 1 [18]
eAlleles based on SNP22 [9]
fPresence/absence ofPPD-H2[10]
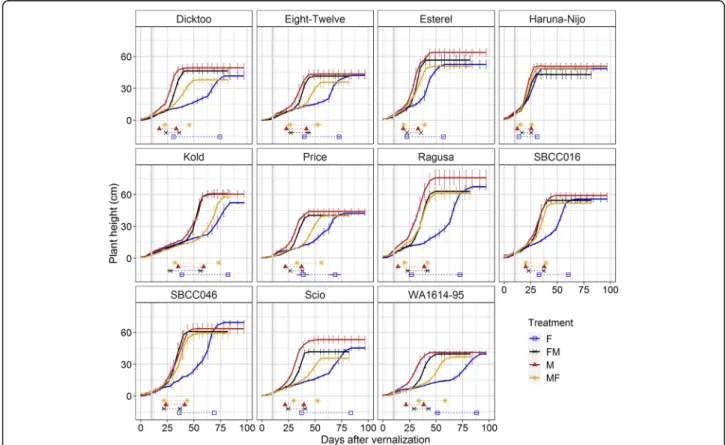
Fig. 1Duration of the different developmental phases under different lighting treatments. Metal halide (M), 10 days in fluorescent and then shift to metal halide (FM); fluorescent (F) and 10 days in metal halide and then shift to fluorescent (MF) bulbs. Mean of 11 varieties and 4 replicates per variety (n= 44), and standard deviation are represented as numbers in each phase. DEV31, first node appearance; DEV31–30, days from first node appearance to the onset of stem elongation; DEV30–37, days from the onset of stem elongation to the appearance of the flag leaf; DEV37–39, days to complete expansion of the flag leaf; DEV39-DEV49, days from the completion of the flag leaf to awns appearance; DEV49-ZDSE, days from awns appearance to the end of stem elongation
Plants grown in continuous F light had a higher final number of leaves in the main stem than the other three treatments. Phyllochrons were also affected by the light treatments, with significantly longer phyllochron the more the plants were under F light (Figure S4).
The varieties showed different patterns of development in the control (M) conditions (Figure S5). Some varieties reached DEV31 at the same time despite the lighting system used, whereas fluorescent light delayed the tran- sition in other cases, as can be noticed by the distance from the dots to the 1:1 line. A diversity of responses was observed, with varieties Haruna Nijo and Kold as the most stable across light treatments.
Dynamics of apices and plant height
Dissection of plants was carried out at different time points of the experiment to study the development of the apices. Waddington stage and apex length were recorded. Apex development was delayed in plants growing under fluorescent conditions (Fig. 2). For api- ces dissected 10 days after the shift (20 days after vernalization), two contrasting patterns were detected:
shifted plants in FM showed the same delayed pattern as the plants from the initial F chamber but plants in MF progressed as readily as plants in M. Thus, the initial period under metal halide light produced a de- velopmental boost that accelerated development even after the shift to fluorescent lighting conditions. From 10 days after the shift to the last apex dissection, we observed different patterns of responses: (A) plants that adapted to the new conditions, showing the ex- pected pattern of growth according to the new condi- tions (Scio and Price), and (B) plants which showed small or no differences between treatments (Kold, Haruna Nijo, Ragusa).
The development of the apices in the shift treatments showed a rapid morphological change, whereas apex length presented a slower response (Figure S6). Apex development was measured several times during the ex- periment, but only once on the same date for all four treatments (day 30 after the start of the experiment, 20 days after the shifts). At this date, there were significant differences for apex development among varieties, treat- ments and their interaction (Table S1).
Fig. 2Dynamics of apex development under different light quality conditions. Each block represents a variety. Solid lines denote control treatments (white point is fluorescent, black point is metal halide), and dashed lines denote shift treatments (FM in squares, MF in triangles). The size of each dot represents the number of apices (biological replicates) at that Waddington stage. Dashed horizontal lines mark WD2, the double ridge stage, considered as transition from vegetative to reproductive phase. Vertical solid grey line denotes the shift day: the day when light quality treatments were changed. The shaded area indicates the 95% confidence interval (loess smooth line) calculated using a polynomial regression model
We observed diversity in the dynamics of plant height in response to light quality (Fig. 3). Some varieties showed a different behaviour only in F (Esterel, Ragusa, SBCC016 and SBCC046). Other varieties showed differ- ent development under the four treatments, with plants reaching the onset of stem elongation first under M, then in FM and MF, and finally in F conditions (Dicktoo, Eight-Twelve, Price, Scio and WA1614–95).
Final plant height was affected by the treatments (Fig- ure S4), but less than other traits like DEV30 (Figure S2) or the days to reach the 50% of the final plant height (Figure S4).
We analysed whether genotypic groups based on al- lelic composition at the flowering time genes described in Table 1 had any impact on development (Table S2).
We found only minor differences at the variety by treat- ment interaction level (HvFT1 by treatment for final plant height).
Reproductive fitness traits
The different duration of the developmental phases af- fected the traits measured at harvest. Plants grown under fluorescent conditions showed more nodes, shorter last internode, more spikelets per spike, less and lighter
seeds (Fig. 4) and more final leaves (Figure S7) than other treatments. Results showed differences between treatments for all the traits, except for the number of seeds in the main spike (ANOVA p-value = 0.182).
Plants grown in metal halide conditions had heavier seeds than plants grown under fluorescent conditions.
Plants grown in FM showed more reproductive tillers and number of seeds than those in M. Under fluorescent light, plants had more tillers in nine out of eleven var- ieties (Figure S8), but many did not produce spikes, resulting in the same number of reproductive tillers as in metal halide (Fig.4).
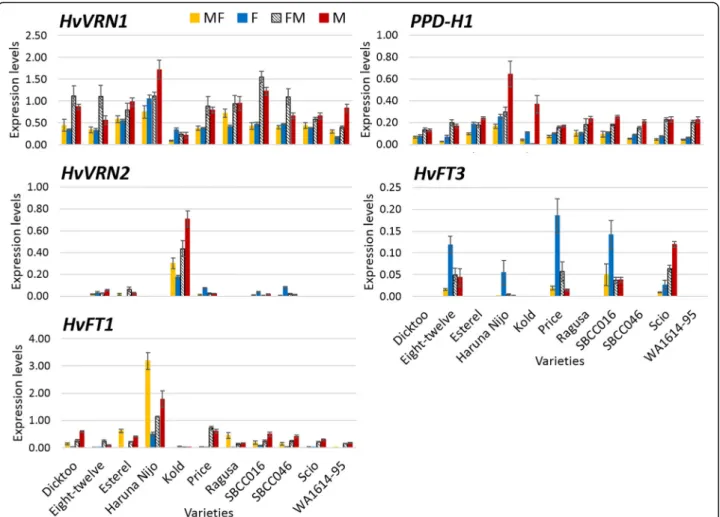
Gene expression
Expression of the major flowering time genes was ana- lysed in leaves of plants 20 days after the end of the vernalization treatment in all the conditions (10 days after the shift in FM and MF, Fig. 5, Table S3). For all varieties, except the earliest Haruna Nijo, sampling time occurred when the apices of most genotypes already had undergone the vegetative-generative transition, WD2.0 (Fig. 2) and the plants were either before DEV31, or be- tween DEV31 and DEV30 (Figure S3).
Fig. 3Dynamics of plant height under different light quality conditions. Each block represents a variety. Blue line, fluorescent (F); black line, FM;
red line, metallic (M); yellow line, MF. Each line represents the average of 4 biological replicates, and bars denote standard deviation. Under the curves, horizontal lines represent the time from first node appearance (DEV31, first dot) to awns appearance (DEV49) in the main stem. Vertical solid grey lines denote the shift day (the day when plants were switched between growth chambers with different light quality treatment)
Overall, HvFT1 was most expressed in Haruna Nijo, the earliest variety in this study. On the other hand, Kold, the latest variety, expressed HvVRN2 under all treatments, whereas its expression was much lower in other genotypes. HvFT3, when the functional variant was present, was upregulated under fluorescent condi- tion in most cases (Scio was the exception). Both genes were expressed in that condition.
An effect of light quality onHvVRN1andPPD-H1was observed. Both showed higher expression under M and FM conditions. These genes showed a rapid adaptation to new conditions, as their expression levels were more similar between MF and F, and between FM and M
conditions (Fig.5). Interestingly, the expression ofPPD- H1andHvVRN1showed a moderately high and positive Pearson correlation (r = 0.59).
As indicated before, most of the variation in duration of development in response to light conditions occurred before DEV30. Concurrent morphological and gene ex- pression changes were analysed with a biplot represent- ing a principal component analysis which included the duration of the two stages, before and after DEV30, for each genotype at each treatment, together with gene ex- pression (Fig. 6a, excluding HvVRN2and HvFT3, which are absent in about half of the genotypes). The first and the second components explained 41.11 and 16.03% of
Fig. 4Boxplots of traits measured at harvest in the four light quality treatments. F, fluorescent light; FM, 10 days in fluorescent light, then shift to metal halide light; M, metal halide light; MF, 10 days in metal halide, then shift to fluorescent conditions. In each box plot (n = 44), the mean is represented with a black diamond; the horizontal bar splitting the box represents the median; the height of the box represents the interquartile range, and the whiskers length represent 1.5 times of the interquartile range. From top to bottom, and left to right: number of nodes in the main stem; length of last internode of main stem in cm; length of the main spike in cm; number of spikelets per main spike; number of seeds in the main spike; individual seed weight (g) in the main spike; number of reproductive tillers per plant; total number of seeds per plant; and total seed weight per plant. Results derived from 4 plants per variety, 11 varieties. Different letters represent significant differences between treatments in a post-hoc LSD-test, for aP-value < 0.05
variance, respectively (Fig. 6a). The first component clearly separates the varieties according to treatments, by overall earliness, with M and FM on the right-hand side and F on the left, with MF intermediate. This com- ponent also separates between early and late varieties overall, particularly Scio and WA1614–95, the slowest under F conditions, from Haruna Nijo, the fastest variety in all conditions. The rapid transition to the elongation phase (indicated by a low DEV30 value) was associated with high expression levels of development inducing genesPPD-H1,HvVRN1andHvFT1(Fig. 6a), which had large loadings with opposite signs on the first compo- nent. This was confirmed by the correlation coefficients between apex stage at the date of the RNA sampling (20–23 days after the start of the experiment) and the expression levels of HvVRN1 (r = 0.42), PPD-H1 (r = 0.57) andHvFT1(r = 0.60). The second component pre- sented the largest loadings for the stem elongation phase, LSE (Fig. 6a). Similarly, when including all the phenophases and gene expression data in the analysis (Figure S9), DEV31 and DEV31–30 were the variables with the largest, and negative, loads on the first
component, meaning that they attain higher values at the F treatment, and lower at M and FM. The second component again correlated with the various characteris- tics of stem elongation. In this case DEV37–30 (days from the onset of stem elongation to the appearance of the flag leaf) had the largest loading. HvVRN2 contrib- uted positively in this axis, indicating that its higher ex- pression coincided with longer interval between the start of intensive stem elongation and flag leaf appearance.
In general, correlations and PCA suggested that high expression of the promoter genes of flowering favoured the acceleration of the first node appearance and the transition to the erect stage among other phenological phases, whereas the expression of HvVRN2 was associ- ated with lengthening of the stem elongation phase (Fig- ure S9).
Diversity in the response to different light sources We carried out an exploratory analysis to classify the varieties considering their response to the four treat- ments, using 17 traits, which included phenological and morphological responses (Table S4). As a result,
Fig. 5Gene expression under the different treatments. Samples were taken 20 days after the end of the vernalization treatment. Gene expression relative to Actin. Mean of 3 biological replicates. Bars represent SEM
varieties were divided in 4 groups. Haruna Nijo and Kold formed one group each (Fig. 6), despite being the most insensitive varieties: Haruna Nijo was the earliest and Kold the latest across treatments. The groups were not associated with the allelic variants for the major flowering time genes, although varieties were mainly divided by geographical origin in the two main groups. Thus, varieties from USA (Price, Eight- twelve, WA1614–95 and Scio) clustered together, with the exception of Dicktoo, which was located close to Ragusa, in the European group (Ragusa, Esterel, SBCC016 and SBCC046). In general, European var- ieties were less influenced by light quality treatments, whereas most of the American varieties responded showing an accelerated pattern of development under metal and shift conditions.
Discussion
Balanced spectra accelerated plant development
Under the same light intensities, temperature and photo- period, we observed striking differences in development that were solely due to the spectral compositions of the light sources. Fluorescent lights were rich in the green- yellow and red regions, whereas a more balanced spectra across the PAR region was produced by metal halide bulbs. Our results showed that metal halide conditions were more efficient hastening development than fluores- cent light bulbs, the effect of which proved to be devel- opmental phase specific.
In this work, we have established that light quality affects the duration of phenological phases before the onset of stem elongation, to the largest extent. The first node appearance (DEV31) and the transition between
Fig. 6Relations between developmental phases and genetic background.aPrincipal component analysis of expression of common genes and two phases of development. Red arrows represent values of gene expression ofHvVRN1,HvFT1andPPD-H1, and two phases of development:
days from the end of vernalization to the onset of the stem elongation (DEV30), and length of the stem elongation phase (LSE).bDendrogram for the 11 barley cultivars, based on phenology traits. Traits measured under 4 conditions (F, FM, MF, M)
prostrate to erect state of the plant (DEV31–30) took longer to occur under fluorescent conditions. This was consistent with the dynamics of apex development, ac- celerated in M light, and with an increased number of leaves and longer phyllochron in F light. Therefore, the retarded growth under F light was due to a combination of having more leaves to develop, and slower rate of leaf appearance. Final number of leaves was determined early during plant development, as there was almost no differ- ence between the two shift treatments, meaning that the conditions soon after the shift did not affect much to this trait. Phyllochron, on the other hand, was more affected by the conditions after the shift. Tillering was more profuse in fluorescent conditions although at the end of the experiment, plants grown under F showed the same number of reproductive tillers than plants in M. In addition, plants grown in F produced more spikelets per spike. The number of seeds per spike, however, was not different from the other treatments, but the seeds at F were significantly lighter. Therefore, the longer early phases under F conditions led to a longer phase of tiller production, but these plants were unable to grow all those tillers until the end and, even in that case, were less efficient in grain filling, even showing sterility or grain abortion. To the best of our knowledge, this is the first report indicating that light spectra of metal hal- ide bulbs accelerated barley development, reducing the duration of the stem elongation phase, producing plants with less biomass and heavier seeds than in fluorescent light.
It is well known that light quality, specifically the rela- tion of red and far-red light (R:FR ratio), is an important cue to regulate vegetative growth and the transition to reproductive stage in plants [19]. Changes in the R:FR ratio help plants detecting the presence of neighbours [20]. In response to low R:FR light ratio, many plants display a rapid and pronounced phytochrome-mediated architectural adaptation known as the shade avoidance syndrome [2,20–22]. In shade intolerant plants, such as Arabidopsis, this syndrome consists on an increase in the elongation growth rate of stems and petioles, re- duced chlorophyll content, increased apical dominance and early flowering [22, 23]. The different responses observed in this study could be related to the differences in intensity in some parts of the spectra, in particular the R:FR ratios of the systems. Fluorescent lights pro- duced very high R:FR ratios. Metal halide bulbs also showed high ratios of R:FR compared to natural condi- tions (~ 1.1), but 3 times lower than fluorescent. Consid- ering this, one could expect that plant responses under metal halide conditions could resemble those inducing shade avoidance responses. Plants grown with metal hal- ide light showed more rapid stem elongation, flowered earlier, but had reduced number of tillers, all responses
associated with shade avoidance. Yet, plant height at the end of the experiment was similar among treatments, whereas delayed apex development, extensive tillering and late flowering were observed in plants grown under fluorescent conditions. In this regard, when analysing the growth of 10 wheat cultivars under low red/far-red ratios, although plant height was unaffected, low R:FR ratios significantly reduced grain yield per plant (through grain number and, secondarily, through grain weight per plant) [1]. In our study, the comparison between M and F indicated that, on average, plants had heavier seeds with metal halide lights. All these observations suggest that even though metal halide may elicit a“shade-avoid- ance” response, the R:FR ratio is not low enough as to encompass a yield penalty. Other authors have already examined the effect of specific wavelengths in wheat growth and development. In a study using LED lighting, different light wavebands (blue, green and far-red) acted antagonistically over wheat development, specifically at lower intensities [3]. These authors revealed that a bal- anced ratio between blue and red lights accelerated flow- ering time in wheat. At first sight, this might agree with our results. However, the ratio B:R under metal halide and fluorescent conditions in our experiment is very similar and close to 1. Also, green light affects plant pro- cesses through cryptochrome dependent and independ- ent mechanisms, and its effect is opposed to those driven by red and blue wavebands [24]. As fluorescent spectrum was saturated on green and red wavelengths, it could explain the delay observed in barley plants devel- oped under this lighting regime.
Genes and gene expression underlying light responses As mentioned above, shade avoidance could be relevant to the responses observed. In fact, this mechanism has been described in barley, where carbon allocation in neighbouring plants was affected by changes in the red:
far-red light conditions influencing the emission of vola- tile organic compounds [25]. Traditionally, breeding ef- forts have attenuated some but not all shade avoidance responses in modern crop varieties [26]. The study of phytochrome null mutants in Arabidopsis led to the confirmation that they regulate the shade-avoidance syn- drome [20].
As red and blue light activate phytochromes and cryp- tochromes, a balanced spectrum in these regions might lead to rapid reproductive responses. Some reports also highlighted the importance of green light on develop- mental processes, through cryptochrome dependent mechanisms, and possibly other pathways. Its effect is generally opposed to those driven by red and blue wave- bands [24]. In Arabidopsis, it has been reported that green wavebands have an inhibitory effect onFTexpres- sion, caused by direct inactivation of CRY2 protein [27],
although this effect occurs mainly under low light condi- tions. It is worth noting that responses to green light vary among plant families, and wheat has been reported to respond to green-yellow light band (500–600 nm) by promoting earlier flowering [28]. In our experiment, fluorescent spectrum was richer on the green and red wavelengths, which could explain the delay observed in barley plants developed under this lighting regime.
The distinct spectra of fluorescent and metal halide bulbs caused differences in the expression levels of the major flowering times genes, even after full vernalization and day length of 16 h provided equally inductive condi- tions for all genotypes in both chambers. Positive regula- tors of flowering (HvVRN1, PPD-H1 and HvFT1) showed higher transcript levels in metal halide condi- tions than in fluorescent conditions for most of the var- ieties under study (Kold was the exception, although its expression levels were probably too low to be very pre- cise). This effect was clear and is one of the main findings of this study. Other studies have found a de- pendence of FT levels on light-quality, in this case re- lated to the effect of different R:FR ratios onArabidopsis mutants, and suggested a regulation by phyA and ELF3 [29]. As broad-spectrum light sources were used in this work, we cannot discard the involvement of other wave- bands in the downregulation of flowering promoters under fluorescent conditions or the upregulation under the balanced spectra of metal halide bulbs. In fact, the upregulation of the flowering promoters was in accord- ance with the low levels of the repressor of flowering HvVRN2, in metal halide conditions. This effect on vernalization genes was unexpected, as all the genotypes were fully vernalized before being transferred to the growth chambers to start the light quality treatments.
In barley, HvVRN2 expression is under photoperiod control, being upregulated by long days [30]. Here, we found increasedHvVRN2mRNA level in plants growing under fluorescent conditions, which was related to the reduced levels of HvVRN1 and the lengthening of the early phases. These results actually mimic the effect of an insufficient vernalization treatment [31, 32]. HvFT3 expression was upregulated under fluorescent condi- tions, compared to other treatments. A promoter role specifically under early phases of development was pro- posed forHvFT3 [33], and there is evidence pointing at its promoting effect when vernalization is not complete [31,32]. The larger expression ofHvFT3in F could be a compensation for the partial reversal of the vernalization effect.
In this work, we highlight the high correlation between HvVRN1and PPD-H1gene expression, explained by the similar levels found between F and MF, and between M and FM conditions. Shifting light quality conditions pro- duced rapid changes in gene expression levels. Only 10
days after the shift between conditions, expression of both genes was adapted to the new lighting treatment.
PPD-H1 plays a key role in the sensitivity to long day conditions in barley, and works as output of the circa- dian clock. Recently, the alteration of the circadian clock with light quality in barley has been reported [34]. We hypothesize thatPPD-H1 and HvVRN1are downstream factors of clock components that have been affected by the different light spectra conditions experienced. Ac- cording with this, a strong downregulation of thePPD-1 gene, and different expression of circadian clock compo- nents were observed in wheat mutants lacking PHYBor PHYC [35]. That finding could support our hypothesis, although more study is needed.
Mixture of spectra during different phases benefits plant growth
In general, plants subjected to shift conditions behaved closer to the metal halide control, even though MF plants passed most of the time under fluorescent condi- tions. We compared control and shift to determine whether 10 days in other lighting regime had effect on development. We observed that the pattern of develop- ment in FM was very similar to M. Thus, plants that started their development under fluorescent conditions were delayed, but recovered very fast. The delayed devel- opment caused by fluorescent lighting in early phases was overcome rapidly in metal halide conditions. On the contrary, when grown for 10 days in metal halide condi- tions and then shifted, plants did not behave as those in control fluorescent conditions. Plant development in MF was more rapid than under fluorescent conditions. Thus, 10 days in M were enough to accelerate development re- markably, which was not as severely impaired by the fluorescent spectrum as for plants grown continuously in that condition.
Different sensitivity to light quality and its biological sense for the diversity found
There were diverse responses to lighting treatments among the varieties under study. In all the treatments, Haruna Nijo was the earliest variety, being insensitive to light quality. This genotype carries a mutation in the Phytochrome C gene, conferring an extremely early phenotype, both under SD and LD conditions [36, 37].
We observed a gradation of responses to light quality in the other ten genotypes studied. Further research will be needed to unravel the genetic factors underlying these different responses.
This different sensitivity to light quality conditions might have its biological significance in the plant strat- egies that confer different ecological behaviour to cope with competitors and environment [38]. So far, research efforts on diversity of responses to light quality has been
mainly focused on different responses to low R:FR, for instance, to develop insensitive plants to the canopy of neighbours [39]. Certain tall Arabidopsis lines were less affected by low R:FR than short lines, and genotypes from lower latitudes were taller than genotypes from higher latitudes [40]. Similarly, the varieties here studied showed a different plant height dynamic associated with the different location. European varieties (Ragusa, Esterel, SBCC016 and SBCC046) and the Japanese one (Haruna Nijo) tended to be taller and showed lower re- sponsiveness to light quality conditions than those from USA (Kold, Price, WA1614–95, Eight-Twelve, Scio and Dicktoo), which were also shorter overall. This differ- ence in plant height probably reveals different breeding histories. Three of the European varieties were selected straight out of landraces (Ragusa, and both SBCC lines), whereas all American ones come from modern breeding programs. For this reason, it is likely that American varieties carry some semi-dwarf allele. A possible link between plant height and light sensitivity should be taken into account in further studies in this area.
Conclusions
The characterization of light quality effects has highlighted the important influence of the spectrum on early developmental stages, revealing the onset of stem elongation as the most affected, and other downstream effects on the morphology of the plant and yield compo- nents. The fluorescent light causes a partial reversal of the outcome of the vernalization process, delaying devel- opment compared to metal halide light, and affecting grain production. There is variability among barley ge- notypes regarding light quality sensitivity, which could be used in the selection and development of cultivars with greater competition ability. The natural variation found in the responsiveness to light quality reinforces the need of future research in genetic control of responses to different light parameters. Based on our re- sults, we suggest that light spectra regulate the vernalization and photoperiod genes probably through the regulation of upstream elements of signalling path- ways. Whether phytochromes or cryptochromes are be- hind the differences found between the balanced spectra of metal halide conditions and the green and red satu- rated spectrum of fluorescent light bulbs, deserves fur- ther research.
Materials and methods Plant material
Eleven barley cultivars were included in this study (Table 1). Kold, Price, WA1614–95, Haruna Nijo, Eight-Twelve, Scio and Dicktoo were part of the US CAP project, and were kindly provided by Professor Patrick Hayes (OSU, USA) [41, 42]. Ragusa is a Croatian landrace that was
obtained from the CGN Wageningen, The Netherlands.
Esterel is a French cultivar from Secobra. SBCC016 and SBCC046 are two Spanish landrace-derived inbred lines from the SBCC [43]. All cultivars were multiplied in isola- tion at the MTA-ATK, collected from bagged spikes, from original seed provided by OSU or the group at EEAD- CSIC. The varieties have different allelic constitution in the major flowering time genes, related to vernalization and photoperiod pathways (HvVRN1, HvVRN2, HvFT1, PPD-H1, HvFT3), as described in Table 1. Plants were fully vernalized (5 ± 2 °C for 52 days under 8 h light/16 h night) prior to the start of the experiment. Then, plants were moved to independent growth chambers with differ- ent light bulbs, fluorescent or metal halide. All of them were established under long day photoperiod conditions (16 h light/8 h night), constant temperature of 18 ± 1 °C during day and night, and the same light intensity (~
250μmol m−2s−1).
Light spectral conditions
The experiments were carried out in the Phytotron facil- ities of the Agricultural Research Institute of the Hun- garian Academy of Sciences, at Martonvásár (Hungary) using Conviron PGR-15 growth chambers (Conviron Ltd., Canada).
Two broad-spectrum lamp types with major differ- ences within the photosynthetically active region (PAR, 400–700 nm) were used: Sylvania cool white fluorescent (F) and Tungsram HGL-400 metal halide (M) light bulbs. Absolute photon irradiance was obtained with a USB400-UV-VIS Spectrometer (Ocean Optics, USA), measuring PAR at the top of the plant canopy. Spectral data were based on 0.21 nm intervals from 350 to 873 nm, calculated as spectral photon distribution and the summation over the interval as photon flux [44]. Spec- tral energy distribution of light, in both light sources, was studied in the 400–850 nm wavelength region (Fig- ure S1A). The ratios between the photon flux densities at different wavelengths are given in Figure S1B (follow- ing Mortensen and Stromme [45]). Blue region (B) in the range 400–500 nm; green-yellow (GY), 500–600 nm;
red (R), 600–700 nm; far-red (FR), 700–800 nm. Major differences within the PAR region are due to green- yellow-red ratio (GY:R) and red-far-red ratio (R:FR) (Fig- ure S1).
Comparison between light quality treatments
The study consisted in two control treatments and two shift treatments, grown in two growth chambers, each equipped with a different lighting type. The shift treat- ments were carried out first and, when these were fin- ished, the two control treatments were performed. For the control treatments, the plants were kept at the same growth chamber (M or F) for the full duration of the
experiment. For the shift treatments, plants were moved to one of the chambers after vernalization and, 10 days later, the entire sets of plants were interchanged (M plants moved to F chamber and vice versa). The shift treatments are coded as MF and FM. For phenotypic measurements, sixteen plants per genotype were sown in individual pots, and four were placed at each growth chamber, making four replicates per genotype and treat- ment. Additionally, 20 seeds per genotype and treatment were sown in groups of 5 plants/pot, which were used for destructive samplings to record apex development stage and for gene expression studies.
Phenotypic measurements
Plant development was monitored twice a week by counting leaf and tiller number, measuring plant height, and checking for first node appearance (plant develop- mental stage 31, or DEV31) and appearance of the awns just visible above the last leaf sheath (DEV49). All these data were used to dissect the development in pheno- phases, defined based on stages of the Zadoks’scale [46], following the description of Tottman et al. [47]. Dynam- ics of development was measured following Kiss et al.
[48]. DEV30 denotes the start of the elongation phase, and DEV37 and DEV39 are the days to the appearance and full elongation of the flag leaf, respectively. Another calculated trait was the time to reach the 50% of the plant height (PH50).
In control conditions, apex dissection was carried out 8, 23, 31, 37 and 45 days after the end of the vernalization period. In the shift conditions, apex dissec- tion was carried out 20, 30 and 41 days after the vernalization period. At each sampling point, 3 plants per variety and treatment were dissected. Phenotyping consisted on recording apex length (mm) and apex stage following the Waddington’s scale [49]. For gene expres- sion analysis, the last fully expanded leaf was collected in the middle of the light cycle at each particular treatment, 20 days after the end of the vernalization period, in three plants per genotype and sampling.
The plants were grown to full maturity and the follow- ing yield components were evaluated: number of nodes in the main stem, length of the last internode in the main stem (cm), spike length in the main stem (cm), number of spikelets per spike in the main stem, number of fertile tillers (reproductive tillers), number of seeds in the main stem, individual seed weight in the main stem (g), total number of seeds per plant, and total seed weight in the whole plant (g).
Gene expression
Total RNA was isolated from leaf tissue with TRIzol Reagent (Thermo Fisher Scientific, Ltd) followed by the Qiagen RNeasy Plant Mini kit, in accordance with
the manufacturer instructions (Qiagen, Ltd.). Then, the material was extracted in the QIAcube equipment (Qiagen Ltd). One microgram of total RNA was used for cDNA synthesis using the Revert Aid First Strand cDNA synthesis kit (Thermo Fisher Scientific, Ltd) with the standard protocol provided by the company.
The quantitative real time PCR was carried out in three biological and two technical replicates in a Rotor-Gene Q equipment (Qiagen Ltd) with SYBR- Green Master Mix. Primer sequences of the genes evaluated are described in Table S5. Expression was normalized to Actin using the Rotor-Gene software, also accounting for the amplification efficiency.
Statistical analysis
Data from 11 varieties growing in four different treat- ments (MF, FM, M, F) were used in the analyses, tak- ing into account the average of 3–4 biological replicates. In the representation of the dynamics of the apex stages, 95% confidence interval was calcu- lated using a local polynomial regression model. All the analyses were carried out in R [50]. Analysis of variance were performed considering all the factors (genotypes and treatments) as fixed, and replicates nested within treatments. When comparing groups of genotypes, contrasts were calculated within the factor genotype and in its interaction with treatment. To test their significance, we calculated the ratio of the mean squares of each contrast to the mean squares corresponding to the pooled within genotype variance not explained by each contrast. Multiple comparisons were obtained by Fisher’s protected Least Significant Differences (LSD) with the R package ‘agricolae’ [51].
Pearson correlations were obtained using the package
‘corrplot’ [52]. Principal component analysis (PCA) was performed with the R function ‘prcomp’ using the singular value decomposition, and based on the correlation matrix. Biplot was carried out with the package ‘ggplot2’ [53]. To assess the phenotypic diver- sity through a cluster analysis, all variables in com- mon in all the treatments were taken into account, and highly related variables were discarded. Finally, 17 phenotypic traits were used to carry out the clus- ter analysis (Table S4). Cluster analysis (UPGMA) was done with the package “factoextra” [54]. The best grouping result was chosen as the one with the high- est cophenetic correlation and the lowest Gower distance.
Supplementary information
Supplementary informationaccompanies this paper athttps://doi.org/10.
1186/s12870-020-02416-1.
Additional file 1.Supplementary data
Abbreviations
B:Blue region; DEV: Developmental stage; F: Fluorescent; FM: Shift from fluorescent to metal halide conditions; FR: Far-red region; GY: Green-yellow region; M: Metal halide; MF: Shift from metal halide to fluorescent conditions;
PAR: Photosynthetically active region; R: Red region
Acknowledgements
The authors thank Dr. Judit Komáromi for her technical support in RNA processing and to the Phytotron technicians for their assistance in the apex sampling and dissection.
Authors’contributions
AC, EI and IK conceived the experiments. AM, TK, MM and IK conducted the experiments. AM, AC and EI analysed and interpreted the data. AM drafted the manuscript. AC, EI and IK carried out thorough revisions of the manuscript. The authors read and approved the final manuscript.
Funding
Study financially supported by the Spanish Ministry of Economy, Industry and Competitiveness (Projects AGL2013–48756-R, including a scholarship granted to AM (BES-2014-069266), and AGL2016–80967-R). We acknowledge support of the publication fee by the CSIC Open Access Publication Support Initiative through its Unit of Information Resources for Research (URICI). The funding body did not play any role in the design of the study, collection, analysis, interpretation of the data or in writing the manuscript.
Availability of data and materials
The datasets used and/or analysed during the current study available from the corresponding author on reasonable request.
Ethics approval and consent to participate Not applicable.
Consent for publication Not applicable.
Competing interests
The authors declare that they have no competing interests.
Author details
1Aula Dei Experimental Station (EEAD-CSIC), Avda. Montañana 1005, E-50059 Zaragoza, Spain.2Centre for Agriculture Research (ATK), Martonvásár H-2462, Hungary.
Received: 19 November 2019 Accepted: 29 April 2020
References
1. Ugarte CC, Trupkin SA, Ghiglione H, Slafer G, Casal JJ. Low red/far-red ratios delay spike and stem growth in wheat. J Exp Bot. 2010;61:3151–62.
2. Franklin KA. Light and temperature signal crosstalk in plant development.
Curr Opin Plant Biol. 2009;12:63–8.
3. Monostori I, Heilmann M, Kocsy G, Rakszegi M, Ahres M, Altenbach SB, et al.
LED lighting–modification of growth, metabolism, yield and flour composition in wheat by spectral quality and intensity. Front Plant Sci.
2018;9:605.
4. Casal JJ, Qüesta JI. Light and temperature cues : multitasking receptors and transcriptional integrators. New Phytol. 2018;217:1029–34.
5. Holmes MG, Smith H. The function of phytochrome in the natural environment - I. characterization of daylight for studies in
photomorphogenesis and photoperiodism. Photochem Photobiol. 1977;25:
533–8.
6. Morgan DC, Smith H. Non-photosynthetic responses to light quality. In:
Lange OL, Nobel PS, Osmond CB, Ziegler H, editors. Physiological plant ecology I. encyclopedia of plant physiology (new series), vol 12/a. Berlin, Heidelberg: Springer; 1981. p. 109–34.
7. Holmes MG, Smith H. The function of phytochrome in the natural environment - II. The influence of vegetation canopies on the spectral energy distribution of natural daylight. Photochem Photobiol. 1977;25:539–45.
8. Kami C, Lorrain S, Hornitschek P, Fankhauser C. Light-regulated plant growth and development. Curr Top Dev Biol. 2010;91:29–66.
9. Turner A, Beales J, Faure S, Dunford RP, Laurie DA. The pseudo-response regulatorPpd-H1provides adaptation to photoperiod in barley. Science.
2005;310:1031–4.
10. Faure S, Higgins J, Turner A, Laurie DA. TheFLOWERING LOCUS T-like gene family in barley (Hordeum vulgare). Genetics. 2007;176:599–609.
11. Watson A, Ghosh S, Williams MJ, Cuddy WS, Simmonds J, Rey M, et al.
Speed breeding is a powerful tool to accelerate crop research and breeding. Nat Plants. 2018;4:23–9.
12. De Wit M, Keuskamp DH, Bongers FJ, MartıC, Fankhauser C, Pierik R, et al.
Integration of phytochrome and cryptochrome signals determines plant growth during competition for light. Curr Biol. 2016;26:3320–6.
13. Demarsy E, Goldschmidt-clermont M, Ulm R. Coping with‘dark sides of the sun’through photoreceptor signaling. Trends Plant Sci. 2017;23:260–71.
14. Fiorucci A-S, Fankhauser C. Plant strategies for enhancing access to sunlight.
Curr Biol. 2017;27:931–40.
15. Gómez C, Izzo LG. Increasing efficiency of crop production with LEDs. AIMS Agric Food. 2018;3:135–53.
16. Hemming MN, Fieg S, James Peacock W, Dennis ES, Trevaskis B. Regions associated with repression of the barley (Hordeum vulgare)VERNALIZATION1gene are not required for cold induction. Mol Genet Genomics. 2009;282:107–17.
17. Karsai I, Szucs P, Mészáros K, Filichkina T, Hayes PM, Skinner JS, et al. The Vrn-H2locus is a major determinant of flowering time in a facultative x winter growth habit barley (Hordeum vulgareL.) mapping population. Theor Appl Genet. 2005;110:1458–66.
18. Yan L, Fu D, Li C, Blechl A, Tranquilli G, Bonafede M, et al. The wheat and barley vernalization gene VRN3 is an orthologue of FT. Proc Natl Acad Sci U S A. 2006;103:19581–6.
19. Halliday KJ, Salter MG, Thingnaes E, Whitelam GC. Phytochrome control of flowering is temperature sensitive and correlates with expression of the floral integrator FT. Plant J. 2003;33:875–85.
20. Franklin KA, Whitelam GC. Phytochromes and shade-avoidance responses in plants. Ann Bot. 2005;96:169–75.
21. Casal JJ. Photoreceptor signaling networks in plant responses to shade.
Annu Rev Plant Biol. 2013;64:403–27.
22. Ballaré CL, Pierik R. The shade-avoidance syndrome: multiple signals and ecological consequences. Plant Cell Environ. 2017;40:2530–43.
23. Smith H, Whitelam GC. The shade avoidance syndrome: multiple responses mediated by multiple phytochromes. Plant Cell Environ. 1997;20:840–4.
24. Folta KM, Maruhnich SA. Green light: a signal to slow down or stop. J Exp Bot. 2007;58:3099–111.
25. Kegge W, Ninkovic V, Glinwood R, Welschen RAM, Voesenek LACJ, Pierik R.
Red: far-red light conditions affect the emission of volatile organic compounds from barley (Hordeum vulgare), leading to altered biomass allocation in neighbouring plants. Ann Bot. 2015;115:961–70.
26. Kebrom TH, Brutnell TP. The molecular analysis of the shade avoidance syndrome in the grasses has begun. J Exp Bot. 2007;58:3079–89.
27. Banerjee R, Schleicher E, Meier S, Viana RM, Pokorny R, Ahmad M, et al. The signaling state of Arabidopsis Cryptochrome 2 contains flavin semiquinone.
J Biol Chem. 2007;282:14916–22.
28. Kasajima S, Inoue N, Mahmud R, Fujita K, Kato M. Effect of light quality on developmental rate of wheat under continuous light at a constant temperature. Plant Prod Sci. 2007;10:286–91.
29. Song YH, Kubota A, Kwon MS, Covington MF, Lee N, Taagen ER, et al.
Molecular basis of flowering under natural long-day conditions in Arabidopsis. Nat Plants. 2018;4:824–35.
30. Trevaskis B, Hemming MN, Peacock WJ, Dennis ES.HvVRN2responds to daylength, whereasHvVRN1is regulated by vernalization and developmental status. Plant Physiol. 2006;140:1397–405.
31. Casao MC, Karsai I, Igartua E, Gracia MP, Veisz O, Casas AM. Adaptation of barley to mild winters: a role for PPDH2. BMC Plant Biol. 2011;11:164.
32. Monteagudo A, Igartua E, Contreras-moreira B, Gracia MP, Ramos J, Karsai I, et al. Fine-tuning of the flowering time control in winter barley: the importance ofHvOS2andHvVRN2in non-inductive conditions. BMC Plant Biol. 2019;19:113.
33. Mulki MA, Bi X, von Korff M. FLOWERING LOCUS T3 controls spikelet initiation but not floral development. Plant Physiol. 2018;178:1170–86.
34. Gierczik K, Novák A, Ahres M, Székely A, Soltész A, Boldizsár Á, et al.
Circadian and light regulated expression of CBFs and their upstream signalling genes in barley. Int J Mol Sci. 2017;18:1828.
35. Pearce S, Kippes N, Chen A, Debernardi JM, Dubcovsky J. RNA-seq studies using wheatPHYTOCHROME BandPHYTOCHROME Cmutants reveal shared
and specific functions in the regulation of flowering and shade-avoidance pathways. BMC Plant Biol. 2016;16:141.
36. Nishida H, Ishihara D, Ishii M, Kaneko T, Kawahigashi H, Akashi Y, et al.
Phytochrome Cis a key factor controlling long-day flowering in barley. Plant Physiol. 2013;163:804–14.
37. Pankin A, Campoli C, Dong X, Kilian B, Sharma R, Himmelbach A, et al.
Mapping-by-sequencing identifiesHvPHYTOCHROME Cas a candidate gene for theearly maturity 5locus modulating the circadian clock and photoperiodic flowering in barley. Genetics. 2014;198:383–96.
38. Smith H. Light quality, photoperiod, and plant strategy. Annu Rev Plant Physiol. 1982;33:481–518.
39. Merotto A Jr, Fischer A, Vidal R. Perspectives for using light quality as an advanced ecophysiological weed management tool. Planta Daninha. 2009;
27:407–19.
40. Maloof JN, Borevitz JO, Dabi T, Lutes J, Nehring RB, Redfern JL, et al. Natural variation in light sensitivity of Arabidopsis. Nature. 2001;29:441–6.
41. Karsai I, Mészáros K, Láng L, Hayes PM, BedőZ. Multivariate analysis of traits determining adaptation in cultivated barley. Plant Breed. 2001;120:217–22.
42. Karsai I, Igartua E, Casas AM, Kiss T, Soós V, Balla K, et al. Developmental patterns of a large set of barley (Hordeum vulgare) cultivars in response to ambient temperature. Ann Appl Biol. 2013;162:309–23.
43. Igartua E, Gracia MP, Lasa JM, Medina B, Molina-Cano JL, Montoya JL, et al.
The Spanish barley core collection. Genet Resour Crop Evol. 1998;45:475–81.
44. Sager JC, Smith WO, Edwards JL, Cyr KL. Photosynthetic efficiency and phytochrome photoequilibria determination using spectral data. Trans ASAE. 1988;31:1882–9.
45. Mortensen LM, Stromme E. Effect of light quality on some greenhouse crops. Sci Hortic. 1987;33:27–36.
46. Zadoks JC, Chang TT, Konzak CF. A decimal code for the growth stages of cereals. Weed Res. 1974;14:415–21.
47. Tottman DR, Makepeace RJ, Broad H. An explanation of the decimal code for the growth stages of cereals, with illustrations. Ann Appl Biol. 1979;93:
221–34.
48. Kiss T, Balla K, Veisz O, Karsai I. Elaboration of a non-destructive
methodology for establishing plant developmental patterns in cereals. Acta Agron Hungarica. 2011;59:293–301.
49. Waddington SR, Cartwright PM, Wall PC. A quantitative scale of spike initial and pistil development in barley and wheat. Ann Bot. 1983;51:119–30.
50. R Core Team. R: a langauge and environment for statistical computing;
2017.https://www.r-project.org/. Accessed 06 Nov 2019.
51. de Mendiburu F. Agricolae: statistical procedures for agricultural research;
2016.https://cran.r-project.org/package=agricolae. Accessed 06 Nov 2019.
52. Wei T, Simko V. R package“corrplot”: visualization of a correlation matrix;
2017.https://github.com/taiyun/corrplot. Accessed 06 Nov 2019.
53. Wickham H. ggplot2: elegant graphics for data analysis; 2009. doi:978–0– 387-98140-6.
54. Kassambara A, Mundt F. Factoextra: extract and visualize the results of multivariate data analyses; 2017.https://rpkgs.datanovia.com/factoextra/
index.html. Accessed 06 Nov 2019.
Publisher’s Note
Springer Nature remains neutral with regard to jurisdictional claims in published maps and institutional affiliations.