Moroccan Journal of Chemistry ISSN: 2351-812X
http://revues.imist.ma/?journal=morjchem&page=login shaban& al. / Mor. J. Chem. 8 N°3 (2020) 700-717
Mor. J. Chem. 8 N°3 (2020) 700-717
700
Electrochemical and surface analytical characterization study of the inhibition effect of boiled red onion extract on tin corrosion in 0.2 M Maleic acid medium.
Brahim Ait Addi
a, Salma Mouaamoun
a, Abdelaziz Ait Addi
a, Abdul Shaban
b*, El-Habib Ait Addi
c, Mohamed Hamdani
aa Team of Physical Chemistry and Environment, Faculty of Science, Ibn Zohr University, Agadir, Morocco.
b Institute of Materials and Environmental Chemistry, Research Centre for Natural Sciences, Hungarian Academy of Sciences, Bp., Hungary.
c Research Group: Process and Chemical Engineering, Agadir School of Technology, Ibn Zohr University, Agadir, Morocco.
* Corresponding author:
shaban.abdul@ttk.mta.hu Received 17 Sept 2019, Revised 09 Feb 2020, Accepted 03 May 2020
Abstract
The effect of two different forms of red onion extracts (boiled red onion skin extracts (BROE) and filtered red onion juice (FROJ) on the corrosion and the passivation of the tin corrosion in 0.2 M Malic acid were compared which showed that BROE method is more effective. The inhibition efficiency of BROE against tin corrosion in 0.2 M Maleic acid was studied using electrochemical and surface analytical methods. The electrochemical polarization curves displayed the active/passive transition of the anodic behavior of the tin electrode. The electrochemical impedance measurements demonstrated the effect of increasing BORE concentration on the inhibition efficiency (η %) (to a ηmax = 94% at 300 mg/L of BORE). In general, the inhibition efficiency (i.e.
surface coverage) increased with BORE concentration and the adsorption mechanism fitted the Langmuir adsorption isotherm model. The effect of temperature on the corrosion of tin in 0.2 M Maleic acid without and with certain concentration of BROE was studied in the temperature range of 293-333 K. Studying the effect of temperature on the inhibition efficiency showed a decline in η values as the temperature was increased. The results of EDS and SEM presented that BROE possess a capability to protect tin surface in 0.2 M Maleic acid. We found satisfactory agreement between electrochemical and surface analytical measurements. Good correlation between the major effective constituents of the extract and the inhibition mechanism was obtained.
Keywords: Tin corrosion, inhibition, Onion extract, EIS, Inhibition.
Mor. J. Chem. 8 N°3 (2020) 700-717
701
1. Introduction
Tin (Sn) has conventionally been used in many food-grade applications even though such applications these days progressively use low-priced resources such as stainless steel and polymers. Some pharmaceutical and food products are packed in tin collapsible tubes and tinfoil wrappers are used on cork wads for jar and bottle closures. For a pH range (3 < pH < 10), Sn displays passivation characteristics that arise from the ability to form a compact and insulating layer (both ionic and electronic). In other words, Sn transitions from an immunity to a passivity region; it is therefore almost completely corrosion resistant across this pH range, unless at very high voltages [1]. In contact with many organic acids, such as (citric, oxalic, malic), Sn forms complex ions which is significant property on the tin galvanic behavior. In other words, the standard electrode potential of Sn is - 136 mV, but the reduction of stannous ion activity consequential from the formation of complexes may dampen the corrosion potential to make Sn anodic to iron [2].
Several studies investigate the behavior and the effect of adding inhibitors on the corrosion of Sr in an acidic environment [3,4]. The presence either CrO42-, MoO42- or NO2- ions in the acid solution inhibits the anodic dissolution of tin and enhances the attainment of passivity. Most synthetic compounds have an anticorrosive effect, on the other hand, their toxicity to both lives and the environment is undesirable. To prevent or minimize these toxic effects, more attention has been devoted to the use of plant extracts as potential corrosion inhibitors [5]. The corrosion inhibition capability of these natural products varies significantly according to the part of the plant extracted, the chemical composition of these extracts and the application approach [6-9]. However, an effective compound for a given metal in one medium may be ineffective for the same metal in another medium [10]. In recent years, applications of green inhibitors such as onion extracts have been highly developed using different extraction methods. It is known to contain many phytochemicals such as carotenoids, copaenes, flavonoids, minerals, phenolics, phytoestrogens, terpenoids, vitamins, anthocyanins, and amino acids. Flavonoids are widely distributed in nature and exhibit beneficial traits such as anti-inflammatory, anti-cancer and antioxidant activities [11-13]. Quercetin, one of the most abundant natural flavonoids, is present in various vegetables and fruits, and its average human daily intake is estimated to be 16-25 mg/person. The antioxidant properties of this compound have been attributed to its capacity to scavenge free radicals generated in an aqueous phase, increasing the resistance of lipids against peroxidation [14]. Quercetin is known to complex with various metal cations to form stable compounds, which have demonstrable anti-inflammatory and anti- cancer activity [15-17]. Furthermore, according to several authors, this molecule is responsible for the inhibitory nature of this plant owing to the presence of oxygen atoms which improve the adsorption effect of Quercetin on the metal surface, thus isolating the metal from the aggressive species involved in the corrosion process [18-20]. The objective of this study is to investigate the inhibitive effect of boiled red onion extract (BROE) as a corrosion inhibitor of tin in a 0.2 M Maleic acid solution. The assessment of the corrosion behavior will be studied using electrochemical measurements (dc potentiodynamic polarization and ac electrochemical impedance spectroscopy (EIS)) and surface analytical methods (scanning electron microscope (SEM)). The adsorption isotherms and Arrhenius plots are to be used to obtain thermodynamic data.
2. Materials and Methods
The investigated potential inhibitor is the BROE. The preparation is initiated by desiccation and drying the red onion at room temperature. The powder obtained after grinding is divided into three batches of different quantities (10, 15, and 20 g). Each batch is boiled in 1 L of bidistilled water for 1 hr (CBROE) The obtained extracts are filtered and the collected filtrates are preserved from light in jars hermetically sealed to prevent degradation before use. For comparison reason, a measurement was done on filtered red onion juice (FROJ) and a tin corrosion inhibitor and compared to the effect from applying BROE.
Mor. J. Chem. 8 N°3 (2020) 700-717
702 Electrochemical measurements were performed using a thermostatic double jacket glass cell in the conventional three- electrode configuration. The working electrode (WE) was made of pure tin rod (Aldrich 99.99%), axially embedded in Araldite epoxy resin holders limiting the exposed circular area to 0.785 cm2. A saturated calomel electrode (SCE) and a Pt sheet were used as the reference (RE) and counter electrodes (CE), respectively. All measured potentials are referred to the SCE. Before each experiment, the WE surface was mechanically polished with different grades of emery papers (down to 1200 grit size), degreased with acetone, and immediately rinsed with bidistilled water.
Potentiodynamic polarization measurements were carried out using a potentiostat/galvanostat (Radiometer analytical model PGZ 100) driven by VoltaLab software, at a scan rate of 60 mV/min. Before the polarization measurements, the WE was immersed in the 3-electrode cell for 30 min. while OCP was monitored. The morphology and composition of the tin surface were studied using scanning electron microscopy (SEM) JEOL JSM-5500 coupled with energy dispersive X-ray (EDX) JEOL- 5600. Experiments were performed in an aqueous solution of 0.2 M Maleic acid without and with the addition of inhibitive BROE. All aqueous solutions were prepared using bidistilled water and analytical reagent grade chemicals (p.a. Merck) and were deaerated by bubbling N2 through the cell unless otherwise specified. For reproducibility purpose experiments were performed in triplets. The temperature and pH of the medium were adjusted to 293 K and pH = 1.8, respectively.
3. Results and Discussion
3.1.1. Comparative study between BROE and FROJ.
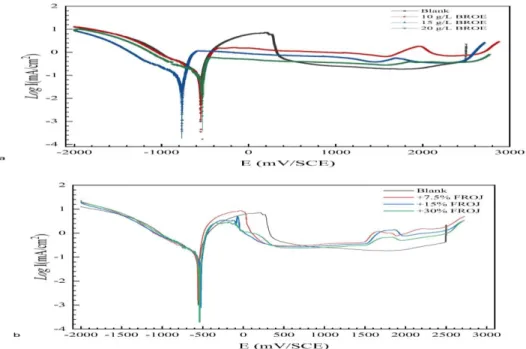
The comparative study of the effect of two different forms of red onion extracts (BROE and FROJ) on the corrosion and the passivation of tin in 0.2 M Malic acid revealed which method of extract preparation is effective. Figure 1 shows the polarization curves of tin in 0.2 M Maleic acid without and with the addition of two compounds derived from the red onion as previously mentioned: the BROE (Fig. 1-a) and FROJ (Fig. 1-b), respectively. By comparing the polarization curves, it is concluded that the cathodic branches, for all the studied media without and with the addition of these two compounds, are similar. Furthermore, the value of the corrosion potential (Ecorr) is not greatly shifted in the presence of these two compounds, compared to the blank. On the other hand, inspections of the anodic branch confirmed that BROE is a better inhibitor than FROJ, for this study.
Figure 1. Potentiodynamic polarization curves for Tin in 0.2 M Maleic acid containing different concentrations of BROE (a) and JFOR (b).
Mor. J. Chem. 8 N°3 (2020) 700-717
703 The addition of BROE has the effect of the disappearance of the activation peak and the displacement of pitting potential Epit towards more noble values, while the effect from the addition of FROJ was not significant. The important difference of the behavior and action of BROE and FROJ compounds against tin pitting corrosion.
Accordingly, further investigation is carried out to study the inhibition characteristics of BROE on tin corrosion in 0.2 M Maleic acid
3.2. Effect of BROE concentration 3.2.1. Evaluation of OCP measurements
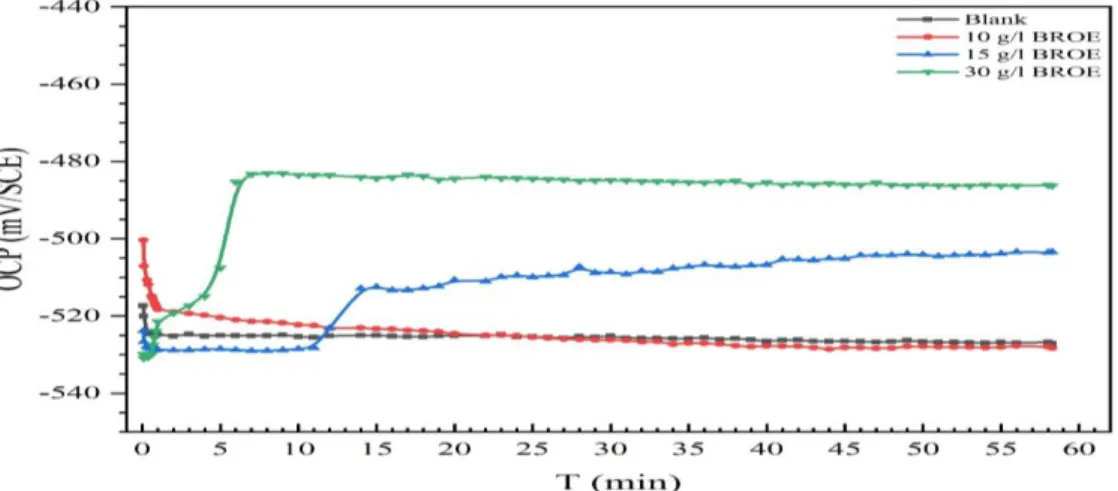
The OCP is applied to study the corrosion behavior of tin electrodes in 0.2 M malic acid electrolytes. The tests were carried out in the presence and absence of BROE to investigate the impact on tin corrosion. The OCP behavior before and after the pitting potential will be examined. Figure 2 exposes the alteration of EOCP of the tin electrode in the absence and presence of BROE for 60 min immersion at 293oK. The addition of BROE caused a positive potential shift in EOCP before stabilization, except for 10 g/L. Additionally, the EOCP tends to stabilize after 6 min. of immersion in the case of CBROE = 20 g/L, whereas in the case of CBROE = 15 g/L, the EOCP remains stable for 15 min. before recording a jump to positive values then continues to increase over time. This is due to the enhancement of tin resistance as a result of increasing CBROE.
Figure 2. Dependent of OCP values on time, experienced by the tin in 0.2 M Maleic acid without and with the addition of different inhibitor CBROE values.
3.2.2. Potentiodynamic polarization studies
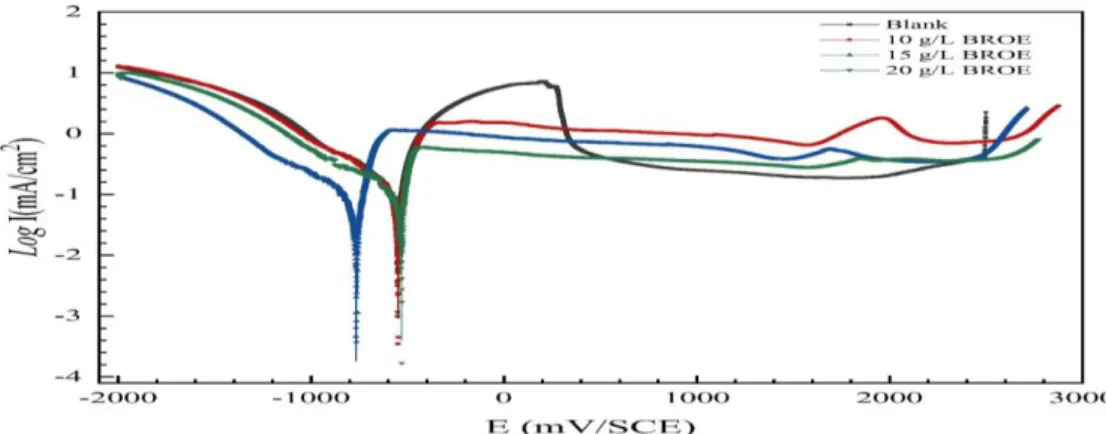
Potentiodynamic polarization experiments are run to obtain a qualitative understanding of the corrosion process. For corrosion rate determination, polarization resistance (Rp,dc) which is principally the slope of the polarization curve at Ecorr ± 10 mV vs. SCE, is used. Figure 3 displays the polarization curves of tin in 0.2 M Maleic acid solution with and without the addition of different CBROE at 293K. The polarization curves were obtained by scanning the potential of the electrode from -2 to 3 V at a scan rate of 60 mV/min. The significant electrochemical parameters derived from Fig. 3 are listed in Table 1. As presented in Fig. 3 and registered in Table 1, cathodic current-potential curves give rise to parallel Tafel lines indicating that the hydrogen evolution reaction is under activation controlled process. Nevertheless, the anodic behavior of tin in the presence of the extract is slightly modified. Increasing CBROE contributes to quasi disappearance of the anodic (tin dissolution) peak and hence elimination of the activation/passivation transition.
However, when a CBROE = 10 g/L was added, a lesser intense peak appeared at a potential (E = 1650 mV) which tends to disappear as CBROE increased. This phenomenon can be explained by a failure within the metal passive layer.
Mor. J. Chem. 8 N°3 (2020) 700-717
704 Figure 3. Potentiodynamic polarization curves for tin in 0.2 M Maleic acid-containing different CBROE values at 293K It appears also that the presence of the inhibitor slightly altered Epit toward more positive values as CBROE increased in solution. As offered in Table 1, the value of Epit varies from Epit,blank = 1951 mV to approximately Epit, BORE of 2630 mV for CBROE = 20 g/L. Referring to Table 1, even though the addition of the inhibitor doesn’t significantly alter Ecorr, a regular regression of corrosion current densities Icorr is observed. The corrosion inhibitory efficiency (η %) is defined as:
(1)
where Icorr and Icorr(inh) are the values of the corrosion current density without and with the addition of inhibitor, respectively. Results in Table 1 clearly state that the tin corrosion inhibition efficiency increases upon increasing CBROE, which suggests that the number of molecules adsorbed over the tin surface becomes significant, blocking the active sites on the surface thus protecting against metal corrosion. The best efficiency (η = 91%) is achieved by the addition of CBROE = 20 g/L. This result is validated by the established corrosion rate () values which shows a steady reduction with the enrichment of the solution by BORE. The obtained results are inconsistency with the outcome results by Ferry et al. [21] that studied the effect of Allium cepa extracts on mild steel in seawater; Ferreira et al. [18]
that investigated the effect of the aqueous brown onion skin extract on the corrosion process of carbon steel in 1 M HCl and Loto et al. [22] who tested the effect of allium cepa extract on the corrosion of mild steel in 0.5 M H2SO4.
Table 1. Polarization parameters and the corresponding η of tin corrosion in 0.2 M Maleic acid-containing different concentrations of inhibitor at 293K.
BROE
(g/L) Ecorr (mV)* Epit
(mV)*
Epiq-Ecorr (mV)*
Ipass (µA/cm²)
Icorr (µA/cm²)
- βc (mV/dec)
η
%
Blank -558 2501 3059 414 160 404 --
10 -547 2587 3134 895 61 395 62
15 -525 2609 3134 663 38 379 76
20 -523 2590 3113 360 14 327 91
* potential was measured vs. SCE.
3.2.3. EIS results
EIS is utilized to gain a more profound information into the electrochemical processes of corrosion inhibition. EIS results, performed at OCP, are typically represented by Nyquist and Bode coordinates plots. The internal impedance is often defined as the low-frequency turning point of the EIS plot. Fitting the Nyquist plot to a proposed equivalent
Mor. J. Chem. 8 N°3 (2020) 700-717
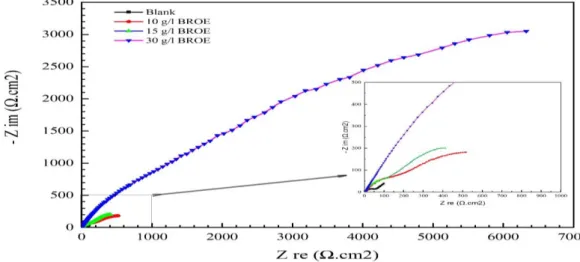
705 circuit model permits the physical understanding of the processes involved. Figures 4 and 5 display the Nyquist and Bode plots of the EIS measurements of tin in the absence and presence of different CBROE values, respectively.
Electrochemical data derived from EIS spectra associated to Figs. 4 and 5 are tabulated in Table 2. The obtained Nyquist plots, in Fig. 4, are not shaped like perfect semicircles, which is attributed to the frequency dispersion of the interfacial impedance, largely caused by the inhomogeneity of the electrode surface [23,24]. This inhomogeneity is possibly a consequence to roughness, impurities, dislocations, adsorption of the inhibitor and, formation of porous layers [25,26]. Furthermore, the analysis of the Nyquist plots, Fig. 4, indicate characterization by two well-separated time constants (τ) in the absence of the inhibitor: τ1, located at higher frequencies, attributed to the charge transfer associated with the corrosion enhancement, and τ2, at lower frequencies, attributed to passive film. On the other hand, in the presence of BROE, τ2 is reduced while τ1 is shifted towards the higher frequencies. Furthermore, the Nyquist diagram is composed of two poorly separated capacitive loops. The first, at high frequency, is associated with the resistance of the film formed on the electrode surface due to the adsorption of the inhibitor, while the second, at low frequency, is generally attributed to the double layer capacity and the charge transfer resistance. Another useful demonstration scheme of the EIS data is the Bode Plot. The impedance is plotted with log frequency on the X-axis and both the log of the absolute values of the impedance (log |Z|) and the phase-shift (ф) on the Y-axis. Unlike the Nyquist Plot, the Bode Plot does show frequency information. The corresponding Bode plot is presented in Fig. 5, shows the impedance modulus log |Z| vs log f (5-a) and phase shift (ф) vs log f (5-b). The existence of two-time constants can be verified by the log |Z| part of the impedance vs the log f plot. Figure 5a displays the variation of log |Z| as a function of frequency (f), shows an inflection point at 0.1 Hz. This inflection appears to point toward the presence of two-time constants, as was already shown by the Nyquist plot (Fig. 4). The high-frequency time constant can be related to a constant phase element (CPE) behavior.
Figure 4. Nyquist plot for Tin in 0.2 M Maleic acid with and without different concentrations of BROE.
The impedance of CPE is expressed as:
α (2)
where Q has units of F/s1-α.cm2 and α is the CPE exponent. These curves are quite separated for different concentrations, and show an apparent semi-linear behavior in the frequency range above 0.1 Hz and until 10 kHz. The slope of the linear section (α) corresponds to the exponent of the CPE.
Mor. J. Chem. 8 N°3 (2020) 700-717
706 Figure 5. Bodes plots for tin in 0.2 M Maleic acid with and without different CBROE values: log Z vs. Log f (a) and phase shift vs. log f (b).
From the obtained results listed in Table 2, it is obvious that increasing CBROE improved the values of η greatly (η (CBROE= 20 mg/L) = 93%). The values of Rs changed as a result of increasing the BROE concentration (from 7 to 145 Ω). There was a slight increase of the value of η between the CBROE of 15 and 20 mg/L, which shows that the inhibitor adsorbed on almost the entire surface. To further analyze the impedance spectra and study the inhibition mechanism, the interface between the tin/BROE/electrolyte in a 0.2 M Maleic acid solution in the absence and presence of 20 g/L of BROE, be represented by the classical equivalent circuit shown in Fig. 6. An excellent parametric fit of the experimental impedance spectra for all concentrations was obtained using this model. The experimental and simulated spectra are well correlated with a coefficient χ2 of the order of 10-4, thus making it possible to validate this model. The proposed model takes into account the presence of two-time constants at low and high-frequencies. Accordingly, the high-frequency time constant is attributed to the oxide film (Rc, nc and, Qc) and the low-frequency time constant is assigned to the charge transfer reaction (Rct, ndl, and Qdl). The values of electrochemical parameters associated with the EIS diagrams and the inhibition efficiency (η%) for different concentrations of BROE using the equivalent circuit are reported in Table 2. These values are determined by simulating the obtained experimental data against the proper electrical circuit using Z-view and ZSimpWin software. Observing the achieved parameters disclosed that the addition of BROE decreases the values of double-layer capacitance (Cdc) and increases the values of the charge transfer resistance (Rct). Additionally, the increase in Rct value is accredited to the formation of protective film on the metal/solution interface [27-30]. This layer is considered as an electrical capacitor, whose capacity decreases due to the displacement of the water molecules present in the electrolyte in favor of the organic molecules of the extract
Mor. J. Chem. 8 N°3 (2020) 700-717
707 adsorbed on the metal surface, forming a protective layer which reduces the number of active corrosion sites [31-33].
Table 2. EIS parameters of Tin corrosion in 0.2 M Maleic acid-containing different concentrations of BROE at 293K.
Cinh (g/L) Rs
(Ω·cm2) Qf
(Ω-1·cm-2·S-nc) nc
Rc
(Ω·cm2) Qdl
(Ω-1·cm-2·S-nr) ndl
Rct
(Ω·cm2) W
(Ω·cm2·S-1/2) η
%
0 7.4 - - - 8.37E-02 0.5 18.43 0.207 -
10 6.2 4.29E-04 0.63 160 3.77E-03 0.55 183 - 87
15 110.7 3.16E-04 0.63 195 2.078E-03 0.53 203 - 90
20 145 3.55E-06 0.65 725 9.180E-06 0.6 214 - 93
Figure 6. Scheme of the equivalent electrical circuit used to fit EIS data to the tin substrate. (a) In the blank 0.2 M Malic acid solution, (b) In the presence of 20 mg/L of BROE
3.3. Temperature effect results
Generally, the temperature signifies an aspect capable to alter both the metal behavior in a corrosive medium and the nature of the metal/inhibitor interaction by inducing disturbances on the formation of the inhibitive film. As a matter of fact, rising the temperature favors the inhibitor desorption as well as a rapid dissolution of the formed organic compounds or complexes, consequently causing a decrease of metal corrosion protection [34].
3.3.1. OCP measurements results
Variation of EOCP of Tin in 0.2 M Maleic acid solution in the presence of 20 g/L of BROE at different temperatures is shown in Fig. 7. The increase of temperature from 293 to 333K caused the EOCP to shift to more negative (cathodic) values. Additionally, the EOCP remains steady over time except for the temperature of 303K, where the potential reached steadiness only after the first 10 min.
Mor. J. Chem. 8 N°3 (2020) 700-717
708 Figure 7. Evolution of open circuit potential of Tin in 0.2 M Maleic acid in the presence of 20 g/L of BROE at different temperatures.
3.3.2. Potentiodynamic polarization studies
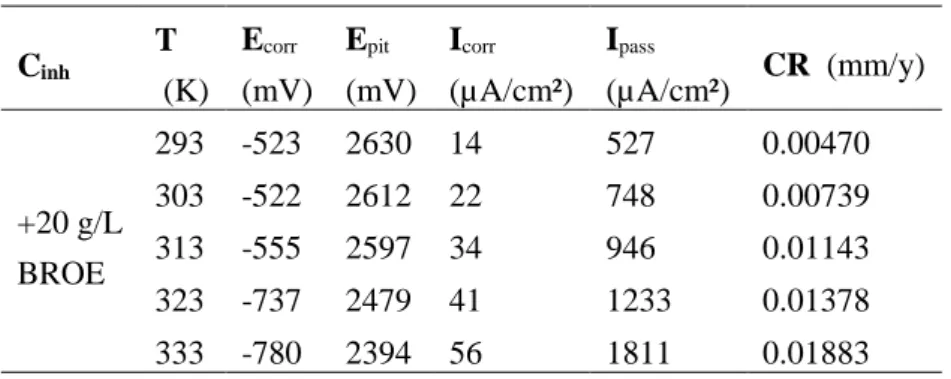
Temperature variations affect both electrochemical processes and adsorption kinetics. The effect of temperature on tin corrosion in 0.2 M Maleic acid solution in the presence of 20 g/L BROE was studied in the range 293-333K using the potentiodynamic technique as shown in Fig. 8. The corrosion kinetic parameters such as corrosion current density Icorr, corrosion potential Ecorr, anodic Tafel slope ba and cathodic Tafel slope bc, gathered from the curves are tabulated in Table 3. Note that the corrosion rate is calculated from the following relation (eq. 3):
CR(mm/y) = (3.16 . Icorr . M) / (z. F. ρ) (3)
Where Icorr is the corrosion current density (A/cm2), M is the molecular weight of the metal (g/mol), z is the number of electrons transferred, F is Faraday’s constant and ρ is the metal density (g/cm3).
Figure 8. Polarization curves for Tin in 0.2 M Maleic acid solution-containing 20 g/L of BROE at different temperatures.
As can be seen, that raising the temperature increases both anodic and cathodic reactions of the tin electrode. Data listed in Table 3 shows that rising the temperature causes an increase in Icorr, a decrease in the polarization resistance (an increase in corrosion rate), and displacement of Ecorr to negative values, i.e. decreasing the inhibition efficiency and the effectiveness of the extract. This behavior shows once again the physical nature of adsorption of BROE on the metal surface in a 0.2 M maleic acid solution. On the other hand, the anodic region of the polarization curve is
Mor. J. Chem. 8 N°3 (2020) 700-717
709 characterized by the appearance of the dissolution peak and also by the displacement of Epit towards more active values, thus showing a tendency to dissolution and the formation of pits on the tin surface with the temperature increase. This failure may be due to the dissolution of tin which predominates the adsorption of the inhibitory molecules on the metal surface having previously blocked the active sites against attacks by the acid. The effect of temperature on the inhibited acid-metal reaction is very complex mechanism because many changes can occur on the metal surface such as desorption of the inhibitor and/or the decomposition of the inhibitor itself [35].
Table 3. Polarization parameters and the corresponding corrosion rate for tin in 0.2 M Maleic acid-solution containing 20 g/l of BROE at different temperatures.
Cinh
T (K)
Ecorr
(mV) Epit
(mV) Icorr
(µA/cm²) Ipass
(µA/cm²) CR (mm/y)
+20 g/L BROE
293 -523 2630 14 527 0.00470
303 -522 2612 22 748 0.00739
313 -555 2597 34 946 0.01143
323 -737 2479 41 1233 0.01378
333 -780 2394 56 1811 0.01883
3.4. Thermodynamic parameters
To obtain more information on the process of corrosion inhibition, the activation energy Ea using the Arrhenius law is calculated according to the relation (eq. 4) and the transition state (eq. 5) [36,37]:
(4)
where Ea is the apparent activation corrosion energy, T is the absolute temperature (k), K is the Arrhenius pre- exponential constant, and R is the universal gas constant.
Icor = (5)
where h is Planck’s constant, N is Avogadro’s number, ΔHa is the entropy of activation and ΔSa is the enthalpy of activation. The variation of the logarithm of the corrosion current density versus the inverse of the absolute temperature is shown in Fig. 9. As shown, the plot is linear, with correlation coefficient R2 = 0.983, and respects the Arrhenius law for both without and with inhibitor, which allowed us to calculate the energies of activation Ea and E'a
from the estimation of the slopes of the two straight lines. Analyses of Ea values obtained from these plots, given in Table 4, indicate that the energy of activation in the presence of inhibitors is higher than that in the absence. The higher activation energy may be interpreted as physical adsorption at the metal surface that occurs in the first stage [38]. Similar results obtained for other inhibitor molecules have been reported elsewhere [39,40]. Other kinetic data like enthalpy (∆Ha) and entropy of adsorption (∆Sa) are accessible using the alternative formulation of Arrhenius equation:
(6)
Where 𝐼corr is the corrosion current density, 𝐾 the Arrhenius preexponential constant, ℎ is the Plank’s constant, 𝑁 is the Avogadro’s number, the enthalpy of activation (Δ𝐻𝑎), and the entropy of activation (Δ𝑆𝑎). Figure 10 shows a plot of Log (Icorr/T) vs 1/T. Straight lines are obtained with a slope of ∆Ha/R and an interception with the y-axis of ln R/Nh + ∆Sa/R from which the values of ∆Sa and ∆Ha are calculated and are given in Table 4. According to Tazouti, the
Mor. J. Chem. 8 N°3 (2020) 700-717
710 positive sign of the enthalpy reflects the endothermic nature while the negative signs of ΔHa values reflect the exothermic nature of the carbon steel dissolution [41]
Figure 9. Arrhenius plots of corrosion Log Icorr vs. 1/T of 0.2 M Maleic acid without and with the addition of BROE.
.
Figure 10. Variation of Log (Icorr/T) as a function of the inverse of the temperature in the absence and the presence of BROE.
According to Tazouti, the positive sign of the enthalpy reflects the endothermic nature while the negative signs of ΔHa
values reflect the exothermic nature of the carbon steel dissolution [41]. Here the calculated value of ΔH° for dissolution reaction of Tin in 0.2 M Maleic acid in the presence of BROE is higher than that in blank solution. The positive signs reflect the endothermic nature of the tin dissolution process. The same result is obtained by L. Saqalli et al. [39] in their study of the ability of Purpurin and Quinizarin as organic compounds to inhibit the corrosion of carbon steel in HCl solution. All values of Ea are higher than the values of ΔHa , this observation indicates that the corrosion process controlled by the gaseous reaction, simply the hydrogen evolution reaction, associated with a decrease in the total reaction volume [42]. Furthermore, the increase of ΔHa values in the presence of inhibitor can be interpreted as the reduction of tin dissolution [43]. The ΔS° values are negative in the tow case (the uninhibited and inhibited
Mor. J. Chem. 8 N°3 (2020) 700-717
711 solutions) which can imply a decrease of the disorder during the formation of the complex metal/adsorbed molecules [44-48]. The increase of ΔS° value indicates an increase of the disorder this can be generally interpreted by the conversion of the reactants to the activated complexes which take place at the interface metallic surface/solution [49].
Table 4. The values of △Ha and ΔSa for tin in 0.2 M Maleic acid in the absence and presence of BROE.
Cinh
(g/L) Ea (kJ/mole)
ΔHa (KJ/mole)
ΔSa
(J/mole)
0 3.19 0.612 159.43
20 27.64 25.06 156.10
3.5. Adsorption isotherms
Adsorption isotherms are an important complement to determining the electrochemical mechanism that leads to the adsorption of these organic compounds to the surface [50]. Several adsorption isotherms can be used to evaluate the adsorption behavior of inhibitors: Langmuir (eq. 7), Frumkin (eq. 8) and Temkin (eq. 9); i.e. the coverage rate of the metal surface is related to the concentration of the inhibitor by the relationships:
Langmuir adsorption model: (7)
Frumkin adsorption model: (8)
Temkin adsorption model: exp(-2aθ) = Kads × Cinh (9)
where Kads is the adsorption coefficient, Cinh the concentration of the inhibitor in the solution and has an interaction constant between adsorbed particles.
The coverage rate θ for different BROE concentrations is determined using eq. 10 [51]:
(10)
where Icorr and Icorr(inh) are the corrosion current densities without and with the addition of the inhibitor, determined by Tafel cathode lines extrapolation to the corrosion potential. The plots of the Langmuir, Frumkin, and Temkin adsorption models are shown in Figs. 11, 12, and 13, respectively.
Inspecting these Figures indicates that the variation of C/θ as a function of Cinh is linear for all concentrations at 293K.
This indicates that the adsorption of the inhibitor on the tin surface in 0.2 M of Malic acid obeys the Langmuir adsorption isotherm and the correlation coefficient, R2 ≈ 1 confirms the validity of the model selected.
This same result is supported by those obtained by certain authors. Indeed, Nnaji et al. have shown, using FTIR and spectrophotometric methods, that the adsorption of Quercetin on the surface of aluminum in a solution of hydrochloric acid follows the Langmuir isotherm [52]. Noor and coworkers found out that using gravimetric and SEM methods, the corrosion inhibitory efficiency of steel in 0.75 M H3PO4 grows with increasing the concentration of red onion extract and follow the Langmuir isotherm behavior [53].
Mor. J. Chem. 8 N°3 (2020) 700-717
712 Figure 11. Langmuir adsorption plots for Tin in 0.2 M Maleic acid-containing different concentrations of BROE.
Figure 12. Frumkin adsorption plots for Tin in 0.2 M Maleic acid-containing different concentrations of BROE.
Figure 13. Temkin adsorption plots for tin in 0.2 M Maleic acid-containing different concentrations of BROE.
The value of the adsorption coefficient (Kads) deduced from the equation of the line allows us to access the value of the free standard energy of adsorption (ΔG°ads) from the equation of Van't Hoff [54]:
Mor. J. Chem. 8 N°3 (2020) 700-717
713
(11)
where R is the gas constant (J.mol-1. K-1), T is the temperature (k) and the constant 55.5 is the water concentration in solution (mol. L-1).
The adsorption process equilibrium constant (Kads), calculated from the intersection of the straight line, is Kads = 1.773, which leads to ΔG°ads = -11.17 kJ/mol at the temperature of 293K. It is worth noting that when the values of ΔG°ads ≈ - 20 kJ/mol corresponds to the electrostatic interactions between the charged molecules and the charges of the metal (physi-sorption), while the value of ΔG°ads ≈ - 40 kJ / mole, relates to a charges transfer between the molecules of the inhibitor and the metal surface by forming covalent bonds (chemisorption) [44,55]. As far as our case is concerned, the free adsorption enthalpy value is less than -20 KJ, which indicates that the adsorption of the inhibitory molecule on the surface of tin is spontaneous occurs by a mechanism of physical adsorption involving the exchange of electrons between the oxygen atom and the tin (Figure 14). This same result is obtained by Iroha et al. in the study on the inhibition of corrosion of steel by the extract of onion resin in acidic medium [56]. Furthermore, the Tin corrosion inhibition by the aqueous brown onion extract is due to the physical adsorption of an active component in the extract on the surface of the tin, as reported by according to James et al. [57].Some researchers have noted that the discussion of the adsorption phenomenon, using extracts of natural products as a corrosion inhibitor, based on the value of free energy is not possible because the molecular masses of the compounds which constitute the extract, the alkaloids, are not well-known [58,59].
Figure 14. Chemical structure of Quercetin
3.6. SEM analysis
To correlate the electrochemical results with the observed corrosion phenomena, we performed immersion tests. The electrolytic solutions used are identical to those of the electrochemical tests. After 24 hrs. of immersion, the samples are examined by SEM. The chemical composition of the surface is achieved by the microanalysis EDX.
Figures 15-a and 15-b show the surface state of tin after 24 hrs. immersion in 0.2 M Malic acid before and after the addition of 20 g/L BROE.
Figure 15. SEM micrographs of samples after immersion in 0.2 M Maleic acid without (a) and with 20 g/L of BROE (b) at mag. of 600X.
Mor. J. Chem. 8 N°3 (2020) 700-717
714 In Fig. 15-a, the surface is highly damaged in the absence of the inhibitor while Fig. 15-b, shows the formation of a stable and insoluble protective deposit on the surface of the tin which causes the corrosion inhibition. We also observe that this layer formed is exposed to the appearance of pits on several points of the surface, which can slow down its protective power against the process of tin corrosion in this solution. The state of the tin surface after the potentiodynamic polarization of the tin electrode from -2 to 3 V corresponding to the activation and passivation potentials is illustrated in Fig. 16-a,b,c,d,e,f, at different magnifications. The appearance of cracks on the surface was observed when the polarization of the tin electrode reaches the activation zone which means that the tin dissolution is activated. On the other hand, in the passivation zone, the surface is entirely covered by a stable and insoluble adherent deposit with the appearance of bites of sizes and shapes more or less different. This observation shows that the inhibitory action of the extract is due to its adsorption thus limiting access of the electrolyte to the tin surface. To identify the nature of the film formed on the tin surface in the presence of BROE, elemental analysis was performed using a dispersive energy analysis system. Figure 17 shows the EDX spectrum of the surface of the tin electrode in 0.2 M Maleic acid in the absence and presence of 20 g/L of BROE. The mass percentages of the elements detected on the surface are reported in Table 5.
Figure 16. SEM micrographs of samples after potentiodynamic polarization of Tin electrode from–2000 to 3000 mV at different magnifications: (a) Activation zone 600X, (b) Passivation zone 600X, (c) Activation zone 1200X, (d) Passivation zone 1200X, (e) Activation zone 5000X, (f) Passivation zone 5000X.
Figure 17 (b) shows a marked increase in peaks for carbon and oxygen compared with the peaks shown in Fig. 17(a), which can be interpreted by the presence of carbon and oxygen on the surface of tin following the adsorption of inhibitor organic molecules on the metal surface. The presence of sulfur and sodium atoms can be attributed to the chemical composition of the extract (Table 5).
Mor. J. Chem. 8 N°3 (2020) 700-717
715 Table 5. Mass percentage of different elements corresponding to EDX analysis.
Elements % Mass
0.2 M Maleic acid
% Mass
0.2 M Maleic acid + 20 g/L BROE
C 4.6 11.62
O 5.04 11.69
Sn 93.25 80.55
S 0 0.21
Na 0 0.3
Figure 17. EDX analysis of surface of the tin electrode in 0.2 M Maleic acid (a) in the absence and (b) The presence of 20 g/L BROE.
4. Conclusions
From these studies, it can be concluded that:
BROE is an efficient inhibitor and the inhibition efficiency increases upon increasing the concentration but decreases upon rising the temperature.
The adsorption of BROE on the tin surface was found to be following the Langmuir adsorption isotherm model.
From the thermodynamic point of view, the adsorption process is spontaneous, endothermic, and accompanied by a decrease in entropy of the system.
The study of tin surface morphology by SEM combined with EDX confirms the presence of a stable and insoluble
Mor. J. Chem. 8 N°3 (2020) 700-717
716 adherent deposit which limits access and aggressiveness of the acid to the surface metal.
Acknowledgments
The research was financially supported by the CNRST through the competence pôle PECCA (Rabat, Morocco) are gratefully acknowledged. We thank also the Ibn Zohr University, Morocco, through the platform of analysis for characterization techniques support.
Author Contributions
Brahim. Ait Addi and Salma. Mouaamoun: Investigation, Data curation, Formal analysis funding acquisition.
Abdelaziz. Ait Addi: Project administration, Writing the original draft. Abdul. Shaban, El-Habib Ait Addi, and Mohamed Hamdani: Writing-review & editing and consultations.
References
[1] B. C. Worley, W. A. Ricks, M. P. Prendergast, B. W. Gregory, R.Collins, J. J. Cassimus, R. G. Thompson, Langmuir (29) (2013) 12969-12981.
[2] V.K. Gouda, E.N. Rizkalla, S. Abd-el-Wahab, E.M. Ibrahim, Corrosion Science, (1981) 21, p.1-15.
[3] R. M. El-Sherif, W. A. Badawy, Int. J. Electrochem. Sci., (6) (2011) 6469 – 6482.
[4] S. S.Abd El Rehim, H. H. Hassan, N. F. Mohamed, Corrosion Sci. (46) (2004) 1071-1082.
[5] A.O. James, O. Akaranta, International Journal of Applied Chemical Sciences Research, 2014 2 1 -10.
[6] P. C. Okafor, V.I. Osabor, E. E. Ebenso, The international journal of colorants, polymers and color applications- Pigment & Resin Technology, (35) (2007) 299–305.
[7] P. C. Okafor, M. E.Ikpi, I. E. Uwah, E. E. Ebenso, U. J. Ekpe, S. A. Umoren, Corrosion Science, (50) (2008) 2310- 2317.
[8] V.Khuzhaev, S.Aripova, Chemistry of Natural Compounds, (36) (2000) 418–421.
[9] A. U. Ogan, Phytochemistry, (10) (1971) 2544–2547.
[10] P. C. Okafor, U. J. Ekpe, E. E. Ebenso, E. M. Umoren, K. E. Leizou, Bulletin of electrochemistry, (21) (2005) 347–352.
[11] C.A. Rice-Evans, L. Parker, Marcel Dekker, New York (1998).
[12] A. K. Aris, F.J. Romero, C. G. Merino, Free Radical Biology and Medicine, (37) (2004) 48-61.
[13] J.B. Harborne, C. A. Willians, Photochemistry, (55) (2000) 481-504.
[14] P. Pietta, Journal of Natural Products, (63) (2000) 1035-1042.
[15] J. Zhou, L. F. Wang, J.Y. Wang, N.Tang, Transition Metal Chemistry, (26) (2001) 57-63.
[16] A.Bravo, J. R. Anacona, Transition Metal Chemistry, (26) (2001) 20-23.
[17] J. Zhou; L. F. Wang, J.Y. Wang, N.Tang, J. Inorganic Biochem., (83) (2001) 41-48.
[18] K. C. R. Ferreira, R. F. B. Cordeiro, J. C. Nunes, H. Orofino, M. Magalhães, A. G. Torres, E. D'Elia, Int. J.
Electrochem. Sci., (11) (2016) 406-418.
[19] S. Sulaiman; A. Nor-Anuar, A. S. Abd-Razak, S. Chelliapan, Res. J. Chem. Sci., (2) (2012) 10-16.
[20] A. O. James, O.Akaranta, African Journal of Pure and Applied Chemistry, (3) (2009) 262-268.
[21] M. Ferry, C. W. Mohd Noor, F. Gaspersz, M. Manuputty, Journal of Engineering, Computers & Applied Sciences, (2) (2013) 24-30.
[22] A. Popova, M. Christov, J. Univ. Chemtech. Met. (43) (2008) 37-48.
[23] S. Martinez, M. Mansfeld-Hukovic, J. Appl. Electrochem. (33) (2003) 1137-1142.
[24] M. Elayyachy, A. El Idrissi, B. Hammouti, Corros. Sci., (48) (2006) 2470-2479.
[25] P. Li; J.Y. Lin, K.L. Tan, J.Y. Lee, Electrochim. Acta, (42) (1997) 605-615.
[26] A. Popova, S.Raicheva, E.Sokolova, M.Christov, Langmuir, (12) (1996) 2083-2089.
[27] Z. Stoynov, Electrochim. Acta, (35) (1990) 1493-1499.
[28] F.Bentiss, M. Traisnel, M. Lagrenee, Corros. Sci., (42) (2000) 127-146.
Mor. J. Chem. 8 N°3 (2020) 700-717
717 [29] I. Ahamad, M.A. Quraishi, Corros. Sci., (52) (2010) 651-656.
[30] S. Murlidharan, K.L.N. Phani, S. Pitchumani, S. Ravichandran, J. Electrochem. Soc., (142) (1995) 1478- 1483.
[31] K. Benchekroun, F. Dalard; J.-J. Rameau, New Journal of Chemistry, (26) (2002) 946-952.
[32] K. Emregu, M. Hayvali, Corros. Sci., (48) (2006) 797–812.
[33] A. Fouda, A. Eldesoky, A. El-Sonbati; S. Salam., Int. J. Electrochem. Sci., (9) (2014) 1867-1891.
[34] P. Bommersbach, C. Dumont-Alemany, J. P. Millet, B. Normand, Electrochim. Acta., (51) (2005) 1076-1084.
[35] F. Bentiss, M. Lebrini, M. Lagrenee, Corros. Sci., (47) (2005) 2915-2931.
[36] A. O. James, O. Akaranta, Afr. J. Pure Appl. Chem., (3) (2009) 212- 219.
[37] R. Suarez-Hernandez, G. Gonzalez-Rodriguez, G. F. Dominguez-Patiño, A. Martinez-Villafañe, Anti- Corrosion Methods and Materials, (61) (2014) 224-231.
[38] P. Li, J.Y. Lin, K.L. Tan, J.Y. Lee, Electrochim. Acta, (42) (1997) 605-615.
[39] L. Saqallil, M. Galai, N. Ghardal, M. Sahrane, R. Ghailane, M. Ebn Touhami, Y. Peres-lucchese, A. Souizi, N.
Habbadi, Int. J. Electrochem. Sci., (13) (2018) 5096-5119.
[40] M. Elayyachy, M. Elkodadi, A. Aouniti, A. Ramdani, B. Hammouti, F. Malek, A. Elidrissi, Mat. Chem. Phys., (93) (2005) 281-285.
[41] A. Tazouti, M. Galai, R. Touir, M. Ebn Touhami, A. Zarrouk, Y. Ramli, M. Saraçoğlu, S. Kaya, F.
Kandemirli, C. Kaya, J. Mol. Liq., (221) (2016) 815-832.
[42] E. A. Noor, Int. J. Electrochem. Sci., (2) (2007) 996-1017.
[43] M. Dahmani, A. Et-Touhami, S. Al-Deyab, B. Hammouti, A. Bouyanzer, Int. J. Electrochem. Sci., (5) (2010) 1060-1069.
[44] M. K. Gomma, M. H. Wahdan, Mater. Chem. Phys., (39) (1995) 209-213.
[45] A. Ali, G. Saeed, U. Rahman, Corros. Sci., (45) (2003) 253-266.
[46] I. B. Obot, N. O. Obi-Egbedi, S. A. Umoren, E. E. Ebenso, Int. J. Electrochem. Sci., (5) (2010) 994-1007.
[47] N. Soltani, M. Behpour, H. Ghoreishi, S.M. Naeimi, Corros. Sci., (52) (2010) 1351-1361.
[48] M. Behpour; S.M. Ghoreishi, M. Khayatkashani, N. Soltani, Corros. Sci., (53) (2011) 2489-2501.
[49] I. El Ouali, B. Hammouti, A. Aouniti, X. Ramli, Y. Azougagh, E.M. Essassi, M. Bouachrine, J. Mater. Envir.
Sci., (1) (2010) 1-8.
[50] P. Cardoso, F.A. Reis, F.C. Massapust, J.F. Costa, L.S. Tebaldi, L.F.L. Araújo, M.V.A. Silva, T. S. Oliveira, J.A.C.P. Gomes, E. Hollauer, Quim. Nova., (28) (2005) 756-760.
[51] A. B. Da Silva, E. D’Elia, J. A. Cunha Ponciano Gomes, Corros. Sci., (52) (2010) 788793.
[52] N.J.N. Nnaji, C.O.B. Okoye, N.O. Obi-Egbedi, M. A. Ezeokonkwo, J.U. Ani., Int. J. Electrochem. Sci., (8) (2013) 1735-1758.
[53] E. A. Noor, A. Al-Moubaraki, A. H. Al-Zhrani, M. H. Hubani, Int. J. Electrochem. Sci., (11) (2016) 6523- 6539.
[54] G. Avci, Colloids and Surfaces A: Physicochem. Eng. Aspects, (317) (2008) 730-736.
[55] S. Safak, B. Duran, A. Yurt, G. Türkoğlu, Corros. Sci., (54) (2012) 251-259.
[56] N. B. Iroha, O. Akaranta, A. O. James, IRJPAC, (6) (2015) 174-181.
[57] A. O. James, O. Akaranta, African Journal of Pure and Applied Chemistry, (3) (2009) 262-268.
[58] A.M. Abdel-Gaber, B.A. Abd-El-Nabey, M. Saadawy, Corros. Sci., (51) (2009) 1038-1042.
[59] M. Lebrini, F. Robert, P.A. Blandinières, C. Roos, Int. J. Electrochem. Sci., (6) (2011) 2443-2460.