hjic.mk.uni-pannon.hu DOI: 10.33927/hjic-2019-15
ANALYSIS OF CRUDE OIL IN TERMS OF FOULING AND CORROSION
RICHÁRDKATONA1, ROLANDLÓCSKAI1,2, GERG ˝OBÁTOR1,2, ANTALKRÓJER1,ANDTIBOR
KOVÁCS*1
1Institute of Radiochemistry and Radioecology, University of Pannonia, Egyetem u. 10, Veszprém, 8200, HUNGARY
2Social Organisation for Radioecological Cleanliness, József Attila u. 7/A, Veszprém, 8200, HUNGARY
The present-day oil refining market has the potential to process opportunity crudes. The degree of corrosion and fouling issues has increased in terms of processing opportunity crudes. In the case of changing crude slates, predicting the impacts of crude oil on production is necessary to ensure safe and profitable processing. Crude oil can be characterized by the quantitative and qualitative analyses of saturates, aromatics, resins, asphaltenes and contaminants as well as the determination of its physical and chemical properties. The complementary nature of these analyses is necessary to identify the root causes of fouling and corrosion problems and quantify the impact of them.
In this study, analytical methods were developed to investigate the effect of crude oils on production in terms of fouling and corrosion, which can be used to characterize crude oil from different sources. The compatibility, emulsification tendency and fouling potential of crude oil were analyzed by the developed analytical methods. The measurement method to assess the compatibility of crude oils is based on the determination of the flocculation tendency of asphaltenes in oils. A Porla GLX Step Analyzer was used for the compatibility tests. Emulsification and fouling tendencies were measured by our in-house designed laboratory equipment. These measurements were conducted under typical operating conditions. The developed analytical methods were validated by crude oils from five different sources.
Keywords: crude oil, fouling, corrosion, emulsion, desalter, compatibility, asphaltenes
1. Introduction
Refineries have had to handle problems associated with fouling and corrosion for a prolonged period of time. The degree of corrosion and fouling issues has increased since the processing of opportunity crudes and co-processing of renewable feeds were introduced [1,2].
It is well known that crude oils contain water, chloride salts and organochlorine compounds [3]. When crude oils are preheated in the heat exchangers of crude units, the hydrolysis of chloride salts and organochlorine com- pounds occurs. In these chemical reactions, gaseous hy- drochloric acid is released. The gaseous hydrochloric acid present in the steam phase can easily dissolve in condensed water, resulting in very low pH values. The concentrated caustic solution can cause general corro- sion of equipment in crude units composed of carbon steel [4,5]. Desalting is the first line of defense against corrosion induced by the hydrochloric acid [6]. Earlier studies showed that the efficiency of desalter apparatus is influenced by the stability of the emulsion generated.
The stability of the emulsion increases and the efficiency of the desalter decreases when the asphaltene content of the crude oil is high [7]. Besides the desalting process,
*Correspondence:kt@almos.uni-pannon.hu
neutralizers and corrosion inhibitors are also used against corrosion in crude units [8].
Fouling deposits can be categorized into inorganic and organic types. Organic fouling results from as- phaltenes and high molecular weight hydrocarbons which become insoluble in the system [9]. The asphaltene molecules can become unstable due to the effect of blend- ing and heating incompatible crude oils. The precipitated molecules can be deposited on the surface of heat ex- changers [10]. Corrosion products of iron (FeS, Fe2O3) and inorganic contaminants in crude oils can cause inor- ganic fouling. In the crude oil preheat train, the viscosity of the oil is lowered because of heating and the deposi- tion of inorganic contaminants increases. Regardless of the cause, high fouling rates can lead to excessive equip- ment cleaning requirements and costs. Chemicals–such as dispersants and inhibitors–are used to effectively re- duce fouling in several critical areas throughout a refinery [11].
In the case of changing crude slates, predicting the impacts of crude oil on production is necessary for safe and profitable processing [12]. In this study, analytical methods were developed to investigate the effect of crude oils on production with regard to fouling and corrosion, which can be used for characterizing crude oil from dif-
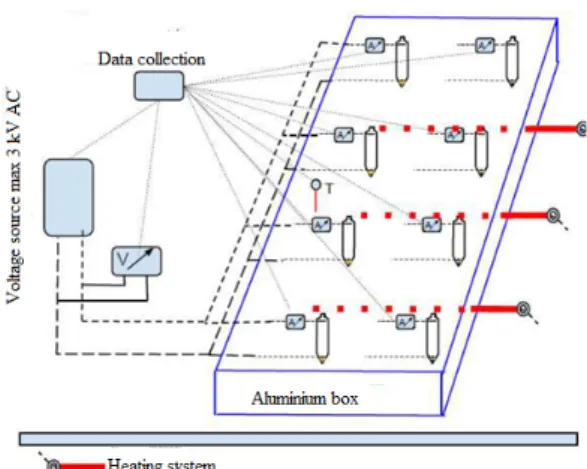
Figure 1:Schematic drawing of laboratory desalter model equipment.
ferent sources. The key causes of crude oil processing is- sues are incompatibility, the emulsification tendency and the fouling potential [3].
2. Experimental
Five crude oils from different sources were used in this study to validate the developed procedure. API gravity, Total acid number (TAN), water content, asphaltene con- tent, inorganic contaminants and the distillation curve of crude oils were measured in accordance with ASTM D4052, ASTM D664, ASTM D4807, MSZ EN 459, MSZ EN ISO 9029 and ASTM D7096. In addition, the total chlorine content of one desalted crude oil was measured by neutron activation analysis.
2.1 Emulsification tendency
In the first section of the determination of the emulsifi- cation tendency,950ml of crude oil and50ml of water were agitated using an ULTRA-TURRAX stirrer at 75
°C and13,500rpm for5minutes. Then80ml of emul- sion was poured out into a tube that was made according to the standard test method ASTM D96. After that the emulsification tendencies of crude oils were analyzed by our in-house-designed laboratory desalter simulator. The schematic drawing of the equipment used is shown inFig.
1.
The desalter simulator apparatus consists of a ther- moblock,8transformers and toroidal transformers. The emulsion separation tubes are located in the aluminium thermoblock. The electric field in the tubes is controlled by the installed transformers. The connection between tubes and toroidal transformers is provided by special caps with two isolated electrodes. The temperature of the thermoblock can be adjusted by the control unit of the apparatus. During the measurement, the temperature was110°C and the electrical voltage was2,500V. The emulsion was resolved in the separation tubes in accor- dance with the known method of providing an electric
field to polarize water droplets. The volume of water that dropped into each tube was recorded after10,20,30, and 60minutes. The more water that dropped and the clearer the water phase, the more effective the desalting process [13].
2.2 Fouling tendency
The fouling tendency was measured in the high- performance thermoblock. The equipment is an alu- minium thermoblock in which8places for special tubes and an electric heater coil are located. The heating can be regulated by a control unit. The special tubes are pressure vessels100ml in volume. Into the tubes,25g of crude oil samples were measured. The samples were heated at250
°C for48hours then cooled to80°C and filtered under a vacuum through a0.7 µm membrane filter. The filter along with the residue was washed with petrol, dried and weighed to yield the final result. In order to measure the amount of generated deposits on the wall of the tubes, they were washed with petrol and then the petrol wash was filtered under a vacuum through a0.7µm membrane filter too. The deposit was calculated from
S= 10000(m2−m1)100
25 , (1)
where the mass of the filter is denoted bym1, the mass of the filter with the deposit by m2 and the amount of deposits in ppm byS[14].
2.3 Neutron activation analysis
Neutron activation analysis determines the total chlorine content in the sample regardless of its oxidation, inor- ganic or organic states. The measurement is capable of handling inhomogeneous samples of greater masses, thus mitigating the uncertainties of sampling. The measuring range spans several times the magnitude of the range of alternative techniques, and has a small measurement error [15].
Samples were prepared in 1 ml vials and sealed in polyethylene bags. The samples were then placed in larger 5 cm plastic vials that were irradiated. To pro- vide redundancy in the case of a leakage, the outer vial was heat sealed using a hot iron. The masses of the sam- ples were approximately1g and were irradiated by a1.1 MW Mark II TRIGA Reactor at the University of Texas in Austin. In order to examine the total chlorine content, samples were irradiated using a reactor power of500kW for5minutes. Thermal neutrons were used due to favor- able cross-sections for radiative capture within this range.
The following reaction was used to determine the total chlorine content: 37Cl(n, γ)38Clwith its half-life of37 minutes. Samples were allowed to decay for15minutes prior to being counted by a gamma-ray spectrometer. The samples themselves were counted for between 600 and 2,700seconds, depending on the net count rate under the 1,642keV photopeak for chlorine.
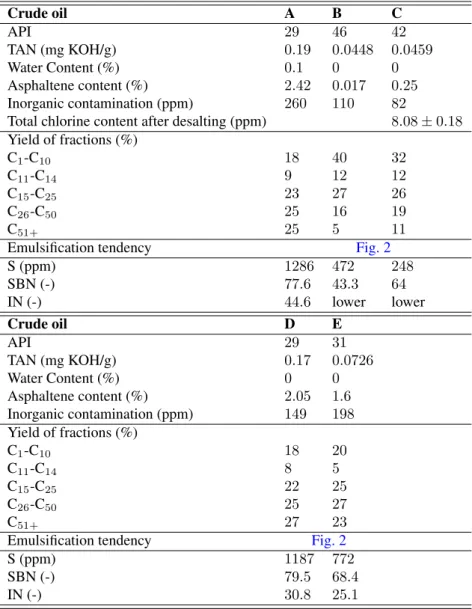
Table 1:Summary of the properties of the crude oils
Crude oil A B C
API 29 46 42
TAN (mg KOH/g) 0.19 0.0448 0.0459
Water Content (%) 0.1 0 0
Asphaltene content (%) 2.42 0.017 0.25
Inorganic contamination (ppm) 260 110 82
Total chlorine content after desalting (ppm) 8.08±0.18 Yield of fractions (%)
C1-C10 18 40 32
C11-C14 9 12 12
C15-C25 23 27 26
C26-C50 25 16 19
C51+ 25 5 11
Emulsification tendency Fig. 2
S (ppm) 1286 472 248
SBN (-) 77.6 43.3 64
IN (-) 44.6 lower lower
Crude oil D E
API 29 31
TAN (mg KOH/g) 0.17 0.0726
Water Content (%) 0 0
Asphaltene content (%) 2.05 1.6
Inorganic contamination (ppm) 149 198 Yield of fractions (%)
C1-C10 18 20
C11-C14 8 5
C15-C25 22 25
C26-C50 25 27
C51+ 27 23
Emulsification tendency Fig. 2
S (ppm) 1187 772
SBN (-) 79.5 68.4
IN (-) 30.8 25.1
2.4 Compatibility
The compatibility test of crude oils is based on the Oil Compatibility Model. This model enables the insolubil- ity number (IN) and solubility blending number (SBN) of crude oils to be calculated. Two tests were carried out to measure the solubility parameter. The first test involved determining the maximum volume ofn-Heptane that can be added to a given volume of oil without the precipita- tion of asphaltenes. Then the minimum percent of toluene in the mixture with n-Heptane to dissolve asphaltenes was determined. The volume percentage of toluene in the toluene–n-heptane mixture was plotted against the vol- ume ratio of oil to the toluene–n-heptane mixture. The insolubility number is where a line drawn through the two points intercepts they-axis. The solubility blending num- ber can be calculated by
SBN = IN
1 + ml heptane ml oil
. (2)
The criterion for the compatibility of the oil mixture is that the volume average SBN is greater than the IN of all types of oil in the mixture. It follows that the higher the SBN, the more compatible the crude oil is [16,17].
A Porla GLX Step Analyzer was used to analyze the compatibility of crude oils. The laboratory analyzer per- forms the dilution in an aromatic solvent and the titration with paraffin hydrocarbon automatically. The analyzer was used in accordance with the factory-preset program.
Insoluble asphaltenes were detected by an optical detec- tor according to the intensity of scattered visible light.
The wavelength of the light was selected to be sensitive enough to detect even minute concentrations of asphal- tene particles in the measuring solution.
3. Results and Discussion
The results of analytical measurements are summarized inTable 1.
Samples B and C are light crude oils, while A, D and
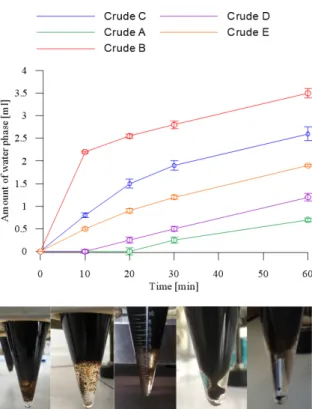
Figure 2:The emulsification tendencies and the pictures of emulsions after the measurements. The order of the crude oils in the pictures from left to right is the following:
Crude oil A, B, C, D and E.
E are medium crude oils according to API gravity. The crude oils in order of asphaltene content from lowest to highest are: B, C, E, D and A. It is recognized that the highest emulsification of water occurs when the asphal- tene content is high [6]. In blueFig.2, it can be seen that the crude oil with the highest content of asphaltenes (A) formed the most stable emulsions. On the other hand, the emulsification tendencies of crude oils B and C showed that the emulsion of light crude oil can be easily resolved.
The quantities of water phases following the measure- ments are presented inFig. 2. The water phases of stable emulsions are oily, while those of emulsions with lower asphaltene contents are clear.
The total chlorine content of desalted crude oil was measured by neutron activation analysis. The total chlo- rine content in the desalted crude oil may be the result of the remaining dissolved salts and organic chlorides.
Organic chlorides present a more significant problem in crude oil refineries when compared to inorganic chlo- rides, since they are not removed by the desalting process [18].
The fouling tendency can also be correlated with the asphaltene content. The lowest amount of deposit was measured for the crude oil of the lowest content of as- phaltenes (Crude oil B). From Table 1, it can be seen that the higher the asphaltene content of crude oil, the greater the amount of the deposit. However, the asphal- tene content of Crude oil C is higher than that of B, but the amount of the deposit of Crude oil C is lower than
Figure 3:Compatibility test results of a mixture of Crudes B-D.
Figure 4:Compatibility test results of a mixture of Crudes A-C.
Figure 5:Compatibility test results of a mixture of Crudes C-E.
that of B. This is explained by the amount of inorganic contaminants which is higher for Crude oil B than C.
Furthermore, as the results of the compatibility test show, lower SBNs belong to the light crude oils with low asphaltene contents. InFigs. 3-5, the evaluation of three crude oil blends is shown. INmaxdenotes the greater IN of the two respective crude oils that were blended. In all three cases, the volume average SBN is always greater than the INmax, so the mixtures of Crude oils B-D, C-A and C-E are compatible with any blending ratios. The INs of Crude oils B and C were not determined because the software of the analyzer just shows the highest IN among the blended crude oils.
4. Conclusion
Fouling and corrosion exact significant economic and operational penalties. The risk of prosecution has in- creased with the processing of opportunity crudes and co- processing of renewable feeds [19]. In this paper, some laboratory methods were developed to investigate the ef- fect of crude oils on production in terms of fouling and
corrosion. The emulsification tendency as well as the ef- fect of blending and heating on crude oils were mea- sured by the developed laboratory methods. These meth- ods can be used for characterizing crude oil from differ- ent sources. The results of developed laboratory methods were compared with the composition of crude oils. As is confirmed by the results, asphaltenes and high molecu- lar weight hydrocarbons have a significant impact on the production of crude oils in terms of fouling and corrosion.
The cost and complexity of the determination of total chlorine content by neutron activation analysis make it unfit for routine analytical purposes, but the precision of the results makes it a perfect choice as a reference method [20]. Our plan is to propose methods to quantify lower amounts of total chlorine content in crude oils using neu- tron activation analysis as a reference method.
REFERENCES
[1] Ropital, F.: Current and future corrosion challenges for a reliable and sustainable development of the chemical, refinery, and petrochemical industries, Materials and Corrosion,200960(7), 495–500DOI:
10.1002/maco.200805171
[2] Gergely, A.; Locskai, R.; Szabó, P.; Krójer, A.;
Kristóf, T.: Hydrogen sulphide corrosion of car- bon and stainless steel alloys immersed in mix- tures of renewable fuel sources and tested under co- processing conditions, Hung. J. Ind. Chem., 2016 44, 55–70DOI: 10.1515/hjic-2016-0007
[3] Teran, C.: Crude fingerprinting and predictive analytics, Digital Refining, 2017 https://www.
digitalrefining.com/article/1001416
[4] Clarida, D.; Johnston, J.; McConnell, M.;
Strong, R.: Corrosion and fouling experi- ences in crude units using low base strength neutralizers. (Corrosion 97, NACE Interna- tional, Houston, 1997, NACE-97499) https:
//www.onepetro.org/conference-paper/NACE-97499
[5] Al-Omari, A. S.; Al-Zahrani, A. M.; Lobley, G. L.; Tems, R. D.; Dias, O. C.: Case Stud- ies and Best Practices of Refinery Caustic In- jection Systems, Saudi Aramco Journal of Tech- nology, 2009, 29-36 https://nvlpubs.nist.gov/
nistpubs/Legacy/SP/nbsspecialpublication674.pdf
[6] Gutzeit, J.:Controlling Crude Unit Overhead Cor- rosion – Rules of Thumb for Better Crude Desalt- ing. (Corrosion 2007, NACE International, Hous- ton, 2007, NACE-07567) https://www.onepetro.
org/conference-paper/NACE-07567
[7] Fingas, M.: Water in Oil Emulsion Formation: A re- view of Physics and Mathematical modeling,Spill Sci. Technol. B., 19952(1), 55–59DOI: 10.1016/1353- 2561(95)94483-Z
[8] Lukács, Z.; Kristóf, T.: Application of 2N design of experiment method for the evaluation of the effi- ciency and cross-effects of oilfield chemicals,Hung.
J. Ind. Chem., 2018 46(2), 13–17 DOI: 10.1515/hjic- 2018-0012
[9] Polley, G. T.; Wilson, B. D.; Yeap, B. L.; Pugh, S. J.: Evaluation of laboratory crude oil thresh- old fouling data for application to refinery pre-heat trains,Appl. Therm. Eng., 200222(7), 777–788DOI:
10.1016/S1359-4311(02)00023-6
[10] Wiehe, A. I.: The chemistry of petroleum fouling, (Proceedings of the 4th Interna- tional Conference on Refinery Processing, AIChE, New York, 2001), pp. 204-210
http://www.solublesolutions.com/wp-content/
themes/twentyeleven_child/images/FoulChem2001.doc
[11] Wilson, R. M.; Perugini, J.J.:Antifoulants: a proven energy-savings investment, (National Petroleum Re- finers Associaton, Technical Paper, United States, 1985)https://www.osti.gov/biblio/6358216
[12] Nagi-Hanspal, I.; Subramaniyam, M.; Shah, P.;
Moretti, S.; Noland, J.: Exploiting opportunities with challenging crudes, (The Refining, Gas & and Petrochemicals Processing Website) 2012/Q4http:
//www.eptq.com/view_article.aspx?intAID=1197
[13] Hajivand, P.; Vaziri, A.: Optimization of demulsifier formulation for separation of water from crude oil emulsions,Braz. J. Chem. Eng., 201532(1), 107–
118DOI: 10.1590/0104-6632.20150321s00002755
[14] ASTM D4807(2015), Standard Test Method for Sediment in Crude Oil by Membrane Filtration, ASTM International,DOI: 10.1520/D4807-05R15
[15] Wiehe, A. I.; Kennedy, J. R.: Application of the Oil Compatibility Model to Refinery Streams, Energy Fuels, 200014(1), 56–59DOI: 10.1021/ef9901342
[16] Rathore, V.; Brahma, R.; Thorat, S. T.: Assessment of crude oil blends, Digital Refining, 2011 https:
//www.digitalrefining.com/article/1000381
[17] Pei, P. X.; Hsu, S.; Fleming, W. R.: Test methods for total chlorine in lubricating base oils,Measure- ment and Standards for Recycled Oil, 19824, 271–
280 https://nvlpubs.nist.gov/nistpubs/Legacy/SP/
nbsspecialpublication674.pdf
[18] Li, X.; Wu, B.; Zhu, J.: Hazards of organic chloride to petroleum processing in Chinese Refineries and Industrial Countermeasures, Progress in Petrochemical Science, 20182(3) DOI:
10.31031/PPS.2018.02.000539
[19] Garrett, T.; Rattanakhambay, A.; Robbins, N.;
Wunder, M.; Yeung, T.: The challenges of crude blending, Digital Refining, 2016 https://www.
digitalrefining.com/article/1001216
[20] Tagami, K.; Uchida, S.; Hirai, S.; Tsukada, H.;
Takeda, H.: Determination of chlorine, bromine and iodine in plant samples by inductively cou- pled plasma-mass spectrometry after leaching with tetramethyl ammonium hydroxide under a mild temperature condition, Anal. Chim. Acta,2006 570(1), 88–92DOI: 10.1016/j.aca.2006.04.011