Using the Fisher Vector Representation for Audio-based Emotion Recognition
Gábor Gosztolya
MTA-SZTE Research Group on Artificial Intelligence of the Hungarian Academy of Sciences and University of Szeged, Tisza Lajos krt. 103, H-6720 Szeged, ggabor@inf.u-szeged.hu
Abstract: Automatically determining speaker emotions in human speech is a frequently studied task, where various techniques have been employed over the years. An efficient method is to represent the utterances by employing the Bag-of-Audio-Words technique, inspired by the Bag-of-Visual-Words approach from the area of image processing. In the past few years, however, Bag-of-Visual-Words has been replaced by the so-called Fisher vector representation, as it was shown to give a better classification performance. Despite this, in audio processing, Fisher vectors to date have only been rarely applied. In this study, we show that Fisher vectors are also a viable way of representing features in speech technology; more precisely, we use them in the task of emotion classification. Based on our results on two datasets, Fisher vectors can be effectively employed for this task: we measured 4% relative improvements in the UAR scores for both corpora, which rose to 9- 16% when we combined this approach with the standard paralinguistic one.
Keywords: audio processing; emotion detection; Fisher vector representation; Support Vector machines
1 Introduction
Within speech technology, automatic emotion recognition from audio (also known as affective processing) is a very active research topic [1, 18, 19, 20], which also has several possible applications in human-computer interaction and also in monitoring human communications. The potential application areas include human-robot interaction [14], dialogue systems [2], health monitoring [12, 25] and call centres [43].
From a wider perspective, acoustic emotion recognition can be viewed a task belonging to the area of computational paralinguistics [37], which contains tasks focusing on locating and identifying phenomena present in human speech other than the actual words uttered. (Besides emotion detection, notable tasks belonging to this area include conflict intensity estimation [16, 29], and determining speaker gender and age [23].) In this area an important research question is to design
reliable, compact, and descriptive feature representations; but a specific difficulty of this task is to find a fixed-length feature representation for varying-length speech utterances.
A recently proposed such feature representation is the Bag-of-Audio-Words (BoAW) technique, inspired by the image processing approach of Bag-of-Visual- Words (BoV, [3, 5]). In the BoAW approach we take the frame-level features (e.g.
Mel-frequency cepstral coefficients (MFCCs) or perceptual linear predictions (PLPs)) of the utterances of the training set and cluster them. Then, for the next step, each frame-level feature vector is replaced by its cluster index; utterance- level feature vectors are calculated as the (normalized) histogram of the clusters of the frame vectors of the given utterance [26]. Since their introduction, BoAW representations have been successfully employed in emotion detection [11, 27, 32]
as well as in several other paralinguistic tasks [10, 21, 31, 36].
Recalling the motivation behind Bag-of-Audio-Words, a similar and perhaps even more informative representation approach for image processing is that of Fisher vectors (FV, [13]). A handful of studies used Fisher vectors in speech processing for categorizing audio files as speech, music, and other [24], for speaker verification [40, 45] and for determining food type from eating sounds [17]. Still, we cannot say that applying FVs has become widespread or even well-known in audio processing. Although in the past few years there has been a rush of computational paralinguistic and audio-based emotion research, we only found the above few studies that employ this representation in the area.
In this study we utilize the Fisher vector feature representation for audio processing; more specifically, we adapt the image recognition approach of Fisher vectors for speech-based emotion categorization. To demonstrate the efficiency of this technique, we use two emotion datasets in our experiments, and compare the proposed approach with the standard computational paralinguistic one (`ComParE functionals’) first presented in 2013 [35]. Our experimental results indicate that the Fisher vector-based representation leads to competitive scores: we achieved relative error reduction values around 4% when using the Fisher vectors alone, which increased to 9-16% via a combination with the baseline approach. Our results also confirm that the Fisher vector representation appears to be (relatively) compact, as it consisted of only 10-20% of the number of features in the standard ComParE functionals feature set.
2 Fisher Vectors
The aim of Fisher vector representation was to combine the generative and discriminative machine learning approaches by deriving a kernel from a generative model of the data [13]. In it, a set of low-level feature vectors (e.g.
extracted from the image) is modelled by their deviation from the distribution.
That is, let X = x1, …, xT be a sert of d-dimensional low-level feature vectors extracted from an input sample, and let their distribution be modelled by a probability density function p(X|Θ), Θ being the parameter vector of the model.
The Fisher score describes X by the gradient GXΘ of the log-likelihood function, i.e.
1 log |
X T p
G
X . (1)This gradient function describes the direction in which the model parameters (i.e.
Θ) should be changed to best fit the data. Notice that, at this point, the size of GXΘ is already independent of the number of low-level feature vectors (i.e. of T), and it depends only on the number of model parameters (i.e. Θ). The Fisher kernel between the sequences X and Y is then defined as
X , Y GXF
1G
Y,
K
(2)where FΘ is the Fisher information matrix of p(X|Θ), defined as
| log | ].
log
[
TX
p X p X
E
F
(3)Expressing F-1Θ as F-1Θ = LTΘLΘ, we get the Fisher vectors as
| .
log
XL
G
XL
p X
(4) In the case of image processing, a varying number of low-level descriptors such as SIFT descriptors (describing occurrences of rotation- and scale-invariant primitives [22]) are extracted from the images as low-level features. The p(X|Θ) distributions are typically modelled by Gaussian Mixture Models (GMMs) [6,30];hence, assuming a diagonal covariance matrix, the Fisher vector representation of an image has a length of twice the number of Gaussian components for each feature dimension. For more details, the reader is kindly referred to the studies of Csurka and Perronnin [6] and Sánchez et al. [30].
2.1 Fisher Vector Representation of Audio Data
To adapt Fisher vectors to audio processing, it is straightforward to use the frame- level features (e.g. MFCCs, PLPs [28] or raw filter bank energies) of the utterances as the low-level features (i.e. X). Similar to the case of image classification, the distribution of the frame-level components can be modelled by GMMs. For GMMs, using MFCCs is a plausible choice since their components are quasi-orthogonal; however, it is unclear if we should make use of the first and second-order derivatives as well, or if we can obtain the best representation without the Δ and Δ Δ values. A parameter of the method is N, the number of Gaussian components. Our workflow of Fisher vectors used in audio processing is shown in Fig. 1.
Figure 1
Workflow of the Fisher vector representation used for audio processing
A plausible choice for the discriminative classification step is to utilize Support Vector Machines (SVMs, [33]) with a linear kernel for three reasons. Firstly, it is widely used in combination with Fisher vectors in image classification as well (see e.g. [30]). Secondly, it is the de facto standard solution for classifying (paralinguistic) audio data. Thirdly, it was shown (see e.g. [30]) that using the Fisher vector representation as features and performing classification with an SVM using a linear kernel is equivalent to using the SVM with the Fisher kernel.
Before utilizing the extracted FVs as feature vectors; however, they should first be normalized or standardized.
3 Experimental Setup
3.1 The FAU AIBO Emotion Corpus
The FAU AIBO Emotion Corpus [38] contains audio files recorded from German children while playing with Sony's pet robot Aibo. The children were told that Aibo responds to their commands, while it was actually remotely controlled by a human. Overall, 51 children were involved in the study from two schools; the 9959 recordings from the Ohm school are commonly used as the training set in speaker-wise cross-validation (CV), while data from the Mont school (8257 recordings) serve as the test set. Since the training set is fairly large, we defined a development set from the recordings of six speakers (2381 utterances), leaving data from 20 children (7578 recordings) in the actual training set.
From the original 11 emotional categories, later a 5-class problem was created by merging emotional labels [34]. These classes are: Angry (containing the original categories of angry, touchy and reprimanding), Emphatic, Neutral, Positive (containing motherese and joyful), and Rest.
3.2 The Hungarian Emotion Corpus
The Hungarian Emotion Database [39] contains sentences from 97 Hungarian speakers who participated in television programmes. A large portion of the segments were selected from spontaneous continuous speech rich in emotions (e.g. talk shows, reality shows), while the rest of the database came from improvised entertainment programmes. Note that, although actors tend to overemphasize emotions while acting, it was observed that in improvisation their performance is quite similar to real-life emotions [42].
Four emotion categories were defined, namely Anger, Joy, Neutral, and Sadness.
Since at the time of recording, it was not standard practice to create a speaker- independent split, we defined our own training and test sets; the training set consisted of 831 segments, while the test set had 280 utterances. Due to the relatively small size of the dataset, we split the training set into 10 roughly equal- sized, speaker-independent folds, and performed ten-fold cross-validation. Note that, due to this re-partitioning, our results presented here cannot be directly compared to those presented in the earlier studies (i.e. [39,42]), but in general authors reported classification accuracy scores around 66-70%.
3.3 Fisher Vector Parameters
We used the open-source VLFeat library [41] to fit GMMs and to extract the FV representation; and from the various ports available, we employed the Matlab integration. When fitting Gaussian Mixture Models, we experimented with N = 4, 8, 16, 32, 64, and 128 components. As the input feature vectors, we utilized MFCCs, extracted by the HTK tool [44]. We experimented with using the 12 MFCC vectors along with energy as frame-level feature vectors, and we also tried adding the first and second-order derivatives.
3.4 Utterance-Level Classification
Our experiments followed standard paralinguistic protocols. After feature standardization, we used applied SVMs with linear kernel for utterance-level classification, using the LibSVM [4] library; the value of C was tested in the range 10{-5,…,2}, just like in our previous paralinguistic studies. (e.g. [8, 9]). Optimal meta-parameters (C for SVM and N for Fisher vectors) were determined on the development set (FAU AIBO Corpus) or in ten-fold cross-validation (Hungarian Emotion Dataset). To measure performance, we employed the Unweighted Average Recall (UAR) metric, being equivalent of the mean of the class-wise recall values. Following preliminary tests, we employed downsampling for both corpora as it tends to lead to class-wise balanced predictions, and this improves the UAR scores.
As the baseline paralinguistic solution, we used the 6373 ComParE features (see e.g. [35]), extracted by using the openSMILE tool [7]. The feature set includes energy, spectral, cepstral (MFCC) and voicing related low-level descriptors (LLDs), from which specific functionals (e.g. mean, standard deviation, percentiles, peak statistics, etc.) are computed to provide utterance-level feature values.
Furthermore, we hypothesized that it might turn out to be beneficial to combine the two approaches (in our case, feature sets). For such a fusion, there are two common approaches: in the first one, called early fusion, we concatenate the two or more feature sets, and we train a common machine learning model on the fused feature vectors. The drawback of this approach might be that the different types of features might require different meta-parameters (e.g. C for SVM) for optimal performance and that we are required to train a large number of classifier models on huge feature sets. In contrast, in late fusion we train separate classifier models on the different types of feature vectors and merge the predictions instead. This latter approach also has the advantage that we actually do not need to train any further SVMs, therefore we opted for this solution. We realized late fusion by taking the weighted mean of the posterior estimates obtained by using the two types of features (i.e. the ComParE feature set and Fisher vector representation);
combination weights were determined on the development set (FAU AIBO) or in cross-validation (Hungarian Emotion) with 0.05 increments as the ones leading to the highest UAR score.
4 Results
Figure 2
Measured UAR values on the development set of the FAU AIBO dataset as a function of N
Fig. 2 shows the UAR scores obtained as a function of Gaussian components for the development set of the FAU AIBO dataset. Clearly, we got the lowest scores when we just relied on the original 13 MFCC vectors; by adding the first-order derivatives, the UAR values increased, while further utilizing the ΔΔs usually brought an additional slight improvement. Regarding the number of Gaussians, relatively low values (i.e. N=8 and N=16) proved to be optimal on the development set.
Figure 3
Measured UAR values on the test set of the FAU AIBO dataset as a function of N
The UAR scores on the test set (see Fig. 3) show a similar tendency: here relying only on the 13 MFCC components led to the lowest scores as well, while there were only slight differences among the performance between the models using 26 and 39 frame-level attributes. We observe optimal performance with the settings N
= 8 or N = 16, while larger values (especially N = 128) indicate the presence of overfitting. Of course, now we were interested only in the tendency of the UAR scores on the test; optimal N value, being the meta-parameter of the Fisher Vectors method, is always chosen based on development set performance.
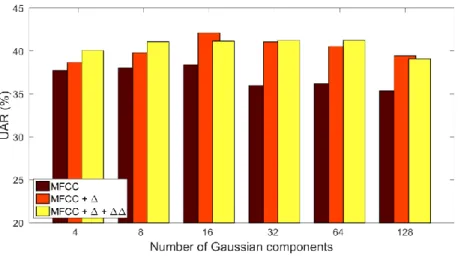
Examining the UAR values measured in cross-validation for the Hungarian Emotion corpus (see Fig. 4), we can see similar trends as we found on the FAU AIBO database: using just the raw MFCC values led to the lowest scores, while the difference between the performance of the MFCC+Δ and the MFCC+Δ+ΔΔ configurations was usually much smaller. The optimal GMM size was N = 16 for the latter two configurations, while N = 4 led to the highest score for the 13 MFCC components. On the test set (see Fig. 5) the UAR scores behave similarly:
although the highest UAR score for the MFCC+Δ+ΔΔ feature set was measured with N = 64, we obtained similar scores for the cases 4 ≤ N ≤ 32, while in the MFCC+Δ case the optimal value is found at N = 16 both in cross-validation and on the test set.
Figure 4
Measured UAR values in cross-validation on the Hungarian Emotion dataset as a function of N
Figure 5
Measured UAR values on the test set of the Hungarian Emotion dataset as a function of N
Inspecting the best results for each configuration on the test set (see Tables 1 and 2) reinforces our previous findings. Relying on the Fisher vector representation alone even outperformed the results achieved via the standard ComParE feature set, at least in the MFCC+Δ and the MFCC+Δ+ΔΔ cases. Although the best result was achieved by just using the first-order derivatives on the test set, due to the development set/CV scores, we have to rely on the UAR values obtained via all 39 MFCC attributes. The appropriate scores mean improvement of 4% in terms of relative error reduction (RER) for both corpora.
Table 1
Results obtained for the FAU AIBO corpus
Dev Test
Feature Set Size Acc. UAR Acc. UAR
ComParE functionals (baseline) 6373 44.5% 44.1% 35.9% 37.8%
Fisher Vectors (MFCC) 208 38.8% 36.7% 33.9% 36.2%
Fisher Vectors (MFCC+Δ) 832 44.6% 41.5% 42.2% 41.7%
Fisher Vectors (MFCC+Δ+ΔΔ) 624 46.7% 43.3% 40.1% 40.2%
ComParE + FV MFCC 6581 46.2% 45.0% 37.7% 40.3%
ComParE + FV MFCC+Δ 7205 47.4% 46.2% 41.4% 43.0%
ComParE + FV MFCC+Δ+ΔΔ 6997 48.1% 46.4% 40.3% 43.1%
Combining these FV-based models with the ones trained on the ComParE feature set yielded further improvements in the UAR values. For the FAU AIBO corpus, relying on all 39 attributes yielded similar scores as omitting the second-order derivatives did, leading to 9% improvements in RER on the test set (UAR scores of 43.0% and 43.1%). For the Hungarian Emotion dataset, using just the first- order derivatives (and the MFCC vectors) proved to be slightly more efficient both in cross-validation and on the test set (62.1% and 68.5%), leading to an RER score of 16% on the latter subset, but using the whole 39-sized MFCC vector led to quite similar UAR scores (61.7% and 68.1%, cross-validation and test sets, respectively).
Table 2
Results obtained for the Hungarian Emotion corpus
CV Test
Feature Set Size Acc. UAR Acc. UAR
ComParE functionals (baseline) 6373 63.4% 58.4% 72.9% 62.5%
Fisher Vectors (MFCC) 208 57.3% 54.5% 72.5% 56.5%
Fisher Vectors (MFCC+Δ) 832 59.7% 59.3% 73.6% 68.0%
Fisher Vectors (MFCC+Δ+ΔΔ) 624 63.4% 60.5% 70.7% 63.9%
ComParE + FV MFCC 6581 64.7% 60.0% 73.6% 64.0%
ComParE + FV MFCC+Δ 7205 65.5% 62.1% 78.9% 68.5%
ComParE + FV MFCC+Δ+ΔΔ 6997 66.5% 61.7% 77.9% 68.1%
Notice that the Fisher vector representations were also quite compact: although we tested them by even using 128 Gaussian components, we always got the best scores with N=4, N=8 or N=16 values. Even though we have two attributes for each low-level feature (e.g. MFCC) dimension, the largest feature vector just consisted of 1248 attributes. Although (based on our experiments) for optimal performance we also need to utilize the ComParE feature set with its 6k+
attributes, this is also true for the Bag-of-Audio-Words representation; which in contrast tends to consist of thousands or even ten thousand features [27, 32].
Figure 6
The normalized confusion matrix on the test set of the FAU AIBO corpus when using the ComParE functionals (left, UAR: 37.8%) and when using the combination of the models trained on the ComParE
functionals and on the Fisher Vector (MFCC+Δ+ΔΔ) features (right, UAR: 43.1%)
Examining the normalized confusion matrix obtained on the test set of the FAU AIBO corpus using the ComParE functionals feature set (see the left-hand side of Fig. 6), we can see that only the classes Angry, Neutral and Peaceful could be identified at a relatively good rate, as the remaining two categories (Emphatic and Rest) had recall scores of 27.9% and 26.0%. Of course, this behaviour was reflected in the overall UAR score of 37.8%, but this only indicates that automatic emotion detection from speech is not a straightforward task at all. However, examining the normalized confusion matrix corresponding to the combination of this model with the one employing the Fisher Vectors representation (MFCC+Δ+ΔΔ) (see the right-hand side of Fig. 6), we can see that emotion identification improved noticeably. Although for the Rest category we now got a lower recall value (22.7%), the scores improved for the other four classes.
Specifically, the recall of the Emphatic emotion category improved from 27.9% to 43.6%. Overall, we can see that the increase in the UAR score (from 37.8% to 43.1%, meaning a relative error score of 9%) did not come from a more accurate detection of one or two specific emotion categories, but it reflects an improved general performance.
In the case of the Hungarian Emotion corpus (see Fig. 7) we can see similar trends: using the ComParE functionals as features (left-hand side) led to a good performance on the Anger and Neutral categories, while on the Joy and Sadness emotions detection was mediocre (recall scores of 47.4% and 50.0%). Combining this model with the one trained on Fisher Vectors (MFCC+Δ frame-level attributes, the right-hand side of Fig. 7) markedly improved the recall value of the Joy and Neutral classes, while for the two remaining categories the recall values dropped to a slight extent. Overall, the combination of the two approaches led to a more balanced performance than using solely the standard ComParE functionals.
Figure 7
The normalized confusion matrix on the test set of the Hungarian Emotion corpus when using the ComParE functionals (left, UAR: 62.5%) and when using the combination of the models trained on the
ComParE functionals and on the Fisher Vector (MFCC+Δ) features (right, UAR: 68.5%)
5 Applying Principal Component Analysis
Recall that, when we utilized GMMs to model the distribution of the frame vectors, we assumed that the MFCCs have quasi-orthogonal components. Next, we will verify whether this assumption holds, or we can actually improve the classification performance by enforcing our frame-level feature vectors to actually be decorrelated. To do this, we applied Principal Component Analysis (PCA, [15]). Therefore, next, we will present our experiments with first transforming the MFCC frame-level feature vectors by PCA, and applying the FV procedure in the second step. The rest of our classification pipeline was identical to our previous experiments. As is standard for applying PCA, we decided to keep 95% and 99%
of the total information; this led to 33 and 38 dimensional vectors, for 95% and 99%, respectively. Note that we performed these experiments solely on the Hungarian Emotion corpus.
Figure 8 shows the UAR values obtained in cross-validation; for reference, we also displayed the scores corresponding to the MFCC+Δ+ΔΔ case. Clearly, there are no huge differences among the three cases; in particular, in the 4 ≤ N ≤ 16 interval, we got higher scores without applying PCA. When 32 ≤ N ≤ 64, we obtained roughly the same scores, and PCA led to better performance only for N = 128. On the test set, the differences were even smaller: in fact, we can observe a significant difference only in the N = 128 case.
Figure 8
Measured UAR values in cross-validation on the Hungarian Emotion dataset as a function of N after applying Principal Component Analysis
Figure 9
Measured UAR values on the test set of the Hungarian Emotion dataset as a function of N after applying Principal Component Analysis
Table 3 contains the best UAR performances of the tested approaches in cross- validation and the corresponding scores on the test set. We can see that the UAR values are indeed quite similar to each other: they lie in the range 54.4-60.5% in cross-validation and 63.9-65.9% on the test set. After combination, these values rose to 61.0-61.7% and to 66-68.1%, cross-validation and test set, respectively.
Table 3
Results obtained for the Hungarian Emotion corpus after applying Principal Component Analysis
CV Test
Feature Set Size Acc. UAR Acc. UAR
ComParE functionals (baseline) 6373 63.4% 58.4% 72.9% 62.5%
Fisher Vectors (MFCC+Δ+ΔΔ) 624 63.4% 60.5% 70.7% 63.9%
Fisher Vectors (MFCC + PCA 95%) 2112 62.6% 57.0% 75.4% 64.1%
Fisher Vectors (MFCC + PCA 99%) 9728 59.0% 54.4% 78.9% 65.9%
ComParE + FV MFCC+Δ+ΔΔ 6997 66.5% 61.7% 77.9% 68.1%
ComParE + FV MFCC + PCA 95% 8485 67.4% 61.0% 76.4% 68.3%
ComParE + FV MFCC + PCA 99% 16101 67.0% 61.2% 78.9% 66.0%
Even though the best single UAR score belongs to the MFCC + PCA 99% case, and the best combined one to the ComParE + FV MFCC + PCA 95% model combination, these models obviously have a suboptimal cross-validation performance. Furthermore, their advantage compared to the non-PCA model is not really convincing even for the test set, especially in the combined case: the 0.2%
absolute difference is clearly not statistically significant. When we also note that, after PCA, the number of calculated features rose by 230-1400%(!), and that it was more beneficial to discard the ΔΔ values and rely only on the MFCC+Δ frame-level attributes, it is clear that overall it is not really worth applying PCA on the MFCC vectors. To experiment with just discarding the first and second-order derivatives before fitting the Gaussian Mixture Models (see Section 4) seems to be a more efficient approach, as this led both to better performance and to a more compact machine learning model.
Conclusions
In this study, we performed audio-based emotion classification by employing the Fisher vector (FV) feature representation approach, originally developed for image processing. We adapted the original workflow by using MFCCs as low- level features, modeling their distribution via GMMs, and applying Support Vector Machines with a linear kernel for utterance-level classification. To demonstrate the effectiveness of this approach, we performed our experiments on two emotion recognition datasets, one containing German and one Hungarian speech. Our results indicate that Fisher vectors are indeed descriptive representations for audio just as well as for images, as the Unweighted Average Recall scores obtained were slightly higher for both corpora than those got via the ComParE feature set, used as our baseline. More importantly, the combination of the two utterance representation techniques brought further improvements, leading to reductions of 9-16% in the error scores. From our results, the FV representation is also quite compact, as the extracted feature sets contained 104-1248 attributes overall. This is much smaller than either the ComParE feature set or a typical Bag- of-Audio-Words representation.
Acknowledgements
This research was partially funded by the Ministry of Human Capacities, Hungary (grant no. TUDFO/47138-1/2019-ITM), and by the National Research, Development and Innovation Office of Hungary via contract NKFIH FK-124413.
Gábor Gosztolya was also funded by the János Bolyai Scholarship of the Hungarian Academy of Sciences and by the Hungarian Ministry of Innovation and Technology New National Excellence Program ÚNKP-19-4.
References
[1] M. B. Akcay and K. Oguz, “Speech emotion recognition: Emotional models, databases, features, preprocessing methods, supporting modalities, and classifiers,” Speech Communication, Vol. 116, pp. 56-76, Jan 2020 [2] F. Burkhardt, M. van Ballegooy, K.-P. Engelbrecht, T. Polzehl, and J.
Stegmann, “Emotion detection in dialog systems: Applications, strategies and challenges,” in Proceedings of ACII, Amsterdam, The Netherlands, Sep 2009, pp. 985-989
[3] A. Bosch, A. Zisserman, and X. Munoz, “Image classification using random forests and ferns,” in Proceedings of ICCV, Rio de Janeiro, Brazil, Oct 2007, pp. 1-8
[4] C.-C. Chang and C.-J. Lin, “LIBSVM: A library for support vector machines,” ACM Transactions on Intelligent Systems and Technology, Vol. 2, pp. 1-27, 2011
[5] G. Csurka, C. Dance, L. Fan, J. Willamowski, and C. Bray, “Visual categorization with bags of keypoints,” in Proceedings of Workshop on Statistical Learning in Computer Vision, ECCV, Prague, Czech Republic, May 2004, pp. 1-22
[6] G. Csurka and F. Perronnin, “Fisher vectors: Beyond Bag-of-Visual-Words image representations,” in Proceedings of VISIGRAPP, Angers, France, May 2010, pp. 28-42
[7] F. Eyben, M. Wöllmer, and B. Schuller, “Opensmile: The Munich versatile and fast open-source audio feature extractor,” in Proceedings of ACM Multimedia, 2010, pp. 1459-1462
[8] G. Gosztolya, R. Busa-Fekete, T. Grósz, and L. Tóth, “DNN-based feature extraction and classifier combination for child-directed speech, cold and snoring identification,” in Proceedings of Interspeech, Stockholm, Sweden, Aug 2017, pp. 3522-3526
[9] G. Gosztolya, T. Grósz, G. Szaszák, and L. Tóth, “Estimating the sincerity of apologies in speech by DNN rank learning and prosodic analysis,” in Proceedings of Interspeech, San Francisco, CA, USA, Sep 2016, pp. 2026- 2030
[10] G. Gosztolya, T. Grósz, and L. Tóth, “General Utterance-Level Feature Extraction for Classifying Crying Sounds, Atypical & Self-Assessed Affect and Heart Beats,” in Proceedings of Interspeech, Hyderabad, India, Sep 2018, pp. 531-535
[11] J. Han, Z. Zhang, M. Schmitt, Z. Ren, F. Ringeval, and B. W. Schuller,
“Bags in bag: Generating context-aware bags for tracking emotions from speech,” in Proceedings of Interspeech, Hyderabad, India, Sep 2018, pp.
3082-3086
[12] M. S. Hossain and G. Muhammad, “Cloud-assisted speech and face recognition framework for health monitoring,” Mobile Networks and Applications, Vol. 20, No. 3, pp. 391-399, 2015
[13] T. S. Jaakkola and D. Haussler, “Exploiting generative models in discriminative classifiers,” in Proceedings of NIPS, Denver, CO, USA, 1998, pp. 487-493
[14] J. James, L. Tian, and C. Inez Watson, “An open source emotional speech corpus for human robot interaction applications,” in Proceedings of Interspeech, Hyderabad, India, Sep 2018, pp. 2768-2772
[15] I. T. Jolliffe, Principal Component Analysis. Springer-Verlag, 1986
[16] H. Kaya, T. Özkaptan, A. A. Salah, and F. Gürgen, “Random discriminative projection based feature selection with application to conflict recognition,” IEEE Signal Processing Letters, Vol. 22, No. 6, pp. 671-675, 2015
[17] H. Kaya, A. A. Karpov, and A. A. Salah, “Fisher Vectors with cascaded normalization for paralinguistic analysis,” in Proceedings of Interspeech, 2015, pp. 909-913
[18] H. Kaya and A. A. Karpov, “Efficient and effective strategies for cross- corpus acoustic emotion recognition,” Neurocomputing, Vol. 275, pp.
1028-1034, Jan 2018
[19] L. Kerkeni, Y. Serrestou, K. Raoof, M. Mbarki, M.A. Mahjoub, and C.
Cleder, “Automatic speech emotion recognition using an optimal combination of features based on EMD-TKEO,” Speech Communication, Vol. 114, pp. 22-35, Nov 2019
[20] X. Li and M. Akagi, “Improving multilingual speech emotion recognition by combining acoustic features in a three-layer model,” Speech Communication, Vol. 110, pp. 1-12, July 2019
[21] H. Lim, M. J. Kim, and H. Kim, “Robust sound event classification using LBP-HOG based Bag-of-Audio-Words feature representation,” in Proceedings of Interspeech, Dresden, Germany, 2015, pp. 3325-3329 [22] D. G. Lowe, “Distinctive image features from scale-invariant keypoints,”
International Journal of Computer Vision, Vol. 60, No. 2, pp. 91-110, 2004
[23] H. Meinedo and I. Trancoso, “Age and gender classification using fusion of acoustic and prosodic features,” in Proceedings of Interspeech, Makuhari, Chiba, Japan, 2010, pp. 2818-2821
[24] P. J. Moreno and R. Rifkin, “Using the Fisher kernel method for web audio classification,” in Proceedings of ICASSP, Dallas, TX, USA, 2010, pp.
2417-2420
[25] D. Norhafizah, B. Pg, H. Muhammad, T. H. Lim, N. S. Binti, and M.
Arifin, “Detection of real-life emotions in call centers,” in Proceedings of ICIEA, Siem Reap, Cambodia, June 2017, pp. 985-989
[26] S. Pancoast and M. Akbacak, “Bag-of-Audio-Words approach for multimedia event classification,” in Proceedings of Interspeech, Portland, OR, USA, Sep 2012, pp. 2105-2108
[27] F. B. Pokorny, F. Graf, F. Pernkopf, and B. W. Schuller, “Detection of negative emotions in speech signals using bags-of-audio-words,” in Proceedings of ACII, Sep 2015, pp. 1-5
[28] L. Rabiner and B.-H. Juang, Fundamentals of Speech Recognition. Prentice Hall, 1993
[29] V. Rajan, A. Brutti, and A. Cavallaro, “ConflictNET: End-to-end learning for speech-based conflict intensity estimation,” IEEE Signal Processing Letters, Vol. 26, No. 11, 1668-1672, 2019
[30] J. Sánchez, F. Perronnin, T. Mensink, and J. Verbeek, “Image classification with the Fisher vector: Theory and practice,” International Journal of Computer Vision, Vol. 105, No. 3, pp. 222-245, 2013
[31] M. Schmitt, C. Janott, V. Pandit, K. Qian, C. Heiser, W. Hemmert, and B.
Schuller, “A Bag-of-Audio-Words approach for snore sounds' excitation localisation,” in Proceedings of Speech Communication, Oct 2016, pp. 89- 96
[32] M. Schmitt, F. Ringeval, and B. Schuller, “At the border of acoustics and linguistics: Bag-of-Audio-Words for the recognition of emotions in speech,” in Proceedings of Interspeech, San Francisco, CA, USA, 2016, pp.
495-499
[33] B. Schölkopf, J. C. Platt, J. Shawe-Taylor, A. J. Smola, and R. C.
Williamson, “Estimating the support of a high-dimensional distribution,”
Neural Computation, Vol. 13, No. 7, pp. 1443-1471, 2001
[34] B. Schuller, S. Steidl, and A. Batliner, “The INTERSPEECH 2009 emotion challenge,” in Proceedings of Interspeech, 2009, pp. 312-315
[35] B. W. Schuller, S. Steidl, A. Batliner, A. Vinciarelli, K. Scherer, F.
Ringeval, M. Chetouani, F. Weninger, F. Eyben, E. Marchi, H. Salamin, A.
Polychroniou, F. Valente, and S. Kim, “The INTERSPEECH 2013 Computational Paralinguistics Challenge: Social signals, Conflict, Emotion,
Autism,” in Proceedings of Interspeech, Lyon, France, Sep 2013, pp. 148- 152
[36] B. W. Schuller, S. Steidl, A. Batliner, P. B.Marschik, H. Baumeister, F.
Dong, S. Hantke, F. Pokorny, E.-M. Rathner, K. D. Bartl-Pokorny, C.
Einspieler, D. Zhang, A. Baird, S. Amiriparian, K. Qian, Z. Ren, M.
Schmitt, P. Tzirakis, and S. Zafeiriou, “The INTERSPEECH 2018 computational paralinguistics challenge: Atypical & self-assessed affect, crying & heart beats,” in Proceedings of Interspeech, Hyderabad, India, Sep 2018
[37] B. Schuller, F. Weninger, Y. Zhang, F. Ringeval, A. Batliner, S. Steidl, F.
Eyben, E. Marchi, A. Vinciarelli, K. R. Scherer, M. Chetouani, and M.
Mortillaro, “Affective and behavioural computing: Lessons learnt from the First Computational Paralinguistics Challenge,” Computer Speech &
Language, Vol. 53, pp. 156-180, Jan 2019
[38] S. Steidl, “Automatic Classification of Emotion-Related User States in Spontaneous Children's Speech,” Logos Verlag, Berlin, 2009
[39] D. Sztahó, V. Imre, and K. Vicsi, “Automatic classification of emotions in spontaneous speech,” in Proceedings of COST 2102, Budapest, Hungary, 2011, pp. 229-239
[40] Y. Tian, L. He, Z. yi Li, W. lan Wu, W.-Q. Zhang, and J. Liu, “Speaker verification using Fisher vector,” in Proceedings of ISCSLP, Singapore, Singapore, 2014, pp. 419-422
[41] A. Vedaldi and B. Fulkerson, “Vlfeat: an open and portable library of computer vision algorithms,” in Proceedings of ACM Multimedia, 2010, pp. 1469-1472
[42] K. Vicsi and D. Sztahó, “Recognition of emotions on the basis of different levels of speech segments,” Journal of Advanced Computational Intelligence and Intelligent Informatics, Vol. 16, No. 2, pp. 335-340, 2012 [43] L. Vidrascu and L. Devillers, “Detection of real-life emotions in call
centers,” in Proceedings of Interspeech, Lisbon, Portugal, Sep 2005, pp.
1841-1844
[44] S. Young, G. Evermann, M. J. F. Gales, T. Hain, D. Kershaw, G. Moore, J.
Odell, D. Ollason, D. Povey, V. Valtchev, and P. Woodland, The HTK Book. Cambridge, UK: Cambridge University Engineering Department, 2006
[45] Z. Zajíc and M. Hrúz, “Fisher vectors in PLDA speaker verification system,” in Proceedings of ICSP, Chengdu, China, 2016, pp. 1338-1341