Route Choice Estimation Based on Cellular Signaling Data
Tamás Tettamanti
1, Hunor Demeter
2, István Varga
11 Department of Control and Transport Automation, Budapest University of Technology and Economics
Bertalan L. u. 2, H-1111 Budapest, Hungary
E-mail: tettamanti@mail.bme.hu; ivarga@mail.bme.hu
2 Nokia Siemens Networks, CTO Research SWS M2M Group Köztelek u. 6, H-1092 Budapest, Hungary
E-mail: hunor.demeter@nsn.com
Abstract: The rapid growth of mobile phone communications has induced novel and emerging technologies in the past decades. Signaling data of cellular phones can be used as valuable information for state-of-the-art traffic applications especially in urban areas.
The paper focuses on the applicability for estimating the traces of traveling mobiles in the transportation system. By observing anonym mobile phones, typical route choices can be determined and thus other traffic characteristics can be obtained. These information may serve as efficacious basis for transportation forecasting and planning, traffic control measures or even for real-time route guidance.
Keywords: cellular network; Voronoi tessellation; handover; location update; mobile phone; estimation; route choice; traffic assignment
1 Introduction
If a mobile phone (terminal) is moving in its cellular network different types of signaling events are generated due to the principles of the radio frequency based telecommunication. The location data of terminals can be exploited for various goals. One of the potential applications is represented by road traffic related use.
A large number of patents and papers relevant to this matter has been published in recent decades. One of the earliest paper investigating mobile location technique is presented by [1]. Without attempting to provide a detailed survey, we refer to some interesting research articles which are related to traffic applications based on radio signaling data. The studies are mostly focusing on two research directions.
On the one hand, measurement and estimation technologies of the most important traffic parameters are investigated: speed, traffic flow, travel time, origin- destination (OD) traffic flow. On the other hand, the publications concern
methodologies for Intelligent Transportation Systems (ITS): navigation service, route guidance, incident detection, road monitoring, road use charging, traffic information service. [2] and [3] suggest methods of tracing a mobile by evaluating subsequent signal strength measurements to different base stations of GSM system by applying proper estimation methods. [4] discusses several map matching techniques (semi-deterministic algorithms, probabilistic, and fuzzy-logic-based algorithms) to reveal the trajectory of a vehicle from the point of view of the positioning sensors. [5] investigates the travel time estimation problem on freeways by using cell phones as probes. The potential of OD matrix estimation from mobile phone data is demonstrated by [6] with pilot study results. [7]
proposes a method for real-time estimation of traffic flow and density on motorways. [8] provides a review of measurement concepts of traffic variables by using GSM network. [9] and [10] present advanced methodologies for cellular data based ITS applications.
These papers discuss the whole range of potential traffic applications. The problem of suitable route choice estimation without propagation modeling and 3D environment models, however, is not investigated. In urban road traffic network the route choice behavior of vehicles is a real challenge. Even if a series of proper signaling data can be obtained from the mobile network concerning a given traveler the exact match with the road links is not straightforward. The paper proposes a practical approach to estimate route choices of travelers by associating mobile phone data with traffic assignment.
The layout of the paper is as follows. First, some relevant preliminaries of the cellular communication system are provided. After the introductory sections the route choice estimation problem of traveling mobile is introduced. The filtering of signaling events and traffic assignment technique is described preparing the advised solution. Path estimation is proposed by deviation calculation concerning the results of appropriate route assignment. An application example with simulation study is provided on the basis of real-world test measurements. Finally, summary concludes the paper.
2 Preliminaries
The section aims to introduce the basic elements used in the paper. Handover (HO) and location area update (LAU) signaling events are briefly presented.
Furthermore, the Voronoi tessellation based modeling for mobile network is also described.
2.1 Cellular Signaling Events in Mobile Network
A GSM telecommunication network consists of radio cells. A cell represents geographic coverage area of a base transceiver station. The main task of a base
station is to realize wireless communication between the terminal and the network.
A set of base stations (tens or even hundreds of them) belongs to a location area (LA). A traveling mobile phone generates several types of signaling events depending on its behavior. The cell change and LA change are the most frequent and thus the most significant occurrences generating HO and LAU events. A HO is reported when a phone call in progress is redirected from the current cell and its used channel to a new cell and channel. In inactive (idle) mode a LAU is generated when a terminal enters a new location area on location area crossing.
The terminal must also perform LAU periodically even if it is in the same area.
The main potential of the signaling events is the opportunity to use them without any additional infrastructure. As the terminals automatically report HO/LAU events to the communication system, the cell phone operator may exploit these data (as server-side processing). The possible applications of the HO/LAU reports have been widely investigated, e.g. in the papers referred in Section 1. To exploit the mobility events, first of all, the monitoring and collecting of signaling data must be realized. Several monitoring methods exist, which can be classified as active, passive, client-side, server-side, or third party solutions. A detailed survey on monitoring possibilities is provided by [11].
Nevertheless, it has to be noted that HO events are generated only if the mobile phone is active, i.e. a call is in progress. In idle mode, only LAU reports are generated, which are also valuable but infrequent data. Location area crossings are rather far from each other (even tens of kilometers). Thus, in urban area several phone users (subscribers) may be not observable. A possible solution can be the artificial generation of HO/LAU events by the operator at given locations.
Naturally, the legal aspects must also be taken into consideration and made clear when mobility data of phone users are aggregated. Technically, the anonymity of subscribers can be ensured for privacy protection.
2.2 Modeling Cellular Phone Network
The use of mobile signaling data requires a suitable model of the cellular network.
This is a big challenge as the cells do not form circles. Furthermore, they overlap each other to a greater or lesser extent especially in urban areas. Nevertheless, a practical approach is the application of the Voronoi tessellation method [12], [13].
If the transceiver antenna coordinates are available the geographic coverage area of the cells can be estimated. The Voronoi partitioning represents a special decomposition (convex polygons) of a given plane with
n
generator points. Each generator is associated with a corresponding Voronoi cell. Practically, a Voronoi polygon is the set of all points where each point is closer to its generator than to any other generator in the given plane. Obviously, the locations of transceiver antennas may serve as the generating points for the tessellation. Figure 1 shows the basic concept of the modeling with Voronoi cells. The circles depict the coverage area of the base stations.Figure 1
Mobile cells modeled by Voronoi polygons
The area of influence of each base station can be easily delimited without the knowledge of the physical aspects of the communication (e.g. radio wave propagation, interference, etc.). The locations of antennas are only taken into consideration. Therefore, Voronoi tessellation may provide an efficient method to trace the spatial locomotion of a call, e.g. by observing mobile signaling events.
Nevertheless, the drawbacks of this approach must also be mentioned. The Voronoi based modeling applies two assumptions. It is hypothesized that the power of all transceiver antennas are identical in the given plane. Furthermore, the effects of spatial objects (such as buildings, vehicles, etc.) are neglected. A possible solution to improve the accuracy of the tessellation was proposed by [12]
and [14]. If the power threshold assigned for each base station is known, a multiplicatively weighted Voronoi diagram can be created. Thus, the different transmitted signal strengths of the antennas can be taken into account.
3 Route Choice Estimation
The route choice estimation problem is the main aim of this paper. If the Voronoi diagram of the mobile network is known and mobile signaling events are captured, a potential solution is provided by applying the route assignment (an efficient tool of traffic engineering practice).
3.1 The Problem of the Accurate Determination of Mobile Traces
HO report contains the codes of the previous and the new cell as well. In case of LA change LAU event gives information on previous LA and the new cell. In Section 2.2 the Voronoi tessellation was proposed as an efficient modeling
approach to identify cells in the mobile network. If HO/LAU signaling data are available and it is possible to aggregate them, the routes of the subscribers can be estimated. The estimation, however, is not straightforward especially in dense road traffic network, i.e. in urban areas. Figure 2 shows an example in Budapest by assuming a given path between two locations in District 9 and 11.
Figure 2
The ideal sequence of Voronoi polygons generated by a traveling terminal
The base station data (used here and in the following parts) were gathered from the OpenCellID project's database (www.opencellid.org). The Voronoi tessellation (black lines) was computed concerning one of the Hungarian mobile operator. The tessellation was carried out easily by Quantum GIS, software of another open source project (www.qgis.org). The red dotted line shows the trip of the subscriber. Figure 2 represents that one cell may cover several road links.
Therefore, if only HO/LAU reports are available the trace of the subscribers cannot be unambiguously determined.
3.2 Filtering HO Events
Beyond the problem introduced in the previous section other difficulties must be considered as well. Figure 2 demonstrates an ideal case where a clear sequence of Voronoi cells can be observed in time and space. Nevertheless, this is not the case in practice for several reasons, e.g. interference effect, varying signal strength,
load of the network. Due to the intra-cell effect the cells may show incoherent order. Intra-cell HO is a special signaling event when only the used channel changes during the handover and the cell remains the same. Another potential problem may be caused by short-period cell changes which occur the ping-pong HO effects. In case of ping-pong HO the terminal is “bouncing” quickly between two base stations back and forth. A similar effect is the rapid cell change representing short-period cell transitions among multiple cells. This may be possibly caused by reason of faulty coverage of base stations.
As consequence, it is worth to filter incoherent HO events mentioned above.
Filtered handovers result in better sequence of cells which is more convenient for route choice estimation as well. Figure 3 displays the chain of Voronoi cells after filtering for the OD pair denoted by Fig. 2. The data was gathered by the Mobile Quality Analyzer (MQA) software developed by Nokia Siemens Networks. MQA logged all HO events during the trip. Therefore, Fig. 3 shows a realistic version of the ideal case displayed by Fig. 2.
Figure 3
The chain of filtered Voronoi polygons generated by a moving terminal
Some remarks concerning the measurement results must be done. The generated sequence of the mobile phone is semi-deterministic. For several reasons the handovers may be produced diversely on the same path. Typically, moving obstacles (e.g. bus in the other lane), weather conditions, or load of the network may affect the wave propagation resulting in different signaling events.
Nevertheless, the main characteristic of the sequence is able to reflect the trip.
3.3 Traffic Assignment
A potential solution to the problem introduced in Section 3.1 is the application of traffic assignment methods to assist the mobile signaling data. The classic four- step road traffic forecasting consists of trip generation, trip distribution, modal split, and route assignment [15], [16]. Trip generation aims to define the total number of trips generated by the set of
N
origins (zones or nodes) and attracted by the set ofM
destinations within the study area. The trip distribution step intends to predict the number of trips concerning each OD pair, i.e. construct the trip (OD) matrix. The estimation of modal split gives the percentage of travelers using a particular type of transportation (public transport, private cars, etc.). The last element of the traffic forecasting process is the distribution of traffic among all related origins and destinations, i.e. selection of potential paths in the available transportation network. Several assignment algorithms have been elaborated since the 1950s. The basic classification of traffic assignments may be done by the ability of considering time-varying parameters. Static or time-independent assignment deals with traffic demand assumed to be essentially constant. On the other hand, dynamic assignment methodologies consider time-dependent parameters (e.g. dynamic OD matrix, congestion effects).The basic input parameter for all assignment methods is the OD matrix which can be derived by household surveys or estimated by using traffic counts and historical OD data. Trip matrix may be determined in a static as well as a dynamic fashion (e.g. [17]) corresponding to the available information. Furthermore, several additional input parameters (static and dynamic) can be involved into the process depending on the applied assignment.
3.4 Route Choice Estimation Assisted by Traffic Assignment
The investigated problem in this section can be summarized as follows.
• A cellular phone network is given, represented by Voronoi diagram.
• Mobile signaling events (HO/LAU) can be aggregated and evaluated concerning the network.
• Method is sought for determining the most probable path for each moving subscriber.
By knowing the signaling sequence of a terminal, the corresponding Voronoi cells can be determined, e.g. as displayed in Fig. 3. Naturally, at least two signaling events are needed to create a chain of cells. The first and last HO/LAU reports define the origin and destination cells of the trip forming an OD pair. Thus, the final problem is to determine the exact path of the given OD pair. Nevertheless, due to the scales of the Voronoi cells a plethora of possible routes could be found.
The cell size may be several thousands of square meters. Therefore, a traffic assignment must be carried out concerning the given OD pair.
The first step of assignment is to define the trip matrix which is generally available as result of a proper trip distribution. In assignment procedures the origins and destinations are defined as zones or nodes (e.g. road intersections). In our case it is assumed that such OD information is available. Moreover, the Voronoi polygons can be identified as OD zones. Hence, the corresponding zones are defined as the first and last cells generated by the subscriber. Then, traffic assignment can provide the distribution of traffic, i.e. the number of trips on the assigned paths. The next step is to find the most probable route among the assigned ones. The cells are indexed by
i = 1 , 2 , … m
and the assigned routes byn
j = 1 , 2 , …
. A simple and practical solution is proposed by measuring the squared deviations between each cell and the assigned paths. The measurement means the calculation of the shortest Euclidean distance (d
i,j) from the centroid of the cell (i
) to the given path (j
) such that the drawn line is perpendicular to the tangent of the path. A simple example is shown by Fig. 4.Figure 4
Shortest distance between the centroid and the assigned route
The centroid (denoted by yellow circle) is determined as the center of gravity of the Voronoi cell (blue polygon), which usually does not coincide with the location of the base station. The shortest distance (
d
i,j) to the assigned route (red line) is represented by the green arrow.For each potential path
j
all square deviations can be calculated and summarized as follows:∑
== m
i j i
j d
D
1 2
, . (1)
Thus, to characterize the digressions compared to the assigned routes the squared deviations are used. Finally, the lowest scalar represents the most likely route choice of the subscriber, i.e.
min ( ) D
j ,j = 1 , 2 , … n
. This means that the chosen path among then
assigned routes best fits the Voronoi cells.The proposed method can be applicable in offline or online fashion with appropriate sample interval. Practically, any traffic assignment method can be used to assist the estimation problem. If real-time functioning is realized the use of time-varying OD matrices (if available) can be advantageous. The dynamic traffic assignment may result in more accurate estimates on route choices.
4 Application Example
To validate the elaborated estimation method an application example is presented based on real-world data and test measurements.
4.1 Simulation Environment
The OD pair shown by Fig. 3 is investigated. By using real-world network data and MQA measurements the route choice estimation procedure is realized as detailed in Section 3.4. VISUM software [18] was applied as simulation environment. VISUM is a macroscopic traffic simulator commonly used in practice for diverse problems related to road traffic analysis, forecasting, and planning. The simulator allows GIS-based data management. Hence, the GIS files of the Voronoi diagram of the test field were simply imported into the simulator.
VISUM provides several assignment methods. For the test case the incremental assignment was applied. The incremental approach takes two following basic assumptions: each trip-maker chooses a path which minimizes the travel time, the travel time on a link depends on the link flow. Incremental assignment divides the traffic volumes into fractions to be assigned in steps. In each step, a part of the total demand is assigned based on the all-or-nothing assignment, i.e. assuming constant link travel times.
4.2 Simulation Results
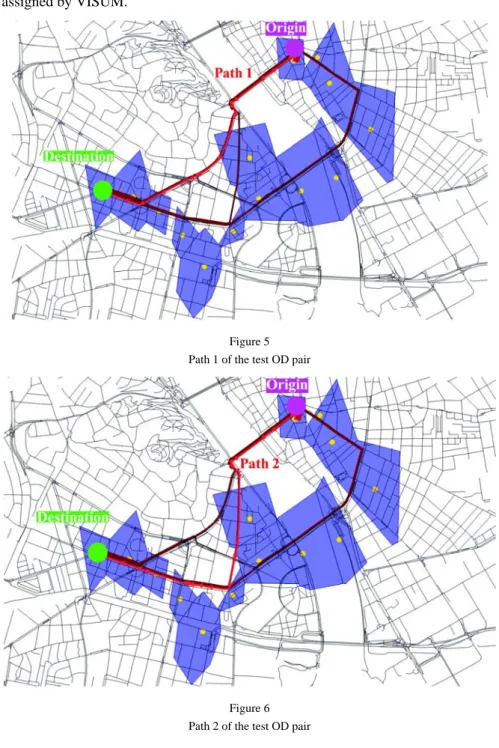
Figures 5-8 represent the results of the incremental assignment calculated in VISUM between the origin and destination zones of the test area. As already
mentioned in the previous section the incremental method assigns a given fraction of the demand in each step. In our case the entire traffic demand of the OD pair was proportionally distributed into four parts. Thus, four distinct paths were assigned by VISUM.
Figure 5 Path 1 of the test OD pair
Figure 6 Path 2 of the test OD pair
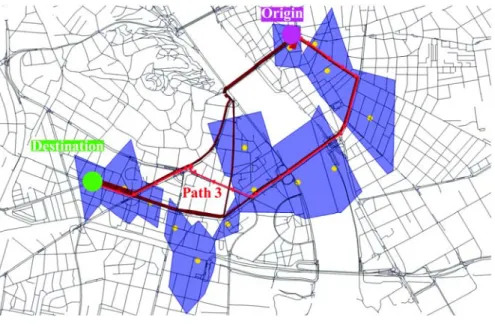
Figure 7 Path 3 of the test OD pair
Figure 8 Path 4 of the test OD pair
The assignment result demonstrates the most likely routes of the test OD pair.
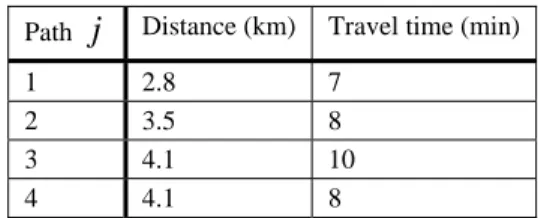
Table 1 contains the main characteristics of the assigned paths.
Table 1
Distances and travel times of the assigned paths Path
j
Distance (km) Travel time (min)1 2.8 7
2 3.5 8
3 4.1 10
4 4.1 8
By assuming that the traveling terminal uses one of these paths, one is able to estimate the route choice of the subscriber. Naturally, the number of potential paths can be increased with the appropriate settings of the traffic assignment. To find the route Eq. 1 must be calculated for all assigned paths (
n = 3
) and cells (m = 14
). Table 2 contains the calculation results for each assigned route.Table 2
Sum of deviations and squared deviations for each assigned path Path
j ∑
= m
i j
d
i 1,
Ratio compared to the
lowest value
∑
=
=
mi j i
j
d
D
1 2
,
Ratio compared to the lowest value
1 6695 3.4 5130283 8.2 2 4519 2.3 3097741 4.9 3 2907 1.5 1305201 2.1
4 1958 1 627122 1
In our example the final result is obvious (see Fig. 8). Nevertheless, the calculation gives the same result, i.e. Path 4 was chosen by the subscriber as
)
4min( D
j= D
was found the lowest among the potential routes.Additionally, to demonstrate the advantage of the squared evaluation the normal summation (
∑
= m
i j
d
i 1, ) is calculated. The ratios of the sums, by taking the lowest value as basis, are also represented for better interpretation. It can be observed that the squared approach reflects the deviations in a more intense way. This property is not apparent in our test case. Nevertheless, it can be advantageous if the applied traffic assignment is configured to produce a more extensive result, i.e. dealing with several potential paths.
Conclusion
The proposed estimation technique was presented through a simple example by measuring a single terminal between one origin and one destination. Nevertheless,
the method can be extended to cover a whole transportation network with multiple OD pairs and traveling terminals. Hence, the technique may constitute a starting step for further potential applications in the traffic engineering field. The future goal of the authors is to investigate the inverse application of the method. If the available mobile signaling events are statistically significant route assignment techniques may be improved. Namely, an advanced dynamic assignment can be provided by using the estimated route choice data of the traveling mobile subscribers.
Moreover, the proposed method can be extended. The route choice estimation may be applied similarly for arbitrary wireless network with regard to the specifics of the given system, e.g. WI-FI, RFID, Bloutooth, etc.
Acknowledgement
The test measurements were carried out by MQA software provided by Nokia Siemens Networks, which is gratefully acknowledged. The work is connected to the scientific program of the “Development of quality-oriented and harmonized R+D+I strategy and functional model at BME” project. This project is supported by the Hungarian Scientific Research Fund (OTKA) through grant No. CNK 78168 and by János Bolyai Research Scholarship of the Hungarian Academy of Sciences which are acknowledged.
References
[1] M. Hata and T. Nagatsu. Mobile Location Using Signal Strength Measurements in a Cellular System. IEEE Transactions on Vehicular Technology, 29(2):245-252, 1980
[2] M. Hellebrandt, R. Mathar, and M. Scheibenbogen. Estimating Position and Velocity of Mobiles in Cellular Radio Networks. IEEE Transaction on Vehicular Technology, 46(1):65-71, 1997
[3] Martin Hellebrandt and Rudolf Mathar. Location Tracking of Mobiles in Cellular Radio Networks. IEEE Transactions on Vehicular Technology, 48:1558-1562, 1999
[4] Y. Zhao. Vehicle Location and Navigation Systems. Artech House Inc, 1997
[5] L. Ygnace, J., C. Drane, Y. B. Yim, and R. de Lacvivier. Travel Time Estimation on the San Francisco Bay Area Network Using Cellular Phones as Probes. Technical report, University of California, Berkeley, 2000 [6] J. White and I. Wells. Extracting Origin Destination Information from
Mobile Phone Data. IEE Conference Publications, 2002(CP486):30-34, 2002
[7] V. Astarita, R. L. Bertini, S. d’Elia, and G. Guido. Motorway Traffic Parameter Estimation from Mobile Phone Counts. European Journal of Operational Research, 175(3):1435-1446, 2006
[8] N. Caceres, J. P. Wideberg, and F. G. Benitez. Review of Traffic Data Estimations Extracted from Cellular Networks. IET Intelligent Transport Systems, 2(3):179-192, 2008
[9] F. Calabrese, M. Colonna, P. Lovisolo, D. Parata, and C. Ratti. Real-Time Urban Monitoring Using Cell Phones: A case study in Rome. IEEE Transactions on Intelligent Transportation Systems, 12(1):141-151, 2011 [10] D. Valerio. Road Traffic Information from Cellular Network Signaling.
Technical Report FTW-TR-2009-003, Telecommunications Research Center Vienna, 2009
[11] D. Valerio, A. D’Alconzo, F. Ricciato, and W. Wiedermann. Exploiting Cellular Networks for Road Traffic Estimation: A survey and a research roadmap. IEEE 69th Vehicular Technology Conference, pp. 1-5, 2009 [12] A.-E. Baert and D. Semé. Voronoi Mobile Cellular Networks: Topological
Properties. In Third International Symposium on Algorithms, Models and Tools for Parallel Computing on Heterogeneous Networks, pp. 29-35, 2004 [13] J. Candia, M. C. González, P. Wang, T. Schoenharl, G. Madey, and A.-L.
Barabási. Uncovering Individual and Collective Human Dynamics from Mobile Phone Records. Journal of Physics A: Mathematical and Theoretical, 41(22):224015, 2008
[14] J. N. Portela and M. S. Alencar. Cellular Network as a Multiplicatively Weighted Voronoi Diagram. In IEEE Consumer Communications and Networking Conference, pp. 913-917, 2006
[15] J. de Dios Ortúzar and L. G. Willumsen. Modelling Transport. ISBN: 978- 0471861102. Wiley, 2001
[16] D. C. Gazis. Traffic Theory. ISBN:1402070950. Springer, 2002
[17] J. J. Brandriss. Estimation of Origin-Destination Flows for Dynamic Traffic Assignment. PhD thesis, MIT, 2001
[18] VISUM 12 User Manual. PTV AG, Karlsruhe, Germany, 2011