Techno-Economic Analysis of Several Energy Storage Options for Off-Grid Renewable Energy Systems
Juan Lata-García
1,2, Francisco Jurado
2, Luis M. Fernández- Ramírez
3, Pablo Parra
1,Víctor Larco
11Department of Electrical Engineering GIPI, Universidad Politécnica Salesiana Guayaquil, Ecuador, jlatag@ups.edu.ec, pparra@ups.edu.ec, vlarco@ups.edu.ec
2 Research Group in Research and Electrical Technology (PAIDI-TEP-152), Department of Electrical Engineering, EPS Linares, University of Jaén, 23700 Linares, Jaén, Spain, fjurado@ujaen.es
3 Research Group in Electrical Technologies for Sustainable and Renewable Energy (PAIDI-TEP-023), Department of Electrical Engineering, EPS Algeciras, University of Cádiz, 11202 Algeciras, Cádiz, Spain, luis.fernandez@uca.es
Abstract: The increase in the production of energy through renewable energies and the reduced predictability of meteorological variables leads to consider reliable energy storage systems to ensure the constant supply of energy and the stabilization of the network. This paper studies four commercial energy storage systems for energy supply to an island by using photovoltaic panels and hydrokinetic turbine as primary energy sources.
The technical characteristics of the energy storage systems are compared with respect to capacity shortage, autonomy storage and expected life storage, and the economic analysis is carried out. The system with li-ion batteries has 15 year expect life storage, the fuel cell based system has the highest storage autonomy 253 hr, and the pump hydro storage system has the lowest levelized cost of energy 0.178 $/kWh with 7 year expect life storage.
Keywords: energy storage; hybrid system; off-grid applications; renewable energy
1 Introduction
The development of renewable energy with marginal costs such as solar or wind energy is achieving increasing funding in liberalized energy markets. Latin America and the Caribbean have 173.25 GW of installed capacity in renewable energy, mainly from three primary sources, hydroelectric (159 GW), wind (12.3 GW) and solar (1.95 GW) developed in recent years [1], [2]. The sizing of a hybrid system and the adequate energy management from intermittent sources is a
complex task due to the poor predictability of the climate. Several researchers have proposed methodologies, mathematical algorithms and software applications to achieve optimal sizing [3]–[5].
Energy storage systems fulfill two main functions. The first function is to store the excess energy when the load does not require it and the second is to smooth the variations in the network as a result of the intermittence of the primary sources or the starting of some equipment. Said [6] presented an overview of different electrical energy storage technologies to reduce these fluctuations.
Currently, there are several types of energy storage commercially available, used in different projects. Among them are the hydraulic pumping, batteries, compressed air, super capacitor and flywheel [7]. Evans [8] reviewed energy storage technologies, comparing parameters such as efficiency, energy capacity, energy density, execution time, capital investment costs, response time, lifespan in years and cycles, and self-discharge. This work concluded that the choice of the storage system depends on the individual requirements, such as the capacity of the system and security in the delivery of energy.
Energy storage systems represent the highest cost in the implementation of hybrid systems. In [9], the authors presented the technical economic analysis of a hybrid system composed of solar panels, hydrokinetic turbine, fuel cell and battery acid lead. The hydrogen subsystem represented 45.5% of the total cost of the hybrid system, whereas the battery bank was 24.9%. Several successful models to solve optimization problems have been reviewed. A stochastic approximation algorithm (SA) was used in [10], which was based on a simultaneous perturbation gradient approximation instead of the standard Kiefer-Wolfowitz approximation. The numerical results obtained showed that the SA algorithm can be more efficient in problems of large dimensions.
An algorithm called Quantum Structure Analyzer 1.0 was presented in [11], whose operating principle was based on the Self-Organization Network by Kohonen. The algorithm was used to examine the grouping of nanostructures that are formed in a process of self-organization, technical parameters such as size, shape and spatial distribution in order to determine the characteristics of the devices. In addition, a grouping algorithm combined with a diffuse inference algorithm was used.
In data mining, the grouping of information is an important technique to create groups of similar objects within a grouping and different object between the different groupings. In [12], the authors presented an improved hybrid algorithm (IABCFCM) based on Fuzzy c-means (FCM), which used data grouping and an Artificial Bee Colony (ABC) algorithm. ABC is based on swarms inspired by the intelligent behavior of bees. The improved IABCFCM algorithm helped the fuzzy c-means cluster to escape from local optima and provide better experimental results in known data sets
.
The problem of optimal sizing of storage systems was investigated in [13]. The authors considered two different storage systems (batteries and hydraulic storage pumped). The solution was achieved through optimization, using a non-linear programming approach in GAMS and considering several operational constraints such as efficiency, depth of discharge, response speed in order to obtain the minimum total cost of the system. It was experimentally tested and a comparative study was carried out. Jacob [14] developed a methodology for sizing a storage system using pinch analysis. The analysis was performed through a simulation of time series of the system, where the generation has to always exceed the load for an isolated hybrid system based on renewable energies. The methodology defined the design space as feasible combinations of storage in the short, medium and long term.
Young [15] studied the sizing of a battery energy storage system (BESS), and used financial, technical and hybrid indicators. The size of the subsystem can be determined by using methods and techniques, such as probabilistic methods, analytical methods, directed, search-based methods and hybrid methods. This work concluded that the proper method for sizing the battery bank is determined by the type of application and the system size.
Commercial programs can be used for the optimal sizing of hybrid systems.
HOMER is a tool widely used by researchers. Through simulations, the number of components required to satisfy the demand is determined to achieve the minimum costs of the system and operation, and to comply with the technical limitations and emissions [16].
So far the research developed has focused on the optimized size of the storage systems for the balance between operation, support and cost, since it is one of the most expensive elements of the system. This work pretends to serve as a useful guidance for selecting energy storage systems for off-grid hybrid renewable energy systems. Furthermore, it provides a techno-economic analysis of four types of storage systems that have been chosen based on the following criteria: ability to provide energy for a long time; widely used technology; 3) fully renewable technology; and 4) new energy backup technique. Economic technical optimization is achieved through the HOMER software, which uses patented
"derivative free" algorithm to identify the lowest energy cost for the hybrid system.
This paper is structured as follows. After the introduction, the different energy storage systems are reviewed in Section 2. Section 3 shows the mathematical model of the components of the system. Section 4 describes the different configurations simulated. The different configurations under study are compared in technical and economic terms in Section 5. Finally, the conclusions of the paper are drawn in Section 6.
2 Energy Storage Systems
In this section, the different types of energy storage systems are reviewed. The delivery of stored energy depends on the needs of the load. The different storage technologies are categorized into short, medium, and long-term storage. In Fig. 1, the duration of the download of the different storage systems in time scale is shown.
Figure 1
Energy storage technologies [14]
2.1 Flywheel Energy Storage
Flywheel energy storage represents an ecological option since it is made of non- hazardous base metals and carbon fibers. It uses a flywheel that rotates at very high speed. Inertia wheels store energy in its kinetic form [15]. Flywheels provide an amount of energy in a short time. The operational life is several million complete cycles of discharge, unlike batteries can reach up to 20 years of useable life [17]. The amount of energy stored is given by Equation (1).
𝐸 =12𝐼 ∙ 𝜔2 (1) Where I is the inertia moment of the steering wheel and ω is the angular velocity.
2.2 Supercapacitor
Supercapacitor is composed of two electrodes in parallel with a dielectric material between them. It differs from the conventional capacitor because of its high capacity and discharge current [18]. Supercapacitors can be charged and discharged quickly. The long cycle of operation without degradation makes it attractive for use. They are mainly used to start motors, actuators and electric vehicles [19].
2.3 Lithium Battery
Lithium battery transforms the chemical energy of its metallic lithium composites into electrical energy through oxidation and reduction reactions. The advantages offered are: 100% efficiency, the highest achieved of all types of batteries; load densities are between 90-190 Wh/kg; and low environmental impact due to their recyclable components.
The main barrier in the extended use of this type of battery is the cost due to the special packaging and the internal overload protection circuit [17]. The electrical storage capacity of a Li-ion battery is limited by the amount of lithium that can be trapped at the battery anode. The lifetime is 3,000 cycles at 80% depth of discharge, the cost is 800-1100 $/kWh [20].
2.4 Lead Acid Battery
Lead-acid batteries are widely used in renewable energy systems and other applications. They are rechargeable batteries and are composed of an anode of metallic lead, a cathode of lead dioxide and an electrolyte of sulfuric acid solution.
Among the advantages that they present are: the cost under 500-150 $/kWh, simplicity in the manufacture, fast electrochemical reaction, and efficiency of 72%. The main disadvantage is the use of heavy metal components, dangerous for the environment. The lifetime is limited. Several types of lead-acid batteries have been developed, such as lead antimony batteries, SLI (starting, lighting and ignition) batteries, valve-regulated lead acid batteries (VRLA), flooded lead acid batteries, lead and calcium batteries, AGM absorbed glass mats batteries, gel cells and deep cycle batteries. The last two are commonly used in renewable energy systems [21].
2.5 Electrolyzer and Fuel Cell
Hydrogen energy storage system is a clean technology. It is an acceptable option for remote communities that are not connected to a conventional network. There is currently a wide variety of commercially available fuel cells (FC). Proton exchange membrane(PEM) type is used for small-scale hybrid systems [22]. The
excess energy produced by the generators feeds the electrolyzer, which is a device that generates hydrogen and oxygen from water. The produced hydrogen is stored in a tank or taken directly to the FC.
2.6 Pumped Hydro Storage
Pumped hydro storage (PHS) is a mature and commercially available technology.
It stores and generates electricity through two water tanks at different heights, and energy produced in excess feeds a pump that sends water from a lower reservoir to an upper reservoir [23].
When the demand is greater than the generation, the water stored in the upper tank passes through a turbine that produces electrical energy. In some cases, pumping systems are based on reversible electric and hydraulic machines. The energy used to pump water from the lower reservoir is obtained by Equation (2).
𝐸𝑝𝑢𝑚𝑝𝑖𝑛𝑔 =𝜌 . 𝑔 . ℎ . 𝑉
𝜂𝑝 (2) where V is the volume of water, h is the height of the upper reservoir, and ηp is the pumping efficiency.
The energy supplied by the generator to the network can be obtained by Equation (3).
𝐸𝑔𝑒𝑛𝑒𝑟𝑎𝑡𝑜𝑟 = 𝜌 . 𝑔 . ℎ . 𝑉. 𝜂𝑔 (3) where ηg is the generator efficiency.
3 Mathematical Model of System under Study
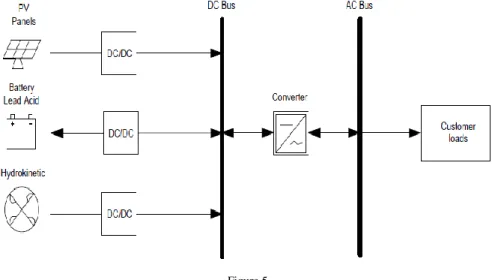
The hybrid systems under study in this work use the following components:
photovoltaic (PV) panels, hydrokinetic (HKT) turbine, batteries, hydrogen system (FC, FC, electrolyzer and tank), pumped hydro storage and electronic power converters. This section describes the mathematical models used to represent the behavior of these components.
3.1 PV Panel
Santay Island receives around 12 hours of sun a day with a high global radiation so that PV energy is a promising source to be used for electrification purposes.
For the modeling of the PV panels, polycrystalline type models CS6K-285M-FG are commercially available, which present the following characteristics: a power of 285 W; an efficiency in standard test conditions (STC) of 17.41%; the open circuit voltage (Voc) is 38.6 Vdc; the short circuit current (Isc) is 9.51 A; the
dimensions (mm) are 1,650-992-40 mm; the capital cost is US$ 300/285 Wp; the replacement cost is US$ 300/285 Wp; the operating and maintenance cost $0 for not having moving parts; and the lifetime is 25 years.
The estimation of the maximum power of the PV generator is an important parameter to consider in the system. The maximum output power of the PV module can be calculated under operating conditions as follows:
𝑃𝑃𝑉= 𝑓𝑃𝑉∗ 𝑌𝑃𝑉∗ 𝐼𝐼𝑇
𝑆 (4) where 𝑓𝑃𝑉 is the reduction factor, which takes into account the losses due to high temperatures, dirt, wiring, that reduce the performance of the panel; 𝑌𝑃𝑉 is the rated capacity of the PV array (kW); 𝐼𝑇 is the total incident radiation on the panel surface (kWh/m²); and 𝐼𝑠 is 1000 W/m².
3.2 HKT Turbine
The energy from the flow of water that surrounds the island can be exploited by a HKT turbine to be converted into electrical energy. In this work, a 5 kW smart monofloat turbine from the manufacturer Smart hydro power was used [24], which present the following characteristics: the dimension are 2640-1120-1120 mm; the rotational speed is 90 to 230 rpm; the weight is 380 kg; the number of rotor blades is 3; the cost of capital is $ 11179; and the cost of operation and maintenance is 100 $/year. The energy generated by the HKT turbine (EHKT) can be calculated as:
𝐸𝐻𝐾𝑇=1
2∗ 𝜌𝑊∗ 𝐴 ∗ 𝑣3∗ 𝐶𝑝,𝐻∗ 𝜂𝐻𝐾𝑇 ∗ 𝑡 (5) where ρWis the water density in kg/m³; ηHKT is the combined HKT-generator efficiency; Cp,His the HKT performance coefficient; is the water flow velocity in m/s; A is the HKT area in m²; and t is the time in s.
3.3 Batteries
Battery consists of electrochemical cells that can convert chemical energy into electrical energy. The energy produced in excess can be stored in the batteries, which is used when there is a peak consumption that cannot be supplied by the renewable generation.
The state-of-charge (SOC) of the battery for the charging and discharging modes can be calculated by [25]:
𝑆𝑂𝐶(𝑡) = 𝑆𝑂𝐶(𝑡 − 1) + 𝐸𝑏𝑎𝑡(𝑡) ∗ 𝜂𝑐𝑏𝑎𝑡
𝑃𝑏𝑎𝑡 ∗ 100 (6) 𝑆𝑂𝐶(𝑡) = 𝑆𝑂𝐶(𝑡 − 1) + 𝐸𝑏𝑎𝑡(𝑡)∗𝜂𝑃 𝑑𝑏𝑎𝑡
𝑏𝑎𝑡 ∗ 100 (7)
where 𝑆𝑂𝐶(𝑡) is the state of charge at time t; 𝑃𝑏𝑎𝑡 is the nominal capacity of the battery; 𝐸𝑏𝑎𝑡 is the power exchange during the time step Δt; and 𝜂𝑐𝑏𝑎𝑡,𝜂𝑑𝑏𝑎𝑡 are the battery charge and discharge efficiency, respectively.
3.4 FC
In this work, a PEM FC is considered for the hydrogen energy storage system. FC uses hydrogen to produce DC electrical energy. PEM FC is one of the best options for distributed generation, since it has advantages such as its low operating temperature, high-power density, longevity, specific power [26].
Different works indicate an initial capital cost of the FC system from $2,000/kW to $6.000/kW. The installation, operational costs and replacement are estimated depending on the power of the system at $3,000, $0.080/h and $2,500 respectively [9].
The electric power output from the FC, Pfc, can be calculated as follow [27]:
𝑃𝑓𝑐= 𝑈𝑆𝑡𝑎𝑐𝑘× 𝐼 = 𝑈𝑆𝐶 × 𝑁𝐶𝐸𝐿𝐿𝑆 × 𝐼 (8) The hydrogen consumption of the FC in one hour can be calculated from the FC power as follows:
𝑞𝐻𝑐𝑜𝑛2 =𝐸 𝑃𝑓𝑐
𝑙𝑜𝑤,𝐻2 ∗ 𝜂𝑡ℎ𝑒𝑟𝑚 ∗ 𝑈𝑓 ∗ 𝜂𝑓𝑐 (9) where 𝑃𝑓𝑐 is the output power supplied by the FC; 𝑈𝑆𝐶is the average single cell voltage; I is the current; 𝐸𝑙𝑜𝑤,𝐻2 is the lower heating value of hydrogen (𝐸𝑙𝑜𝑤,𝐻2
=33.35 kWh/kg); 𝜂𝑡ℎ𝑒𝑟𝑚 is the thermodynamic efficiency (0.98 at 298 K); 𝑈𝑓 is the fuel utilization efficiency and 𝜂𝑓𝑐 is the FC efficiency.
3.5 Electrolyzer
An electrolyzer converts DC electrical energy into chemical energy stored in hydrogen. An electric current drives the decomposition of water, which is fed to the anode, into hydrogen and oxygen. The occurring reactions in a PEM electrolyzer are:
anode 𝐻2𝑂 → 2𝐻++ 1 2𝑂⁄ 2+ 2𝑒− cathode 2𝐻++ 2𝑒−→ 𝐻2
The advantages of PEM electrolyzer are: high voltage efficiency, high current densities, good partial load range, high gas purity, rapid system response. PEM electrolyzers have a conversion efficiency of 40 to 60% similar to alkaline electrolyzers, due to the membrane and noble metals the PEM are more expensive, although promising studies consider an 85% efficiency [28].
The electrical power consumed by the electrolyzer can be calculated as follow:
𝑃𝐸=ṁ𝐻2 × 𝐻𝐻𝑉𝜂 𝐻2
𝐸 (10) where, 𝑃𝐸 is the power consumption of the element; 𝜂𝐸is the electrolyzer efficiency;ṁ𝐻2 is the produced hydrogen mass flow rate (kg/s); and𝐻𝐻𝑉𝐻2 is the gross calorific value (MJ/kg).
3.5 Hydrogen Storage Tank
The hydrogen generated by the electrolyzer needs to be stored in a tank to supply the FC. The price of a tank with 1 kg of hydrogen capacity is estimated at $1,500.
The replacement costs are estimated at $1,500 per kg similar to studies performed.
The useful life of the hydrogen tank is estimated at 25 years [9].The tank autonomy can be calculated using the following equation [29]:
𝐴ℎ𝑡𝑎𝑛𝑘=𝑌𝐿ℎ𝑡𝑎𝑛𝑘× 𝐿𝐻𝑉𝐻2(24ℎ/𝑑)
𝑝𝑟𝑖𝑚,𝑎𝑣𝑒(3.6𝑀𝐽/𝑘𝑊ℎ) (11) where 𝑌ℎ𝑡𝑎𝑛𝑘 is the capacity of the hydrogen tank (kg);𝐿𝐻𝑉𝐻2 is the energy content of hydrogen; and𝐿𝑝𝑟𝑖𝑚,𝑎𝑣𝑒 is the average primary load (kWh/kg).
3.5 Pumped Hydro
Pumped hydro system allows storing water in a tank at a certain height when there is excess energy. It converts the potential energy into electricity by a turbine when the energy generation is required.
In this work a generic 245 kWh pumped hydro system was used. It presents a nominal capacity of. 1,059.000 Ah.
The energy storage capacity can be calculated as follow [29]:
𝐸[𝐽] = 9.81𝑃𝑤𝑎𝑡𝑒𝑟 × 𝑉𝑟𝑒𝑠 × ℎℎ𝑒𝑎𝑑 × 𝜂 (12) where 𝐸 is the energy stored (J); 𝑃𝑤𝑎𝑡𝑒𝑟 is the density of water (1000 kg/m3);𝑉𝑟𝑒𝑠
is the volume of the reservoir (m3); ℎℎ𝑒𝑎𝑑 is the head height in meters; and 𝜂 is the efficiency.
3.6 Electronic Power Converters
All configurations in this work need DC/AC converters for the connection to the AC network. The connection between the DC bus and the loads is made by a DC/AC converter. The converters must respond to several challenges, in terms of voltage ratio, energy efficiency, output current ripple, cost and reliability in case of power switch fault-tolerance. For this work, a range of inverter (0-20 kW) with efficiency of 95% and a useful life of 15 years is considered. The installation cost
is $300/kW and the replacement cost is equal to the initial capital. The cost of O&M is zero for inverter [9].
4 Studied Configurations
The hybrid systems under study in this work are designed to satisfy the demand of the inhabitants of Santay Island. The island is located in the Gulf of Guayaquil, 800 m from the city of Guayaquil, with an area of 21.79 km². This island has a population of 56 families living in 46 houses. The consumption load is characterized by the habits of the residents of the coastal area of Ecuador [30]
with a minimum consumption (3.1 kW), average consumption (4.18 kW) and maximum consumption (5.6 kW). The renewable energy resources (radiation solar and river speed) are studied below.
4.1 Renewable Energy Resources
The abundant solar radiation (2°12.5ˈS, 79°52.2ˈW) is shown in Figure 2. The data were obtained through the HOMER software. The annual average is 4,630 kWh/m² /day [29].
Figure 2 Radiation solar annual
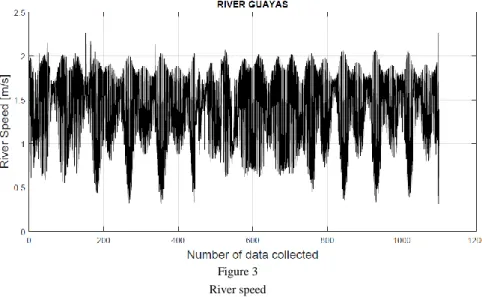
The kinetic energy of the river flow is exploited. The annual river velocity data is shown in Figure 3. These data are provided by the Oceanographic Institute of the Ecuadorian Navy (INOCAR) [31]. The highest recorded speed is 2.26 m/s, the slow speed is 0.31m/s and the average is 1.39 m/s. To carry out the simulation, the monthly average values are taken.
Figure 3 River speed
4.2 Systems under Study
Four hybrid systems have been studied. In all of them, PV panels and HKT are used as primary energy sources, the ESS with little capacity to provide energy for long time are not considered in the study. The studied configurations have been chosen based on widely used energy storage: 1) lead acid and 2) lithium batteries commonly used; 3) hydrogen system (electrolyzer, hydrogen tank and FC) is a totally renewable technology that is being used despite its high costs; 4) pumped hydro is a promising technology with a high application capacity.
The optimal configuration of each hybrid system under study is obtained by HOMER. The program carries out hundreds or even thousands of configurations to achieve the optimum sizing of the hybrid system. Each system is evaluated by four parameters: 1) lower initial capital; 2) total net present cost, which is the present value of all system costs over the useful life; 3) cost of energy, which is the average cost per kWh produced by the system; and 4) maximum capacity shortage or maximum allowable value of the capacity shortage fraction.
4.2.1 PV, HKT, Lithium Battery-based Hybrid System
Figure 4 shows the hybrid system under study. The resulting optimal sizing is composed of a PV array (42 kW), 3 HKT turbines (15 kW), a 1 kWh Li-Ion battery bank (50 units) and a DC/AC power converter (10 kW).
Table 1 shows the technical characteristics of the system. The simulation provided the following results: the initial capital of the system is $48,400, TNPC is
$96,804, LCOE is 0.178 $/kWh, the capacity shortage is 0.29% and the electrical
load that the system is unable to serve (Unmed Electric Load) is 72.2 kWh/yr (0.20%) of total load.
The model used is a generic 1 kWh li-ion battery, which has a nominal voltage of 3.7 V, a nominal capacity of 1.02 kWh, a maximum capacity of 276 Ah, a capacity ratio of 1, a rate constant of 1 (1/h), 8% in other round –trip losses, and the effective series resistance is 0.00036 ohms.
Figure 4
Configuration of the PV, HKT, Lithium Battery-based hybrid system Table 1
Technical characteristics of the PV, HKT, Lithium Battery-based hybrid system
Components PV HKT Converter
Rated Capacity (kW) 42 15 10
Mean Output (kW) 6.53 3.38 3.95
Maximum Output (kW) 34.5 5.98 8.54
Capacity Factor (%) 15.6 22.5 39.5
Total Production (kWh/yr) 57,236 29,547 ---
PV Penetration (%) 165 85.4 ---
Hours of Operation 4,189 8,760 8760
The per year operating cost is $2,435, the levelized costs for the PV and HKT are
$0.0149 and $0.065 per $/kWh, respectively. The energy stored by the batteries is 6,592 kWh/yr, the energy consumed out is 6,063 kWh/yr, the storage depletion (the difference between the battery state of charge at the start of the year and at the end of the year) is 6.28 kWh/yr and the losses are 565 kWh/yr, the lifetime throughput 94,587 kWh and expected life 15 yr.
The components that have a higher cost of capital are batteries and PV panels, with $30,000 and $13,440 respectively. The component with the highest replacement cost is the battery bank with $16,847. The cost per operation and
maintenance of the battery is $7,876. The total cost of the system is $96,803. It is composed of the following items: capital $58,440, replacement $32,260, O&M
$12,601, salvage $6,498.
4.2.2 PV, HKT, Lead Acid Battery-based Hybrid System
Figure 5 shows the proposed hybrid system, which is formed by a PVarray (45 kW), 3 units of HKT turbines (15 kW), a battery bank of 55 units (1 kWh) and a DC/AC converter (10 kW). The energy storage system is composed by a generic 1 kWh lead-acid battery, which has a nominal voltage of 12 V, a maximum charge current of 16.7 A, a capacity ratio of 0.403, a rate constant of 0.827 16 1/h and a maximum capacity of 83.4 Ah.
Figure 5
Configuration of the PV, HKT, Lithium Battery-based hybrid system
The initial capital cost of the system under study is $51,900, the TNPC is
$106,854, the LCOE is 0.196 $/kWh, the capacity shortage is 0.232% and the unmed electric load is 57.7 kWh/yr (0.16%) of total load. The per year operating cost is $3,489, the levelized costs for the PV and HKT are $0.0149 and $0.0605 per $/kWh, respectively.
The excess energy stored by the batteries is 7,530 kWh/yr, the output energy is 6,029 kWh/yr, the storage depletion is 5.97 kWh/yr and the losses is 1,507 kWh/yr, the lifetime throughput 60,000 kWh and the expected life 8.90 yr.
The components that have a higher capital cost are the batteries and PV panels with $22,500 and $14,400 respectively. The component with the highest replacement cost is the battery bank with $27,321, the same happens with the cost per operation and maintenance, $11,814. The total cost of the system is $106,853 (capital $51,900, replacement $42,734, O&M $16,540, salvage $4,320).
The optimization results given by HOMER according to the specifications are shown in Table 2.
Table 2
Technical characteristics of the PV, HKT, lead acid battery-based hybrid system
Components PV HKT Converter
Rated Capacity (kW) 45 15 10
Mean Output (kW) 7 3.38 3.95
Maximum Output (kW) 37 5.98 8.54
Capacity Factor (%) 15.6 22.5 39.5
Total Production (kWh/yr) 61,324 29,547 ---
PV Penetration (%) 177 85.4 ---
Hours of Operation 4,189 8,760 8760
4.2.3 PV, HKT, Hydrogen-based Hybrid System
The architecture of the proposed system is presented in Figure 6, where the system is composed of a PV array (40 kW), HKT turbines (15 W), a FC (6 kW), an electrolyzer (10 kW), a hydrogen tank (30 kg) and a DC/AC power converter (10 kW). The optimization results given by HOMER according to the specifications are shown in Table 3.
The simulation provided the following results: the initial capital of the system is
$110,800, the TNPC is $189,640, the LCOE is 0.348 $/kWh, the operating cost is
$5,005, the capacity shortage is 0.27% and the unmed electric load is 62.6 kWh/yr (0.18%) of total load.
Figure 6
Configuration of the PV, HKT, hydrogen-based hybrid system
The levelized costs for the PV and HKT are $0.0149 and $0.0605 per $/kWh, respectively. The hydrogen subsystem presents the following results: electrical production 6058 kWh/yr, hours of operation 3,805 hrs/yr, numbers of starts 623 starts/yr, fixed generation cost 1.05 $/hr, fuel consumption 363 kg and operational life 105 yr.
In the third system under study, the capital costs of hydrogen tank, electrolyzer and FC are the highest $ 45,000, $20,000 and $18,000 respectively. The FC has the highest replacement cost and O&M with $20,030 and $35,962, respectively.
The HKT has the second highest cost of O&M with $4,725, while the cost of O&M for the hydrogen tank and PV is zero due to having no moving parts or consumables. The total cost of the system is $189,639, which consists of the following items: capital $110,800, replacement $43,867, O&M $43,838, salvage
$8,866.
Table 3
Technical characteristics of the PV, HKT, hydrogen-based hybrid system
Components PV HKT FC Electrolyzer Converter
Rated Capacity (kW) 40 15 6 10 10
Mean Output (kW) 6.22 3.38 1.59 2.07 3.95
Maximum Output (kW) 32.9 5.98 6 0.215 (kg/hr) 8.54
Capacity Factor (%) 15.6 22.5 11.1 19.5 38.9
Production (kWh/yr) 54,510 29,572 6,058 369 (kg/yr) ---
Penetration (%) 157 85.4 --- --- ---
Operation (hr/yr) 4,189 8,760 3,805 3,308 8760
4.2.4 PV, HKT, Pumped Hydro Storage-based Hybrid System
The pumped hydro has a reservoir that can store a capacity of 1000 m3 of water, which can be discharged over 12 hours. The system under study is shown in Figure 7. The resulting components are a PV array (30 kW), HKT turbines (15 kW), a pump hydro (245 kWh) and a DC/AC power converter (10 kW). The pumped hydro has a nominal voltage of 240 V, a maximum charge current of 91.6 A, a maximum discharge current of 91.6 A and the generator efficiency is 90%.
Figure 7
Configuration of the PV, HKT, pumped hydro storage-based hybrid system
Table 4 shows the parameters of system under study. The initial capital cost of the system is $42,600, the TNPC is $86,996, the LCOE is $0.159/kWh, the capacity shortage is 0.04% and the unmed electric load is 10.4 kWh/yr (0.02%) of total load. The per year operating cost is $2,818, the levelized costs for the PV and HKT are $0.0149 and $0.0605 per $/kWh, respectively.
The excess energy stored by pumped hydro is 12,540 kWh/yr, the output energy is 10,178 kWh/yr, the storage depletion is 23.5 kWh/yr, the losses is 2,385 kWh/yr, the lifetime throughput 79,164 kWh and the expected life is 7 yr.
The components that have a higher capital cost are the pumped hydro and the PV panels with $22,000 and $9,600, respectively. The component with the highest replacement cost is the HKT turbine with $9,152, while the largest cost per operation and maintenance is the pumped hydro with $31,504. The total cost of the system is $86,995 (capital $42,600, replacement $1,733, O&M $34,655, salvage $1,993).
Table 4
Technical characteristics of the PV, HKT, pumped hydro storage-based hybrid system
Components PV HKT Converter
Rated Capacity (kW) 30 15 10
Mean Output (kW) 4.67 3.38 3.95
Maximum Output (kW) 24.7 5.98 8.54
Capacity Factor (%) 15.6 22.5 39.5
Total Production (kWh/yr) 40,883 29,572 ---
PV Penetration (%) 118 85.4 ---
Hours of Operation 4,189 8,760 8760
5 Comparative Study
5.1 Economic Parameters
The economic feasibility of the proposed system is performed taking into account five parameters: 1) initial capital cost, which is the total installed cost of the components at the beginning of the project; 2) TNPC; 3) capacity shortage; 4) levelized cost of energy (LCOE); and 5) annualized maintenance, operating and replacement cost. With these parameters, HOMER determines the optimal system.
Each of the parameters and the equations for its calculation are presented in this work.
5.2 TNPC
The TNPC of a system during its useful life is defined as the present value of all costs incurred throughout life, less the present value of all the income obtained during its operation. It incorporates operating and maintenance (O&M) costs, fuel costs, emission penalties and component replacement costs, minus the cost of rescuing each component. TNPC is the main economic indicator of HOMER [29].
The TNPC can be calculated as follows:
𝐶𝑇𝑃𝑁𝐶=𝐶𝑅𝐹(𝑖,𝑅𝐶𝑎𝑛𝑛,𝑡𝑜𝑡
𝑝𝑟𝑜𝑗) (13) 𝐶𝑅𝐹(𝑖,𝑁)=(1+𝑖)𝑖(1+𝑖)𝑁−1𝑁 (14) where 𝐶𝑎𝑛𝑛,𝑡𝑜𝑡 is the total annual cost ($/yr); CRF is the capital recovery factor; I is the interest rate (%); and 𝑅𝑝𝑟𝑜𝑗 is the project lifetime (N).
5.3 Capacity Shortage
The maximum annual capacity shortage is the maximum allowable value of the capacity shortage fraction, which is the total capacity shortage divided by the total electric load. HOMER considers infeasible (or unacceptable) any system with a higher value of the capacity shortage fraction. Allowing some capacity shortage can change the results dramatically in some cases. This might happen if a very high peak occurs for a very short time [32].
5.4 Levelized Cost of Energy (LCOE)
The levelized cost of energy (LCOE) is defined as the average cost per kWh of useful electrical energy produced by the system. This provides a way to compare the total energy cost for each specific electrification scenario that is being considered. The result is achieved dividing the annualized cost of electricity
produced by the total electric load served. The LCOE is calculated by equation (15).
𝐿𝐶𝑂𝐸 = 𝐿𝐶𝐶
∑𝑁𝑗=1.(𝐸𝐺𝐸𝑁(𝑗)
(1+𝑑)𝑗) (15) where LCC is the life cycle cost; and 𝐸𝐺𝐸𝑁 represents the cost of the life cycle of the energy produced by the proposed system in the given year j [29].
5.5 Annualized Maintenance, Operating and Replacement Cost
The annual cost of operating and maintenance increases with the operating time of the system. The cost can be determined by equation (16), while the annualized cost is determined by equation (17).
𝑪𝑶𝑷(𝒋) = 𝑪𝑶(𝒋) + 𝑪𝒎(𝒋) + 𝑪𝒓(𝒋) (16) 𝑨𝑽𝒐𝒑= ((𝟏+𝒅)𝒅(𝟏+𝒅)𝒋−𝟏𝒋) . (∑𝑵𝒋=𝟏(𝟏+𝒅)𝑪𝒐𝒑(𝒋)𝒏) (17) where𝐶𝑂 isthe operational cost of any component of the energy system in the year j; 𝐶𝑚 is the maintenance cost of any component of the energy system incurred in the year j; and 𝐶𝑟 is the replacement cost for any system component in the year j.
5.6 Results and Discussion
Table 5 shows the results of all the hybrid systems under study obtained from HOMER. The comparative study is performed by analyzing the differences in economic parameters and technical parameters(capacity shortage, renewable production, autonomy storage, annual throughput storage and expected life storage) of each of the systems under study[29].
The PV/HKT/pump hydro configuration achieves the best results in the LCOE with 0.159 $/kWh, the TNPC with $86,996, the operating cost with $2,818, the initial capital with $42,600. The capacity shortage (%) is only 0.04% with 14.3 kWh/yr, which ensures the constant supply of energy, and the autonomy storage is 64.3 hours. This configuration presents the smallest PV system (30 kW), and the production of renewable energy is 60,597 kWh.
Table 5
Economic results of simulation
Systems PV/HKT/B
LITIO
PV/HKT/
B LEAD ACID
PV/HKT/F C
PV/HKT/PUM P HYDRO
LCOE ($) 0.17 0.19 0.34 0.15
TNPC ($) 96,804 106,854 189,640 86,996
Operating cost ($) 2,435 3,489 5,005 2,818
Initial capital ($) 58,440 51,900 110,800 42,600
Capital Cost PV ($) 13,440 14,400 12,800 9,600
Capacity Shortage (%) 0.29 0.23 0.27 0.04
Autonomy Storage (h) 9 11.4 253 64.3
Annual Throughput Storage
(kWh) 6,285 6,741 --- 11,309
Expected life Storage (yr) 15 8.9 10.5 7
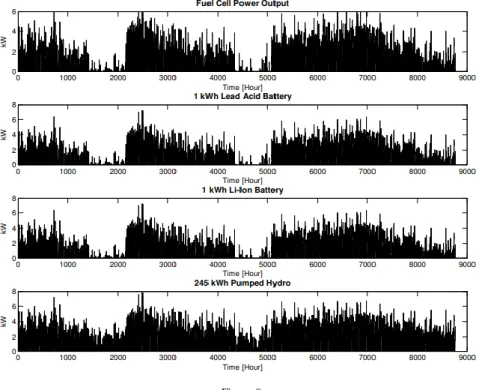
The annual discharge of the energy storage systems under study is illustrated in Figure 9.
Figure 9
Annual discharge of the energy storage systems
The maximum discharge values of the FC, lead acid battery, lithium battery and pumped hydro are 6 kW, 7.26 kW, 7.26 kW and 7.84 kW, respectively. The total power provided by each of the energy storage system for a year is 6,056 kW (FC), 6,029 kW (lead acid), 6,033 kW (li-ion), and 10,178 kW (pumped hydro).
Figure 10 shows the state of charge of the three energy storage system. The battery of lead acid has a discharge of 40% which promotes the increase of the system useful life. The maximum discharge is 22.5% for the battery Li-Ion, while
the pumped hydro system delivers all the energy stored in the tank at the end of January due to the lower renewable generation.
Figure 10
State of charge of the energy storage systems Conclusions
This paper has presented a study of different energy storage technologies applied to a hybrid system composed of PV generator and HKT turbine. The results showed that all the systems analyzed satisfied over 99.8% of the energy required by the demand.
The system based of li-ion battery had the second lowest LCOE (0.178 $/kWh), and the TNPC was $96,804. The advantage of this configuration is a battery life with 15 years, whereas the disadvantage was the low autonomy (9 hr) of the stored energy.
The system based on lead acid battery had the third highest cost in LCOE (0.196
$/kWh). The NPC was $106,854, the autonomy of the system was 11.4 hr, but the expected life of the storage was reduced to 8.9 yr.
The system with hydrogen-based energy storage presented the highest TNPC ($189,639). However, it is expected that its implementation costs will be significantly reduced in the coming years and it is a totally ecological technology.
The system based on pumped hydro obtained the best results in the unmet electric load (10.4 kWh/yr), TNPC ($86,995) and LCOE (0.159 $/kWh). However, it presented the lowest expected life of the storage (7 yr).
References
[1] World energy, “Latin America & The Caribbean.” [Online].
Available: https://www.worldenergy.org/data/resources/region/latin- america-the-caribbean/. [Accessed: 02-Feb-2018]
[2] “Renewable Capacity Statistics 2017,” /publications/2017/Mar/Renewable- Capacity-Statistics-2017, 2017
[3] J. Lata-Garcia, C. Reyes-Lopez, F. Jurado, L. M. Fernandez-Ramirez, and H. Sanchez, “Sizing optimization of a small hydro/photovoltaic hybrid system for electricity generation in Santay Island, Ecuador by two methods,” in 2017 CHILEAN Conference on Electrical, Electronics Engineering, Information and Communication Technologies (CHILECON), 2017, pp. 1-6
[4] S. Ahmadi and S. Abdi, “Application of the Hybrid Big Bang–Big Crunch algorithm for optimal sizing of a stand-alone hybrid PV/wind/battery system,” Sol. Energy, Vol. 134, 2016, pp. 366-374
[5] A. Cano, F. Jurado, H. Sánchez, L. M. Fernández, and M. Castañeda,
“Optimal sizing of stand-alone hybrid systems based on PV/WT/FC by using several methodologies,” J. Energy Inst., Vol. 87, No. 4, 2014, pp.
330-340
[6] S. O. Amrouche, D. Rekioua, and T. Rekioua, “Overview of energy storage in renewable energy systems,” in 2015 3rd International Renewable and Sustainable Energy Conference (IRSEC), 2015, pp. 1-6
[7] A. K. Rohit and S. Rangnekar, “An overview of energy storage and its importance in Indian renewable energy sector: Part II – energy storage applications, benefits and market potential,” J. Energy Storage, Vol. 13,, Oct. 2017, pp. 447-456
[8] A. Evans, V. Strezov, and T. J. Evans, “Assessment of utility energy storage options for increased renewable energy penetration,” Renew.
Sustain. Energy Rev., Vol. 16, No. 6, Aug. 2012, pp. 4141-4147
[9] J. Lata-García, F. Jurado, L. M. Fernández-Ramírez, and H. Sánchez-Sainz,
“Optimal hydrokinetic turbine location and techno-economic analysis of a hybrid system based on photovoltaic/hydrokinetic/hydrogen/battery,”
Energy, Vol. 159, Sep. 2018, pp. 611-620
[10] J. C. Spall, “Multivariate stochastic approximation using a simultaneous perturbation gradient approximation,” IEEE Trans. Automat. Contr., Vol.
37, No. 3, Mar. 1992, pp. 332-341
[11] A. Ürmös, Z. Farkas, M. Farkas, T. Sándor, L. T. Kóczy, and Á. Nemcsics,
“Application of Self-Organizing Maps for Technological Support of Droplet Epitaxy”
[12] A. Impr. Bourg-offset), D. Kumar, and S. K. Jarial, A Hybrid Clustering Method Based on Improved Artificial Bee Colony and Fuzzy C-Means Algorithm, Vol. 15, No. 2. Fontaine Picard, 1997
[13] B. Das and A. Kumar, “A NLP approach to optimally size an energy storage system for proper utilization of renewable energy sources,”
Procedia Comput. Sci., Vol. 125, Jan. 2018, pp. 483-491
[14] A. S. Jacob, R. Banerjee, and P. C. Ghosh, “Sizing of hybrid energy storage system for a PV based microgrid through design space approach,” Appl.
Energy, Vol. 212, Feb. 2018, pp. 640-653
[15] Y. Yang, S. Bremner, C. Menictas, and M. Kay, “Battery energy storage system size determination in renewable energy systems: A review,” Renew.
Sustain. Energy Rev., Vol. 91, Aug. 2018, pp. 109-125
[16] S. Bahramara, M. P. Moghaddam, and M. R. Haghifam, “Optimal planning of hybrid renewable energy systems using HOMER: A review,” Renew.
Sustain. Energy Rev., Vol. 62, 2016, pp. 609-620
[17] T. M. I. Mahlia, T. J. Saktisahdan, A. Jannifar, M. H. Hasan, and H. S. C.
Matseelar, “A review of available methods and development on energy storage; technology update,” Renew. Sustain. Energy Rev., Vol. 33, May 2014, pp. 532-545
[18] Amin, R. T. Bambang, A. S. Rohman, C. J. Dronkers, R. Ortega, and A.
Sasongko, “Energy Management of Fuel Cell/Battery/Supercapacitor Hybrid Power Sources Using Model Predictive Control,” IEEE Trans. Ind.
Informatics, Vol. 10, No. 4, Nov. 2014, pp. 1992-2002
[19] Policy department Economic and Scientific, “Outlook of energy storage technologies”
[20] University Basque country, “Energy Storage Technologies for Electric Applications.” [Online]. Available: http://www.sc.ehu.es/sbweb/energias- renovables/temas/almacenamiento_1/almacenamiento_1.html [Accessed:
10-Feb-2018]
[21] A. Raj K, S. Bag, A. Roy, U. Pal, and S. Mitra, “Battery Technologies for Energy Storage,” in Encyclopedia of Sustainable Technologies, Elsevier, 2017, pp. 469-486
[22] C. Wang, M. H. Nehrir, and S. R. Shaw, “Dynamic Models and Model Validation for PEM Fuel Cells Using Electrical Circuits,” IEEE Trans.
Energy Convers., Vol. 20, No. 2, Jun. 2005, pp. 442-451
[23] S. Kapila, A. O. Oni, and A. Kumar, “The development of techno- economic models for large-scale energy storage systems,” Energy, Vol.
140, Dec. 2017, pp. 656-672
[24] Smart Hydro Power, “Smart monofloat turbine.” Postdam, p. 1, 2015 [25] M. Mehrabankhomartash, M. Rayati, A. Sheikhi, and A. M. Ranjbar,
“Practical battery size optimization of a PV system by considering individual customer damage function,” Renew. Sustain. Energy Rev., Vol.
67, 2017, pp. 36-50
[26] “PEM fuel cell degradation effects on the performance of a stand-alone solar energy system,” Int. J. Hydrogen Energy, Vol. 42, No. 18, May 2017, pp. 13217-13225
[27] C. Ghenai and M. Bettayeb, “Modelling and performance analysis of a stand-alone hybrid solar PV/Fuel Cell/Diesel Generator power system for university building,” Energy, Vol. 171, Mar. 2019, pp. 180-189
[28] P. Millet, S. Grigoriev, P. M. Diéguez, P. Millet, and S. Grigoriev, “Water Electrolysis Technologies,” in Renewable Hydrogen Technologies, Elsevier, 2013, pp. 19-41
[29] “HOMER - Hybrid Renewable and Distributed Generation System Design Software” [Online] Available: http://www.homerenergy.com/ [Accessed:
18-Apr-2017]
[30] “Plan Maestro de Electrificación 2013- 2022, Volume 2, Pag 42, Residential load curve, Guayaquil electric,” 2017
[31] “Instituto Oceanográfico de la Armada - Tabla de mareas puertos del
Ecuador” [Online] Available:
http://www.inocar.mil.ec/web/index.php/productos/tabla-mareas [Accessed: 29-Apr-2017]
[32] HOMER, “Maximum Annual Capacity Shortage” [Online] Available:
https://www.homerenergy.com/support/docs/3.11/maximum_annual_capaci ty_shortage.html [Accessed: 28-Dec-2017]