DOI 10.1007/s10846-012-9721-6
Estimation of Relative Direction Angle of Distant, Approaching Airplane in Sense-and-Avoid
Tamas Zsedrovits·Akos Zarandy·Balint Vanek· Tamas Peni·Jozsef Bokor·Tamas Roska
Received: 29 June 2012 / Accepted: 12 July 2012
© Springer Science+Business Media B.V. 2012
Abstract Visual detection based sense and avoid problem is more and more important nowadays as UAVs are getting closer to entering remotely piloted or autonomously into the airspace. It is critical to gain as much information as possible from the silhouettes of the distant aircrafts. In our paper, we investigate the reachable accuracy of the orientation information of remote planes under different geometrical conditions, by identi- fying their wing lines from their detected wingtips.
Under the assumption that the remote airplane is on a straight course, the error of the spatial discretization (pixelization), and the automatic detection error is calculated.
Keywords UAV·See and avoid·Long range visual detection
T. Zsedrovits (
B
)·A. Zarandy·T. RoskaThe Faculty of Information Technology, Pázmány Péter Catholic University, Budapest, Hungary e-mail: zseta@digitus.itk.ppke.hu
T. Zsedrovits·A. Zarandy·B. Vanek·T. Peni· J. Bokor·T. Roska
Computer and Automation Research Institute of the Hungarian Academy of Sciences (MTA-SZTAKI), Budapest, Hungary
1 Introduction
According to many aviation experts pilotless air- crafts are going to revolutionize air transport in the near future. As written in the cover story of December 2011 issue of IEEE Spectrum Maga- zine: “A pilotless airliner is going to come; it’s just a question of when,” said James Albaugh, the president and CEO of Boeing Commercial Airlines [1]. Surely, this final goal is expected to be achieved step-by-step. First, small-sized and low- budget aircrafts have to be automated and after then bigger and more expensive ones.
One of the most important problems which has to be solved is the collision avoidance or sense- and-avoid capability. Provided that the size and the energy consumption of the Unmanned Aer- ial Vehicle (UAV) are limited, a camera based avoidance system would provide cost and weight advantages against radar based solutions [2, 3].
Furthermore near airfields, because of a great density of aircrafts and the limited frequency re- sources of air traffic controllers the camera-based approach seems to be more feasible then others.
Today’s kilo-processor chips allow us to imple- ment complex algorithms in real time with low power consumption.
In [4–6] and [7] a camera-based autonomous on-board collision avoidance system and its imple- mentation aspects on kilo-processor architectures are introduced. This sense-and-avoid system is
capable of avoiding a single target as long as the lighting conditions are good, or the sky is nearly homogenous. If the intruder is far from our cam- era, less information can be obtained with image processing, but from a given distance the shape of the intruder is distinct, thus shape analysis can be used to get more information [8].
Provided that the intruder aircraft is close enough to our UAV its wing can be seen, the relative angle of attack can be obtained and can be used to estimate its trajectory. In this paper the au- tomatic estimation process is introduced and the precision in miscellaneous situations are studied.
The automatic solution is compared to the ground truth and to the theoretically computed values in each situation. For the measurements realistic images rendered by FlightGear flight simulator is used [4].
2 Geometrical Description
In this section the geometrical description of the studied situation is introduced. Let us assume that we have one intruder aircraft and it is on a colliding trajectory with our UAV. In this case the position of the intruder on the image plane is almost constant (given no self motion).
This situation is unobservable with our Kalman-filter based estimation algorithm [5], which estimates the 3D position of the intruder from the change of the coordinates of the intruder in the image plane. Thus, additional information is required in order to determine the relative position of the intruder aircraft. For one thing, this information can be achieved with running an excitatory manoeuvre [9], which consumes fuel, which is a limited resource on a UAV.
On the other hand, if wingtips of the intruder aircraft can be distinguished on the image, the relative direction angle can be estimated.
Provided that the intruder is coming towards us, it grows in the image. In the beginning this growth is slow and later it accelerates. The relative bank angle of the intruder in the picture, namely the coordinates of the wingtips, is measurable.
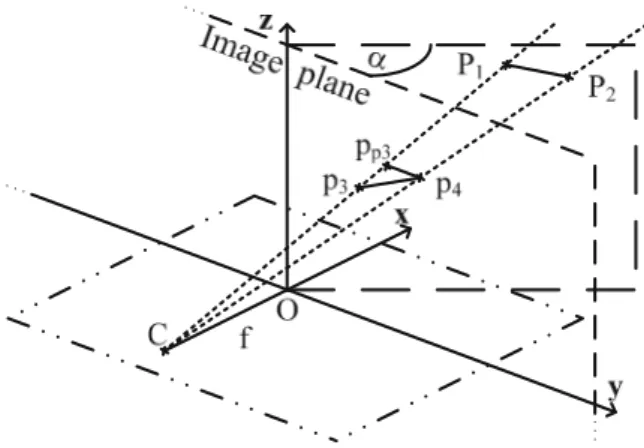
As shown in Fig.1the wing of the intruder in the image plane is projected to p3p4and in space it is p1p2. It is assumed that the wing of the intruder
Fig. 1 Diagram of the relative direction angle (α) calcula- tion: C is the camera centre; f is the focal length; O is the centre of the image plane (yz plane) and the origin; p1p2 is the model of the wing of the intruder aircraft in space;
p3p4is the wing in image plane; pp3is the projection of p3 to the horizontal line goes through p4
is horizontal, that is parallel with xy, assuming straight level flight. The centre of our coordinate system is the central point of the recorded image and the yz plane is the image plane. It is assumed, that the images are transformed to the NED frame [10].
If the intruder isn’t in xy plane, therefore none of its image coordinates are 0 in the image co- ordinate system, the line going through the two wingtips includes an angle introduced by the z axis offset. Assuming p4pp3 is parallel with y, from this p3p4pp3 angle we would like to estimate the intruder’s relative angle in 3D (α) that is its direc- tion, which can be used to enhance the estimation.
Consequently this p3p4pp3 depends on the angle αand the subtended angle in which is seen. This subtended angle (sa) is calculated as follows:
sa=2∗tan−1
p3−p4 f
If the intruder is on the xy horizontal plane, p3
equals pp3 and the α angle cannot be estimated with this algorithm. The altitude of our UAV can be easily changed with acceleration or decelera- tion, which consumes less fuel than the complex excitatory manoeuvre mentioned before.
The angleαcan be calculated as follows:
From the measurement we have:
p3
0,p3y,p3z
p4
0,p4y,p4z
C(−f,0,0) ,
where C is the camera centre and f is the focal length. Vectors pointing form the camera centre to wingtips are:
−
→v1 =p3−C,−→v2 =p4−C.
The lines on these points are:
l1=C+t1∗ −→v1,l2=C+t2∗ −→v2.
Thus parameters t1and t2are computed that l1−l2;(0,0,0) =0.
Let us assume that t1:=1, so t2= p3y
p4y, i f p4y=0. Now P1and P2are the following:
P1 =C+t1∗ −→v1 =
⎛
⎝p3x
p3y 0
⎞
⎠ and
P2 =C+t2∗ −→v1 =
⎛
⎜⎜
⎜⎜
⎝ p3y
p4y ∗p4x
p3y f∗
p3y p4y −1
⎞
⎟⎟
⎟⎟
⎠.
The angle of horizontal projection of p3p4and p1p2 is the angle α. The horizontal projection means that the second coordinates of p3 and p4 are equalized so
pp3:=
⎛
⎝p3x p4y
p3z
⎞
⎠.
Thus cosα=
pp3−p4;P1−P2 pp3−p4P1−P2.
In this model the instances rotated by 180◦are equal and the α=cos−1X function gives good solution inα= [0◦;180◦] range. The relative an- gle α should be in the[−90◦;90◦]range, so it is transformed according to the following rules. If
α >90◦, thenα=180◦−α, ifα <−90◦, thenα=
−180◦−α. With these calculations the expected results are obtained consistently.
3 Measurement Situations
The accuracy of the calculation is studied with given image resolution and position. Four kinds of situations are examined:
(1) With pinhole camera model, the given cen- troid point of the intruder is projected back from image plane to space to several dis- tances. The wingspan of the intruder is 11 m (36 ft 1 in), which is the wingspan of Cessna 172, a typical light aircraft that shares the airspace with our UAV. Thus the wing is rep- resented by an 11 m line segment and is ro- tated in the previously calculated point. The field of view and resolution of the camera and the distance along x axis is required for the calculation. The fuselage of the aircraft is neglected, which gives an initial error. With these calculations the lower bound of the error is approximated. Two kinds of points are used:
(a) calculated points without rounding to determine the error induced by the lim- ited numerical precision
(b) calculated points with rounding to de- termine the error induced by the dis- cretization in space
(2) With the calculated centroid points in space according to the previous, pinhole camera situation, images are taken from FlightGear flight simulator. The wingtip coordinates are taken by a human expert from these simu- lated images and the angle values are calcu- lated from these coordinates.
(3) Similarly to the above, the intruder points are extracted from the simulated images ren- dered by FlightGear with our image seg- mentation algorithm [4]. After that, from intruder pixel coordinates the wingtip co- ordinates are calculated with the following simple algorithm. The wingtip coordinates are determined by the extremes of the y and
z coordinates in the appropriate order. In order to reduce the error induced by the im- age formation, the calculated coordinates are refined according to the image pixel values with the following expression:
pcorrected_y= py+s
i=py−si∗piv py+s
i=py−spiv
where pcorrected_y is the refined coordinate value, py is the original coordinate value, s is the radius, piv is the grayscale value of the ithpoint.
(4) In this measurement setup the images are recorded by a full HD interlaced video cam- era with50◦field of view, in outdoor environ- ment. The background is clear blue sky. The intruder is placed according to the previous measurements. The shape of the intruder is correctly segmented from the images. Images are noisy because of the video compression, the interlaced camera and wind effects. In this situation an aircraft matchbox is used as the intruder.
4 Precision Determination
In this section the measurements are described in situations introduced in Section 3. The position dependence of the error and the effect of the discretization are shown.
4.1 Pinhole Camera
First the pinhole camera model is used. Provided that the points are calculated without rounding, this approach should come close to the theoretical limits and the computation error has to be near zero.
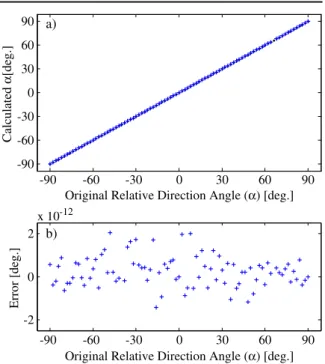
The measurements are done with double preci- sion and the error of the angles is in the range of pico degrees as shown in Fig.2, which is the range of the error introduced by the numeric represen- tation. Indeed this error can be seen as zero in the point of the computation part.
In Fig. 2a the real rotation angles versus the calculated angel values are shown, and the part b depicts the error of the estimated angle, which
-90 -60 -30 0 30 60 90
-90 -60 -30 0 30 60 90
Calculated α[deg.]
a)
-90 -60 -30 0 30 60 90
-2 0 2
x 10-12
Original Relative Direction Angle (α) [deg.]
Original Relative Direction Angle (α) [deg.]
Error [deg.]
b)
Fig. 2 α angles calculated from pinhole model and their error to ground truth; a the original angles with black dots (covered by calculated angles) and the calculated angles with blue plus signs; b the error values for each calculated angle
is the difference between the two angles. The distance along the x axis to the image plane is 2 km (1.24 miles) and the intruder is seen in7◦azimuth and elevation angle offset.
Let us assume that a typical HD camera is used to record the scene. This camera is calibrated and the recorded pictures are undistorted, thus the pinhole camera model can be a valid approxima- tion. The difference between this measurement scenario and the one stated above is that here the image coordinates are discrete integer values and the image plane is finite.
According to the measurements, the precision of the estimation with a given camera depends on the subtended angle and the relative distance along the x axis. Undoubtedly, it isn’t surprising because the larger the distance the smaller the intruder in the image and the bigger the altitude difference the more you observe the wing of the intruder.
The three figures (Figs.3,4and5) show exam- ples where the relative distance along the x axis is 1 km (0.62 miles), the resolution is1920×1080
-90 -60 -30 0 30 60 90 -90
-60 -30 0 30 60 90
Calculated α[deg.]
a)
-90 -60 -30 0 30 60 90
-40 -30 -20 -10 0 10 20 30 40
Original Relative Direction Angle (α) [deg.]
Original Relative Direction Angle (α) [deg.]
Error [deg.]
b)
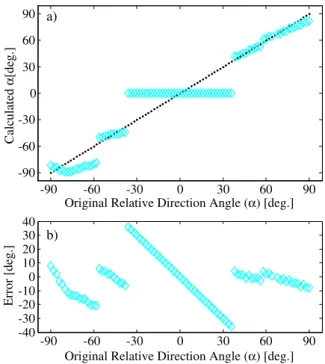
Fig. 3 αangles calculated from pinhole model with round- ing and their error to original rotation angles; a the original angles with black dots and the calculated angles with cyan diamonds; b the error values for each calculated angle (max
±6◦); the intruder is seen in (24◦,14◦) direction and the distance along x axis is 1 km
pixels, the horizontal field of view is 50◦ and the pixels are squares. The wingspan of the intruder is 11 m (36 ft 1 in), which is the wingspan of Cessna 172.
The size of intruder in the image plane is be- tween 15 and 20 pixels, depending on the rotation angle and the position. The intruder is seen in14◦, 7◦ and 3.5◦ elevation successively, and it is seen constantly in24◦azimuth.
Figure 6 shows the maximum error values in each subtended angle with constant azimuth of 24◦ and with changing elevation from −14◦ to 14◦. In each position the intruder is rotated with angles from−90◦ to90◦ and the maximum of the absolute of the error is chosen. This measurement shows the position dependence of the calculated α. Figure6depicts that the initial error is±6◦and the closer the intruder is to the horizontal axis the bigger the error we get.
Similarly, the bigger the distance along the x axis the smaller the intruder is in the image, there- fore the spatial discretization gives higher error
-90 -60 -30 0 30 60 90
-90 -60 -30 0 30 60 90
Calculated α[deg.]
a)
-90 -60 -30 0 30 60 90
-40 -30 -20 -10 0 10 20 30 40
Original Relative Direction Angle (α) [deg.]
Original Relative Direction Angle (α) [deg.]
Error [deg.]
b)
Fig. 4 αangles calculated from pinhole model with round- ing and their error to original rotation angles; same as before, the direction is (24◦,7◦) and the maximum error is±11◦; the asymmetry in the error function is caused by the position of the intruder
-90 -60 -30 0 30 60 90
-90 -60 -30 0 30 60 90
Calculated α[deg.]
a)
-90 -60 -30 0 30 60 90
-40 -30 -20 -10 0 10 20 30 40
Original Relative Direction Angle (α) [deg.]
Original Relative Direction Angle (α) [deg.]
Error [deg.]
b)
Fig. 5 αangles calculated from pinhole model with round- ing and their error to original rotation angles; same as before, the direction is (24◦, 3.5◦) and the maximum error is±37◦
-14 -12 -10 -8 -6 -4 -2 0 2 4 6 8 10 12 14 5
10 30 90
Elevation Offset [deg.]
Error with logarithmic scale [deg.]
Fig. 6 Maximum of absolute value of the errors of the roundedαangles calculated with pinhole camera model in different relative vertical positions and from 1 km distance along the x axis; in the figure on the horizontal axis the elevation offset in which the intruder is seen; on the vertical axis the error in deg. with logarithmic scale
value, as shown in the figures (Figs. 7 and 8).
Furthermore, the proximity to y has a greater effect on the error than in the smaller distance case (Fig.8).
-90 -60 -30 0 30 60 90
-90 -60 -30 0 30 60 90 a)
-90 -60 -30 0 30 60 90
-40 -30 -20 -10 0 10 20 30 40
Error [deg.]
b)
Original Relative Direction Angle (α) [deg.]
Original Relative Direction Angle (α) [deg.]
Calculated α[deg.]
Fig. 7 αangles calculated from pinhole model with round- ing and their error to original rotation angles; a the original angles with black dots and the calculated angles with cyan diamonds; b the error values for each calculated angle (max
±13◦); the intruder is seen in (24◦, 14◦) direction and the distance along x axis is 2 km
-14 -12 -10 -8 -6 -4 -2 0 2 4 6 8 10 12 14 5
10 30 90
Elevation Offset [deg.]
Error with logarithmic scale [deg.]
Fig. 8 Maximum of absolute value of the errors of the roundedαangles calculated with pinhole camera model in different relative vertical positions and from 2 km distance along the x axis; in the figure on the horizontal axis the elevation offset in which the intruder is seen; on the vertical axis the error in deg. with logarithmic scale
4.2 Points by Human Expert on Simulated Images In our simulation environment [6] pictures is taken and the wingtip pixel coordinates are se- lected by a human expert. The intruder is placed in space according to Section 3(1) and in every position it is rotated by specific angles in the xy plane. The resolution is1920×1080pixels and the horizontal field of view is 50◦ and the pixels are squares, such as in the previous case, Section4.1.
In Fig. 9a the ground truth α values are with black dots (covered). The angles calculated from pinhole camera model are shown with blue plus signs; the values calculated from rounded coor- dinates are shown with cyan diamonds and the angles calculated from points selected by hand are shown with green asterisks. On Fig. 9b the error values are shown and the colours are similar to previous. The figure depicts only the result of the measurement in one specific distance. The intruder was placed in 9 different positions and was rotated with 9 different angles (−80◦, 80◦,
−40◦,40◦,−10◦,10◦,−5◦,5◦,0◦). The other results obtained from another distances are similar to that are described previously in Section4.1, thus the altitude difference is in inverse ratio to the error.
The measurements above shows that with good wingtip coordinates in realistic situation the error can be near to theoretical minimum.
-80 80 -40 40 -10 10 -5 5 0 -10
0 10
Original Relative Direction Angle () [deg.]
Original Relative Direction Angle () [deg.]
Error [deg.]
b)
-80 80 -40 40 -10 10 -5 5 0
-90 -60 -30 0 30 60 90
Calculated [deg.]
a)
Fig. 9 αangles calculated from coordinates selected by a human expert on images generated by FlightGear simula- tor; a angles with different elevation offset, on the vertical axis the calculated angle values, on the horizontal axis the real rotation angles in 9 different positions; b the error;
original angles with black dots (covered), angles calculated from pinhole model with blue plus signs, angles calculated from pinhole model with rounding with cyan diamonds, angles calculated from coordinates selected by hand with green asterisks
4.3 Points by Automatic Algorithm on Simulated Images
The error of the automatic wingtip detection al- gorithm running on simulated images has been measured. The simple algorithm determines the wingtip coordinates from the segmented images.
The extreme of y and z coordinates are used in appropriate order to get the coordinates (Fig.10).
-80 80 -40 40 -10 10 -5 5 0
-90 -60 -30 0 30 60 90 a)
-80 80 -40 40 -10 10 -5 5 0
-75 -50 -25 0 25 50 75
Error [deg.]
b)
Original Relative Direction Angle (α) [deg.]
Original Relative Direction Angle (α) [deg.]
Calculated α[deg.]
Fig. 11 αangles calculated from coordinates calculated by the automatic algorithm on images generated by Flight- Gear simulator; a angles with different elevation offset, on the vertical axis the angle values, on the horizontal axis the real rotation angles in 9 different positions; b the error;
original angles with black dots (covered), angles calculated from pinhole model with blue plus signs, angles calculated from pinhole model with rounding with cyan diamonds, angles calculated from coordinates selected by hand with green asterisks, angles calculated automatically with red squares and the corrected values with magenta triangles
Fig. 10 Enlarged images of wingtip points selected by a human expert and by the algorithm on images generated by FlightGear simulator; on the left an example when the al-
gorithm gives good points, on the right when the algorithm makes a mistake; with green asterisks the points given by human expert, with red squares given by the algorithm
Figure11depicts one example, where similarly to Section4.2, the intruder had been placed in a specific locations in space and then it was rotated with specific angles (same as before). In the figure the ground truth is with black dots (covered);
the values from pinhole camera model are with cyan diamonds and blue plus signs; the values form points selected by human expert are green asterisks; the values from automatic algorithm are with red squares and the values calculated from corrected points are with magenta triangles.
In this case when the intruder is rotated with 80◦ and with −80◦ angles, the error of the es- timation is bigger, because the simple algorithm couldn’t distinguish between the pixels of the wing and the pixels of the tail.
In contrast, in the mid-range, the performance of this really simple algorithm is almost the same as the performance of the human expert.
4.4 Points by Automatic Algorithm on Images from Real Video Data
In this case images are taken from video data recorded with a full HD video camera. The resolu- tion is1920×1080pixels and the horizontal field of view is50◦and the pixels are squares, such as in the previous cases. A frame from the video is shown on Fig.12.
Figure 13 depicts one example, where an air- plane matchbox is used as an intruder. The in- truder has a wingspan of 10 cm, so it is placed 454 cm to the camera to have the same size on the image plane as a Cessna 172 from 500 m.
20 25 30 35 40
20 25 30 35 40 a)
20 25 30 35 40
-4 -2 0 2 4
Error [deg.] b)
Original Relative Direction Angle (α) [deg.]
Original Relative Direction Angle (α) [deg.]
Calculated α[deg.]
Fig. 13 αangles calculated from coordinates calculated by the automatic algorithm on images from real video; the intruder is seen in (24◦, 14◦) direction and the equivalent distance along x axis is 500 m; a calculated images; b the error values for each calculated angle (max±4◦); original angles with black dots, angles calculated from pinhole model with rounding with cyan diamonds, angles calcu- lated automatically with red squares
As shown in Fig.13, with the automatic algo- rithm in this situation the theoretical precision can be reached. The results of the automatic algorithm are with red squares and the results from the dis- cretized real coordinates are with cyan diamonds.
The black dots are the ground truth.
The noise introduced by the video camera and the environment is suppressed with a simple
Fig. 12 One frame from a recorded video; the intruder is in the upper right part of the image
averaging in time, the calculated α angles are averaged for 25 frame (1 s).
5 Conclusions
The reachable accuracy of the orientation calcu- lation of visually detected remote airplanes was studied. The orientation calculation was based on the detection of the wingtips.
As it turned out the relative orientation of the remote aircraft (depicted byα) can be calculated if it is on a straight course, and its level differs from the observer.
Naturally, the orientation measurement is more accurate when the level difference is higher, and the airplane is closer. The exact reachable accu- racy figures are shown in charts, and their calcula- tion methods are given.
The acquired measurements will be used to enhance the estimation accuracy of the currently existing EKF based sense and avoid system.
Acknowledgment The support of the grants TÁMOP- 4.2.1.B-11/2/KMR-2011-0002 and TÁMOP-4.2.2/B-10/1- 2010-0014 is gratefully acknowledged. The ONR Grant (Number: N62909-10-1-7081) is greatly acknowledged.
References
1. Ross, P.E.: When will we have unmanned commercial airliners? In: IEEE Spectrum Magazine (2011) 2. Hutchings, T., Jeffryes, S., Farmer, S.J.: Architecting
UAV sense & avoid systems. In: Proc. Institution of Engineering and Technology Conf. Autonomous Sys- tems, pp. 1–8 (2007)
3. Fasano, G., Accardo, D., Forlenza, L., Moccia, A., Rispoli, A.: A multi-sensor obstacle detection and tracking system for autonomous UAV sense and avoid.
In: XX Congresso Nazionale AIDAA, Milano (2009) 4. Zsedrovits, T., Zarándy, Á., Vanek, B., Péni, T., Bokor,
J., Roska, T.: Collision avoidance for UAV using visual detection. In: ISCAS (2011)
5. Vanek, B., Péni, T., Zsedrovits, T., Zarándy, Á., Bokor, J., Roska, T.: Performance analysis of a vision only sense and avoid system for small UAVs. In: AIAA Guidance, Navigation, and Control Conference (2011) 6. Zsedrovits, T., Zarándy, Á., Vanek, B., Péni, T., Bokor, J., Roska, T.: Visual detection and implementation as- pects of a UAV see and avoid system. In: ECCTD (2011)
7. Vanek, B., Péni, T., Bokor, J., Zarándy, Á., Zsedrovits, T., Roska, T.: Performance analysis of a vision only sense and avoid system for small UAV. In: European Workshop on Advanced Control and Diagnosis (2011) 8. Pratt, W.K.: Digital Image Processing: PIKS Inside.
PixelSoft Inc., Los Altos, CA (2001)
9. Hernandez, M.L.: Optimal sensor trajectories in bearings-only tracking. Tech. Rep. QinetiQ (2004) 10. Stengel, R.: Flight Dynamics. Princeton Press (2004)