Abstract— Visual detection based sense and avoid problem is more and more important nowadays as UAVs are getting closer to entering remotely piloted or autonomously into the airspace. It is critical to gain as much information as possible from the silhouettes of the distant aircrafts. In our paper, we investigate the reachable accuracy of the orientation information of remote planes under different geometrical condition, by identifying their wing lines from their detected wingtips. Under the assumption that the remote airplane is on a straight course, the error of the spatial discretization (pixelization), and the automatic detection error is calculated.
Index Terms — UAV, See and Avoid, long range visual detection.
I. INTRODUCTION
any aviation experts agree that in the near future pilotless aircrafts are going to revolutionize air transport. As written in the cover story of December 2011 issue of IEEE Spectrum Magazine: “A pilotless airliner is going to come; it's just a question of when,” said James Albaugh, the president and CEO of Boeing Commercial Airlines [1]. Surely, this final goal is expected to be achieved step-by-step. Nowadays, the developments are running parallel in the field of small-sized cheap aircrafts and in the field of bigger and more expensive ones. Most likely, in the beginning, the former will be used in civil tasks while the latter will be used in military operations.
One of the most important problems which has to be solved is the collision avoidance or sense-and-avoid capability. Provided that the size and the energy consumption of the Unmanned Aerial Vehicle (UAV) are limited, a camera based avoidance system would provide cost and weight advantages against radar based solutions [2], [3]. Furthermore near airfields, because of a great density of aircrafts and the limited frequency resources of air traffic controllers the camera-based approach seems to be more feasible then others.
Today’s kilo-processor chips allow us to implement complex algorithms in real time with low power consumption.
In [4], [5], [6], and [7] camera-based autonomous on- board collision avoidance system and its implementation aspects on kilo-processor architectures are introduced. This sense-and-avoid system is capable of avoiding a single target as long as the lighting conditions are good, or the sky is nearly homogenous. If the intruder is far from our camera, less information can be obtained with image processing, but from a given distance the shape of the intruder is distinct, thus shape analysis can be used to get more information [8].
Provided that the intruder aircraft is close enough to our UAV its wing can be seen, the relative angle of attack can be obtained and can be used to estimate its trajectory. In this paper the automatic estimation process is introduced and the precision in miscellaneous situations are studied. The automatic solution is compared to the ground truth and to the theoretically computed values in each situation. For the measurements realistic images rendered by FlightGear flight simulator is used [4].
II. GEOMETRY
In this section the geometrical description of the studied situation is introduced. Let us assume that we have one intruder aircraft and it is on a colliding trajectory with our UAV. In this case the position of the intruder on the image plane is almost constant (given no self motion).
This situation is unobservable with our Kalman-filter based estimation algorithm [5], which estimates the 3D position of the intruder from the change of the coordinates of the intruder in the image plane. Thus, additional information is required in order to determine the relative position of the intruder aircraft. For one thing, this information can be achieved with running an excitatory manoeuvre [9], which consumes fuel, which is a limited resource on a UAV.
On the other hand, if wingtips of the intruder aircraft can be distinguished on the image, the relative direction angle can be estimated.
C
a
y z
p3 x p4
P1
P2
f
pp3
O Image plane
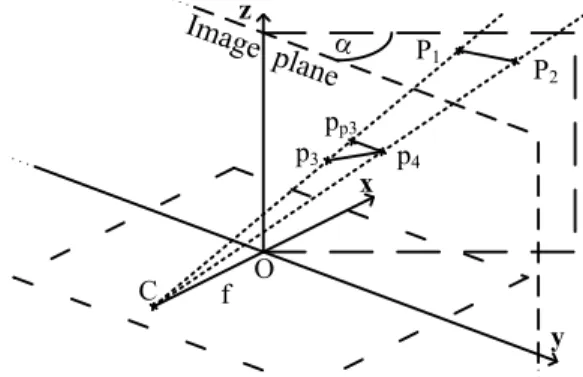
Fig. 1. Diagram of the relative direction angle ( ) calculation: is the camera centre; is the focal length; is the centre of the image plane ( plane) and the origin; . is the model of the wing of the intruder aircraft in space; is the wing in image plane; is the projection of to the horizontal line goes through
Provided that the intruder is coming towards us, it grows in the image. In the beginning this growth is slow and later it
Azimuth Estimation of Distant, Approaching Airplane in See-and-avoid Systems
Tamas Zsedrovits†*, Akos Zarandy†*, Balint Vanek*, Tamas Peni*, Jozsef Bokor*, Tamas Roska†*
†Pázmány Péter Catholic University, The Faculty of Information Technology, Budapest, Hungary,
*Computer and Automation Research Institute of the Hungarian Academy of Sciences (MTA-SZTAKI) Budapest, Hungary
M
accelerates. The relative bank angle of the intruder in the picture, namely the coordinates of the wingtips, is measurable.
The wing of the intruder in the image plane is represented by and in space it is modelled with . It is assumed that the wing of the intruder is horizontal, that is parallel with , because it goes straight. The centre of our coordinate system is the central point of the recorded image and the plane is the image plane (Fig. 1).
If the intruder isn’t in plane, therefore none of its image coordinates are 0 in the image coordinate system, the line going through the two wingtips includes an angle introduced by the axis offset. Assuming is parallel with , from this angle we would like to estimate the intruder’s relative angle in 3D ( ) that is its direction, which can be used to enhance the estimation. Consequently this
depends on the angle and the subtended angle in which is seen.
If the intruder is on the horizontal plane, equals
and the angle cannot be estimated with this algorithm.
The altitude of our UAV can be easily changed with acceleration or deceleration, which consumes less fuel than the complex excitatory manoeuvre mentioned before.
The angle can be calculated as follows:
From the measurement we have:
where is the camera centre and f is the focal length. Vectors pointing form the camera centre to wingtips are:
. The lines on these points are:
. Thus parameters t1 and t2 are computed that
. Let us assume that
, so
Now P1 and P2 are the following:
and
.
The angle of horizontal projection of and is the angle . The horizontal projection means that the second coordinates of and are equalized so
.
Thus
.
In this model the instances rotated by 180° are equal and the function gives good solution in range. The relative angle should be in the range, so it is transformed according to the following rules. If , then , if , then . With these calculations the expected results are obtained consistently.
III. MEASUREMENTS
The accuracy of the calculation was studied with given image resolution and position. Three kinds of situations were examined:
1) With pinhole camera model, the given centroid point of the intruder is projected back from image plane to space to several distances. The wingspan of the intruder is 11m (36 ft 1 in), which is the wingspan of Cessna 172, a typical light aircraft that shares the airspace with our UAV. Thus the wing is represented by an 11m line segment and is rotated in the previously calculated point.
The field of view and resolution of the camera and the distance along x axis is required for the calculation. The fuselage of the aircraft is neglected, which gives an initial error. With these calculations the lower bound of the error is approximated. Two kinds of points are used:
a) calculated points without rounding to determine the error induced by the limited numerical precision
b) calculated points with rounding to determine the error induced by the discretization in space 2) With the calculated centroid points in space according to
section 1) images are taken from FlightGear flight simulator. The wingtip coordinates are taken by a human expert from these simulated images and the angle values are calculated from these coordinates.
3) Similarly to the above, the intruder points are extracted from the simulated images rendered by FlightGear with our image segmentation algorithm [4]. After that, from intruder pixel coordinates the wingtip coordinates are calculated with the following simple algorithm. The wingtip coordinates are determined by the extremes of the y and z coordinates in the appropriate order. In order to reduce the error induced by the image formation, the calculated coordinates are refined according to the image pixel values with the following expression:
where is the refined coordinate value, is the original coordinate value, is the radius, is the grayscale value of the ith point.
IV. PRECISION CALCULATION
In this section the measurements are described in situations introduced in chapter III. The position dependence of the error and the effect of the discretization are shown.
A. Pinhole camera
First the pinhole camera model is used. Provided that the points are calculated without rounding, this approach should come close to the theoretical limits and the computation error has to be near zero.
The measurements are done with double precision and the error of the angles is in the range of picodegree as shown in Fig. 2, which is the range of the error introduced by the numeric representation. Indeed this error can be seen as zero in the point of the computation part.
Fig. 2. angles calculated from pinhole model without rounding and their error to ground truth; a) the original angles with black (covered by calculated angles) and the calculated angles with blue; on the bottom of the figure the error values for each calculated angle
In Fig. 2. a) the real rotation angles versus the calculated angel values are shown, and the part b) depicts the error of the estimated angle, which is the difference between the two angles. The distance along the axis to the image plane is 2 km (1.24 miles) and the intruder is seen in 24° azimuth and 7°
elevation angle offset.
Let us assume that a typical HD camera is used to record the scene. This camera is calibrated and the recorded pictures are undistorted, thus the pinhole camera model can be a valid approximation. The difference between this measurement scenario and the one stated above is that here the image coordinates are discrete integer values and the image plane is finite.
According to the measurements, the precision of the estimation with a given camera depends on the subtended angle and the relative distance along the axis. Undoubtedly, it isn’t surprising because the larger the distance the smaller
the intruder in the image and the bigger the altitude difference the more you observe the wing of the intruder.
The three figures (Fig. 3, Fig. 4, Fig. 5) show examples where the relative distance along the axis is 1 km (0.62 miles), the resolution is 1920x1080 pixels, the horizontal field of view is 50° and the pixels are squares. The wingspan of the intruder is 11m (36 ft 1 in), which is the wingspan of Cessna 172.
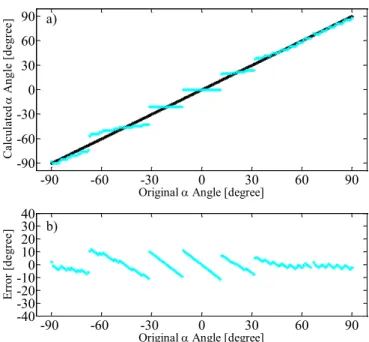
Fig. 3. angles calculated from pinhole model with rounding and their error to original rotation angles; a) the original angles with black and the calculated angles with cyan; b) the error values for each calculated angle (max ±6°); the intruder is seen in (24°, 14°) direction and the distance along axis is 1km
Fig. 4. angles calculated from pinhole model with rounding and their error to original rotation angles; same as before, the subtended angle is (24°, 7°) and the maximum error is ±11°; the asymmetry in the error function is caused by the position of the intruder
-90 -60 -30 0 30 60 90
-90 -60 -30 0 30 60 90
Original a Angle [degree]
Calculated a Angle [degree] a)
-90 -60 -30 0 30 60 90
-2 0 2
x 10-12
Original a Angle [degree]
Error [degree] b)
-90 -60 -30 0 30 60 90
-90 -60 -30 0 30 60 90
Original a Angle [degree]
Calculated a Angle [degree] a)
-90 -60 -30 0 30 60 90
-40-30 -20-10102030400
Original a Angle [degree]
Error [degree] b)
-90 -60 -30 0 30 60 90
-90 -60 -30 0 30 60 90
Original a Angle [degree]
Calculated a Angle [degree] a)
-90 -60 -30 0 30 60 90
-40-30 -20-10102030400
Original a Angle [degree]
Error [degree] b)
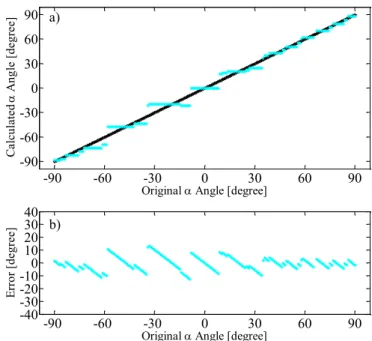
The size of intruder in the image plane is between 15 and 20 pixels, depending on the rotation angle and the position.
The intruder is seen in 14°, 7° and 3.5° elevation successively, and it is seen constantly in 24° azimuth.
Fig. 5. angles calculated from pinhole model with rounding and their error to original rotation angles; same as before, the subtended angle is (24°, 3.5°) and the maximum error is ±37°
The following figure (Fig. 6) shows the maximum error values in each subtended angle with constant azimuth of 24°
and with changing elevation from -14° to 14°. In each position the intruder is rotated with angles from -90° to 90° and the maximum of the absolute of the error is chosen. This measurement shows the position dependence of the calculated . Fig. 6. depicts that the initial error is ±6° and the closer the intruder is to the horizontal axis the bigger the error we get.
Fig. 6. Maximum of absolute value of the errors of the rounded angles calculated with pinhole camera model in different relative vertical positions and from 1 km distance along the axis; in the figure on the horizontal axis the elevation offset angle in which the intruder is seen; on the vertical axis the error in degree with logarithmic scale
Similarly, the bigger the distance along the axis the smaller the intruder is in the image, therefore the spatial
discretization gives higher error value, as shown in the following figures (Fig. 7., Fig. 8.). Furthermore, the proximity to has a greater effect on the error than in the smaller distance case (Fig. 8.).
Fig. 7. angles calculated from pinhole model with rounding and their error to original rotation angles; a) the original angles with black and the calculated angles with cyan; b) the error values for each calculated angle (max ±13°); the intruder is seen in (24°, 14°) direction and the distance along axis is 2km
Fig. 8. Maximum of absolute value of the errors of the rounded angles calculated with pinhole camera model in different relative vertical positions and from 2 km distance along the axis; in the figure on the horizontal axis the elevation offset angle in which the intruder is seen; on the vertical axis the error in degree with logarithmic scale
B. Points by human expert on simulated images
In our simulation environment [6] pictures is taken and the wingtip pixel coordinates are selected by a human expert.
The intruder is placed in space according to section III. 1) and in every position it is rotated by specific angles in the plane. The resolution is 1920x1080 pixels and the horizontal field of view is 50° and the pixels are squares, such as in the previous case A.
-90 -60 -30 0 30 60 90
-90 -60 -30 0 30 60 90
Original a Angle [degree]
Calculated a Angle [degree] a)
-90 -60 -30 0 30 60 90
-40-30 -20-10102030400
Original a Angle [degree]
Error [degree] b)
-14 -12 -10 -8 -6 -4 -2 0 2 4 6 8 10 12 14 5
10 30 90
Elevation Offset [degree]
Error with logarithmic scale [degree]
-90 -60 -30 0 30 60 90
-90 -60 -30 0 30 60 90
Original a Angle [degree]
Calculated a Angle [degree] a)
-90 -60 -30 0 30 60 90
-40-30 -20-10102030400
Original a Angle [degree]
Error [degree] b)
-14 -12 -10 -8 -6 -4 -2 0 2 4 6 8 10 12 14 5
10 30 90
Elevation Offset [degree]
Error with logarithmic scale [degree]
In Fig. 9. a) the ground truth values are with black (covered). The angles calculated from pinhole camera model are shown with blue; the values calculated from rounded coordinates are shown with cyan and the angles calculated from points selected by hand are shown with green. On Fig. 9.
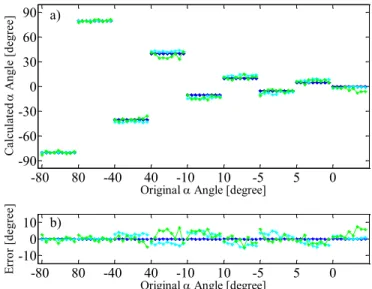
b) the error values are shown and the colours are similar to previous. The figure depicts only the result of the measurement in one specific distance. The intruder was placed in 9 different positions and was rotated with 9 different angles (-80°, 80°, -40°, 40°, -10°, 10°, -5°, 5°, 0°). The other results obtained from another distances are similar to that are described previously in section A, thus the altitude difference is in inverse ratio to the error.
Fig. 9. angles calculated from coordinates selected by a human expert on images generated by FlightGear simulator; a) angles in different vertical positions, on the vertical axis the angle values, on the horizontal axis the real rotation angles in 9 different positions; b) the error; original angles with black (covered), angles calculated from pinhole model with blue, angles calculated from pinhole model with rounding with cyan, angles calculated from coordinates selected by hand with green
The measurements above shows that with good wingtip coordinates in realistic situation the error can be near to theoretical minimum.
C. Points by automatic algorithm on simulated images Measurements on images generated in our simulation environment [6] are run. Images are rendered by FlightGear flight simulator. The positions of the aircrafts are calculated from pinhole camera model used in chapter A.
Images are segmented with our segmentation algorithm (Fig. 10.Fig.). In this specific situation there is no additional noise on the images and the background is homogenous (Fig. 11. (a)). The approaching aircraft is composed by darker and brighter pixels than the background. Therefore, two adaptive thresholds are used to get the pixels of the aircraft(Fig. 11. (c), (d)).
After the combination of the two results with the binary OR operation, a binary closing [8] is run to connect the found pixels(Fig. 11. (e)). After the closing a binary recall operation
is applied, based on the binary image from an adaptive threshold with high threshold value (Fig. 11. (a)), to filter out noise remaining after the other two adaptive thresholds. The shape of the detected aircraft is given by the result of the reconstruction (Fig. 11. (f)). These segmentation steps can be run on CNN-UM [11].
Adaptive threshold high Adaptive
threshold darker OR
Recall Input images Invert
Adaptive threshold brighter
Closing
Segmented image
Fig. 10. Flowchart of image segmentation
Fig. 11. Segmentation steps; (a) part of the input image, (b) result of adaptive threshold high, (c) result of adaptive threshold darker, (d)
result of adaptive threshold brighter, (e) result of closing, (f) segmented image
The error of the automatic wingtip detection algorithm running on simulated images is measured. The simple algorithm determines the wingtip coordinates from the segmented images. The extreme of y and z coordinates are used in appropriate order to get the coordinates (Fig. 12).
Fig. 12. enlarged images of wingtip points selected by a human expert and by the algorithm on images generated by FlightGear simulator; on the left an example when the algorithm gives good points, on the right when the algorithm make a mistake; with green the points given by human expert, with red points given by the algorithm
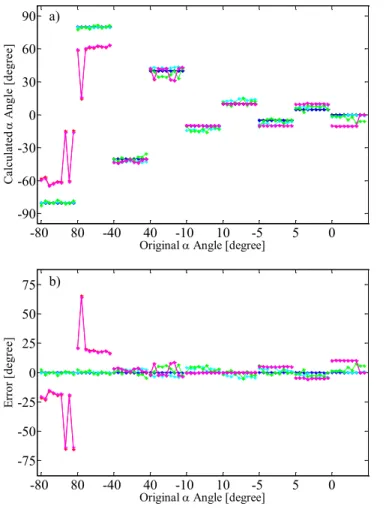
Fig. 13. depicts one example, where similarly to section B, the intruder had been placed in a specific locations in space and then it was rotated with specific angles (same as before).
In the figure the ground truth is with black (covered); the values from pinhole camera model are with cyan and blue; the values form points selected by human expert are green; the values from automatic algorithm are with red and the values calculated from corrected points are with magenta.
In this case when the intruder had been rotated with 80°
-80 80 -40 40 -10 10 -5 5 0
-10 0 10
Original a Angle [degree]
Error [degree]
b)
-80 80 -40 40 -10 10 -5 5 0
-90 -60 -30 0 30 60 90
Original a Angle [degree]
Calculated a Angle [degree] a)
and with -80° angles, the error of the estimation is bigger, because the simple algorithm couldn’t distinguish between the pixels of the wing and the pixels of the tail.
In contrast, in the mid-range the performance of this really simple algorithm is almost the same as the performance of the human expert.
Fig. 13. angles calculated from coordinates calculated by the automatic algorithm on images generated by FlightGear simulator; a) angles in different vertical positions, on the vertical axis the angle values, on the horizontal axis the real rotation angles in 9 different positions; b) the error; original angles with black (covered), angles calculated from pinhole model with blue, angles calculated from pinhole model with rounding with cyan, angles calculated from coordinates selected by hand with green, angles calculated automatically with red and the corrected values with magenta
V. CONCLUSIONS
The reachable accuracy of the orientation calculation of visually detected remote airplanes was studied. The orientation calculation was based on the detection of the wingtips. As it turned out the relative orientation of the remote aircraft (depicted by ) can be calculated if it is on a straight course, and its level differs from the observer.
Naturally, the orientation measurement is more accurate when the level difference is higher, and the airplane is closer.
The exact reachable accuracy figures are shown in charts, and their calculation methods are given.
The acquired measurements will be used to enhance the
estimation accuracy of the currently existing EKF based sense and avoid system.
ACKNOWLEDGMENT
The support of the grants TÁMOP-4.2.1.B-11/2/KMR- 2011-0002 and TÁMOP-4.2.2/B-10/1-2010-0014 is gratefully acknowledged. The ONR Grant (Number: N62909-10-1- 7081) is greatly acknowledged.
REFERENCES
[1] P. E. Ross, “When Will We Have Unmanned Commercial Airliners?” IEEE Spectrum Magazine, December 2011
[2] T. Hutchings, S. Jeffryes, and S. J. Farmer,
“Architecting UAV sense & avoid systems,” Proc.
Institution of Engineering and Technology Conf.
Autonomous Systems, 2007, pp. 1–8.
[3] G. Fasano, D. Accardo, L. Forlenza, A. Moccia and A.
Rispoli, “A multi-sensor obstacle detection and tracking system for autonomous UAV sense and avoid”, XX Congresso Nazionale AIDAA, Milano, 2009.
[4] T. Zsedrovits, Á. Zarándy, B. Vanek, T. Péni, J. Bokor, T. Roska, “Collision avoidance for UAV using visual detection”, ISCAS 2011
[5] B. Vanek, T. Péni, T. Zsedrovits, Á. Zarándy, J. Bokor and T. Roska, "Performance Analysis of a Vision Only Sense and Avoid System for Small UAVs", AIAA Guidance, Navigation, and Control Conference 2011 [6] T. Zsedrovits, Á. Zarándy, B. Vanek, T. Péni, J. Bokor,
T. Roska, “Visual Detection and Implementation Aspects of a UAV See and Avoid System”, ECCTD 2011
[7] B. Vanek, T. Péni, J. Bokor, Á. Zarándy, T. Zsedrovits and T. Roska., "Performance Analysis of a Vision Only Sense and Avoid System for Small UAV", European Workshop on Advanced Control and Diagnosis 2011 [8] Pratt, W. K., Digital Image Processing: PIKS Inside,
PixelSoft Inc., Los Altos, CA, 2001
[9] Hernandez, M. L., “Optimal Sensor Trajectories in Bearings-Only Tracking,” Tech. rep., QinetiQ, 2004.
[10] Stengel, R., Flight Dynamics, Princeton Press, 2004.
[11] T. Roska, L. Kék, L. Nemes and Á. Zarándy, CNN Software Library, (Templates and Algorithms), Vol.
DNS-1-1997, Comp. and Auto. Ins. of the Hung. Acad.
of Sci., Budapest, Hungary, 1997.
-80 80 -40 40 -10 10 -5 5 0
-90 -60 -30 0 30 60 90
Original a Angle [degree]
Calculated a Angle [degree]
a)
-80 80 -40 40 -10 10 -5 5 0
-75 -50 -25 0 25 50 75
Original a Angle [degree]
Error [degree]
b)